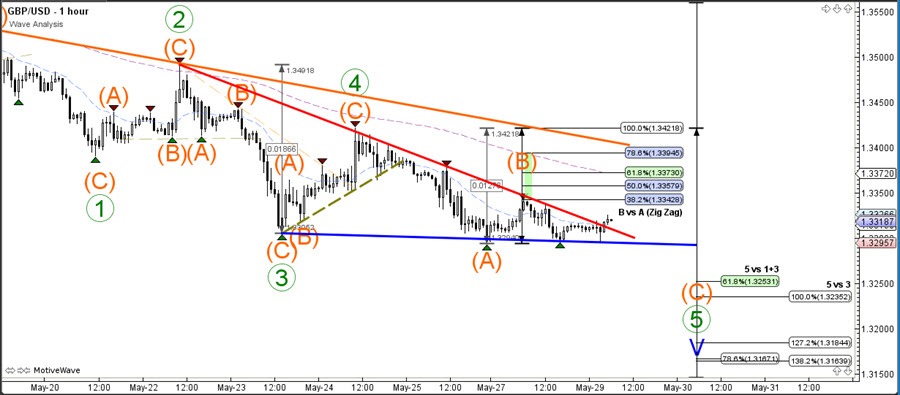
The GBP/USD is building a descending wedge chart pattern and the trend lines are key levels for a bounce or breakout. A bearish breakout could see price fall towards the Fibonacci targets of wave 5 (blue) whereas a bullish breakout indicates a larger bullish correction.
The GBP/USD downtrend is still showing the potential for continuation if price is able to break below the support trend line (blue). A bearish break below 1.3250 would probably change the current wave pattern and make it more likely that the current bearish momentum is a wave 3 rather than a wave 5.
The GBP/USD seems to be building an ending diagonal pattern, which means that all 5 waves (green) are composed of a 3 wave ABC pattern. A bullish bounce could see price move up towards the Fibonacci retracement levels of wave B (orange) whereas a bearish breakout could see price fall towards the wave 5 targets. The wave 5 (green) should be the shortest wave of all 5 waves and therefore a break below the 1.3225-50 support zone invalidates it.