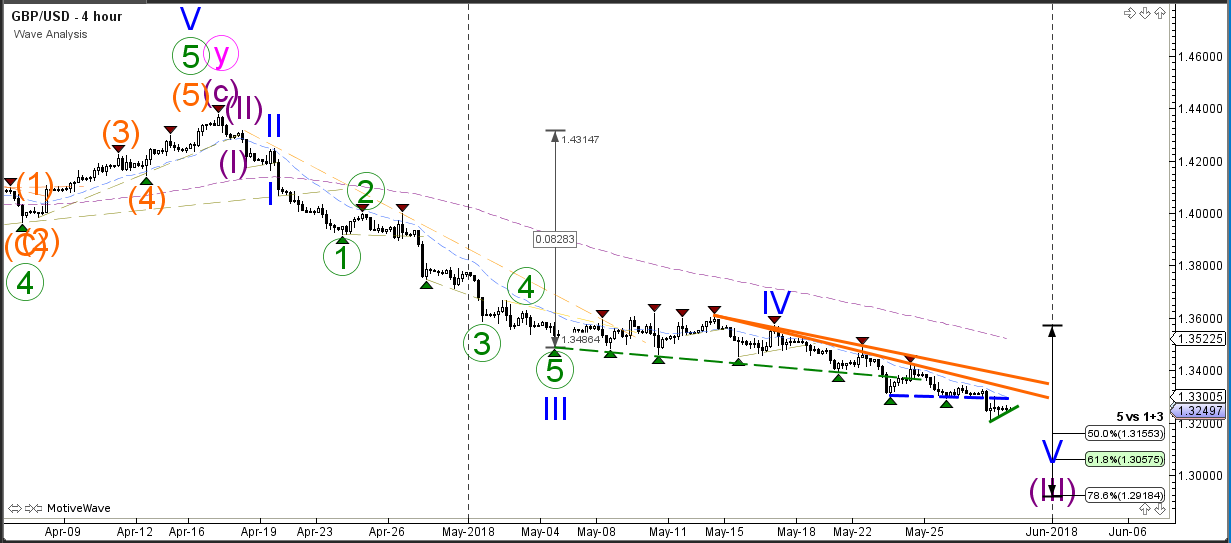
The GBP/USD bearish momentum broke below a key round level at 1.3250 and the support trend line of the descending wedge chart pattern (dotted blue). It seems more likely that price is now building a wave 3 impulse (purple) as long as price stays below the resistance trend lines (orange). A bearish continuation could see price move towards the Fibonacci targets of wave 5 (blue).
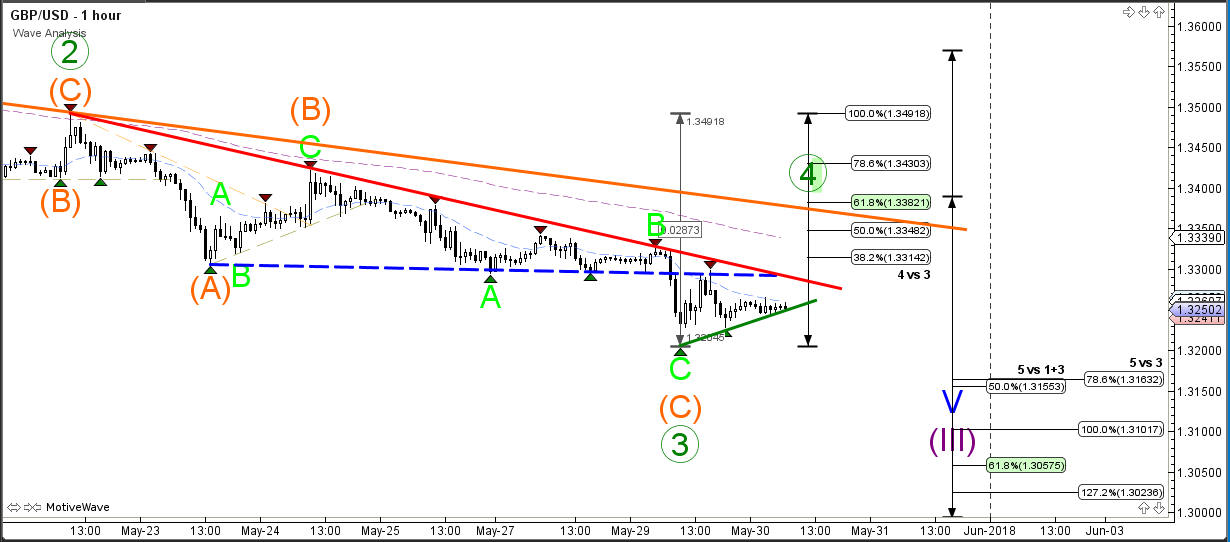
The GBP/USD ending diagonal pattern is only valid if the GBP/USD retraces back to the 61.8% Fibonacci retracement level of wave 4 (green). A bearish bounce at a shallower Fibonacci levels would indicate that there is no ending diagonal but rather a bearish impulse. In both cases price could continue with the downtrend towards the Fibonacci targets.