
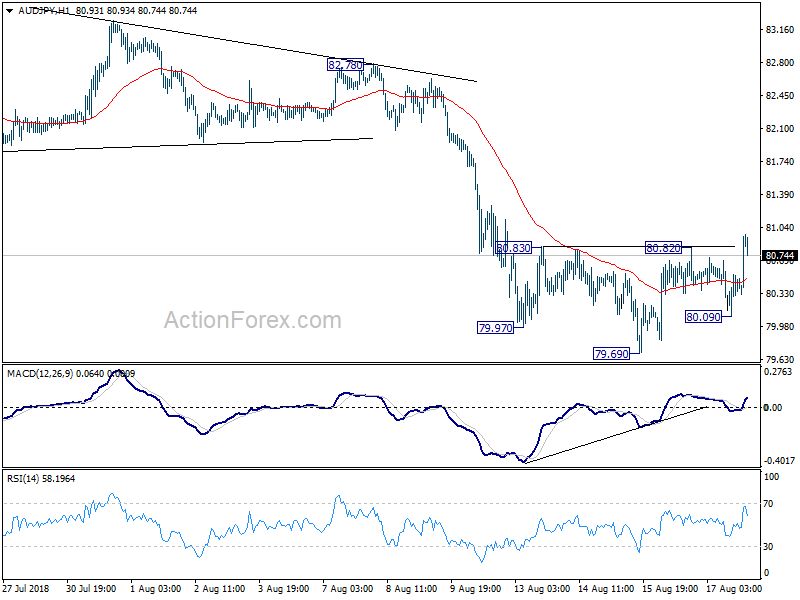
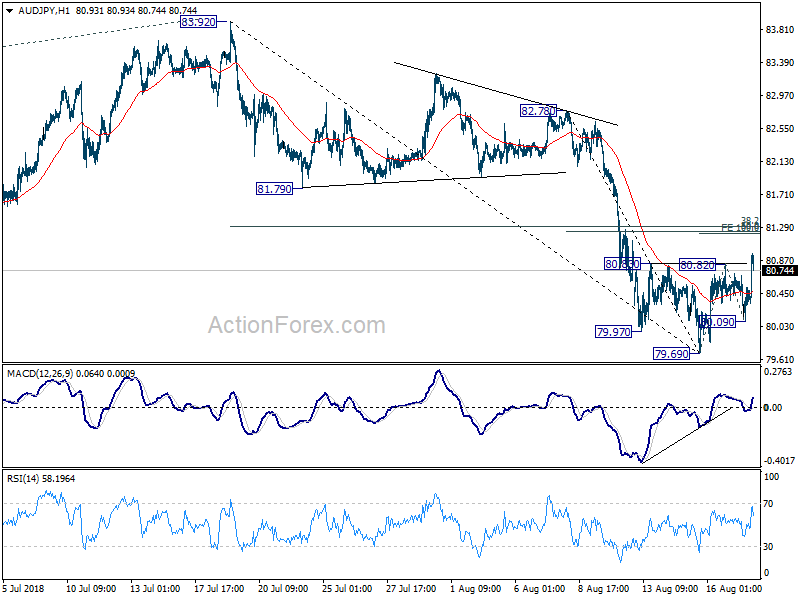
AUD/JPY could be a very interesting pair to watch this week. From the hourly chart, there’s clearly a beautiful head and shoulder bottom pattern (ls:79.97, h: 79.69, rs: 80.09). Bullish convergence condition is also seen in hourly MACD. So, is AUD/JPY ready for a powerful upside move?
We’re quite skeptical on it. First of all, we’d like to reiterate that head and shoulder is a classic “reversal” pattern. Believe nobody would disagree to that. But we’d like to clarify that meaning of “reversal”. It means both a) ending the prior trend to start a new trend in the opposite direction, OR b) halting the current trend, starting a counter trend move to correct the prior move. In case of b) the subsequent move could be in form of any corrective pattern, a rectangle, a wedge, a triangle, etc.
To assess the chance a) for AUD/JPY, we’ll have to see if the pair has completed a down trend that’s in a larger degree of the head and shoulder pattern. That is, we’ll have to look at the bigger picture to see if the conditions are in place for a larger reversal.
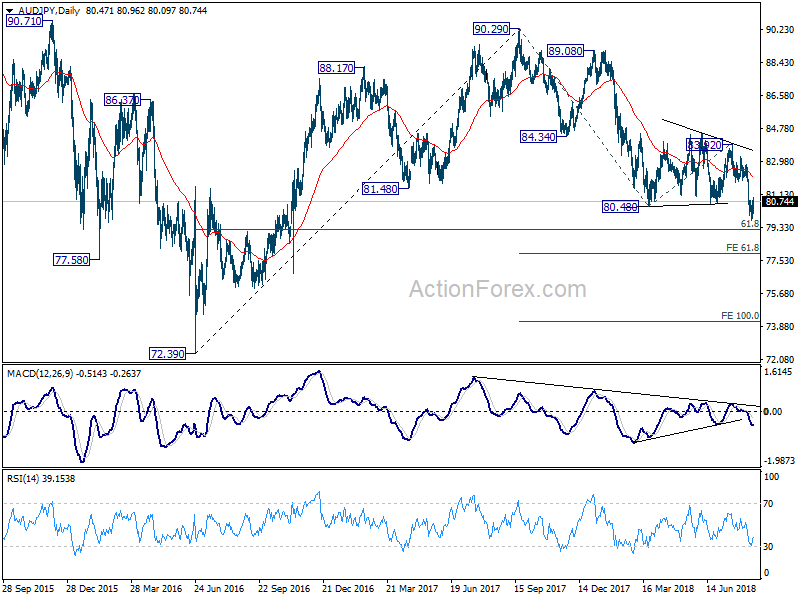
Firstly, AUD/JPY has just resumed the down trend from 2017 high at 90.29, by breaking 80.48 key support level, with solid downside momentum. From the daily MACD, we see that downside momentum is increasing, rather than decreasing.
Fall from 90.29 is either correcting the up trend from 72.39 to 90.29, or starting a new long term down trend. But even for the former case (less bearish), it hasn’t matched target of 61.8% retracement of 72.39 to 90.29 at 79.22 yet. So, we don’t think conditions are in place to reverse the trend from 90.29 yet.
Looking a bit closer, if the above view is correct, then fall from 83.92, which started the downside breakout, should be a five-wave sequence. Having a look at the 4 hour chart, 79.69 should be, at worst the end of the third wave from 83.92. Hence, rebound from there is not even reversing the fall from 83.92.
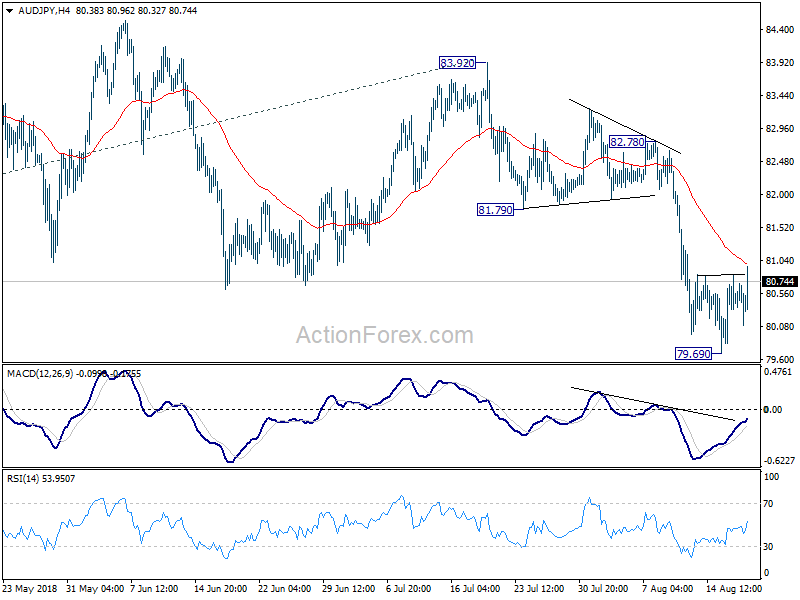
So in our view, the rebound from 79.69 is likely just a counter trend move that corrects the fall from 82.78. That is, the above mentioned case b). With that in mind, 4 hour 55 EMA (now at 80.99) is the first hurdle. But more importantly, an important cluster resistance zone lies ahead. That is, 100% projection of 76.69 to 80.82 from 80.09 at 81.22, 50% retracement of 82.78 to 79.69 at 81.23, 38.2% retracement of 83.92 to 76.69 at 81.30. We do not expect, as a corrective move, the rise from 79.69 to pass through this 81.22/30 resistance zone.
For head and should pattern, the target is usually calculated by adding the depth of the head to the neck line. That is, in this case, depth of the head is 80.82-79.69= 1.13. The target is thus 80.82+3.13=81.98. It’s “substantially” higher than the above mentioned 81.22/30 resistance zone. Hence, we’d believe it’s going to be a head and shoulder pattern failure.
As usual, we could be wrong. Let’s see.
Tell us your views too.


