Sample Category Title
EUR/USD Breaks Through 200-Hour SMA
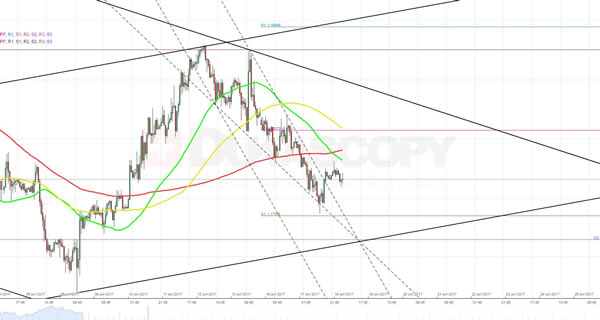
In accordance with expectations, the Dollar continued to gain value against the common European currency, experiencing pressure from the 55-, 100- and 200-hour SMAs as well as the weekly PP. Despite the fact that the pair failed to pass through the weekly S1 at 1.1735 from the first attempt, it is still expected to move in the southern direction, trying to reach the 100% Fibonacci retracement level at 1.1715. This scenario is supported not only by the average market sentiment, which remains 57% bearish, but also by an aggregate of technical indicators, which sends strong sell signal for this trading session. The only event than might add some volatility in the markets and lead to short-term recovery of the Euro are opening remarks that will be delivered by Mr. Draghi at the ECB conference.
EUR/USD: US Import Prices, Industrial Production
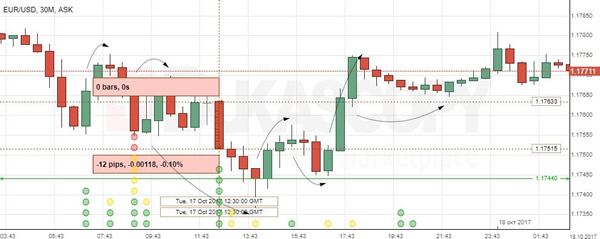
The Euro kept falling against the Greenback after the row of releases showing mostly strong results for the US. The EUR/USD currency pair lost 12 base points to touch the weekly low of 1.1744. Though, bulls managed to change the direction of the trend.
The Labour Department showed that the US import prices grew at the strongest pace of 0.7% in more than a year in September, due to higher costs of food and petroleum. Meanwhile, underlying inflation marked a modest increase of 0.3% in the reported period. The following report from the Fed showed that the US industrial production gained 0.3% in the prior month amid fading effects of Hurricanes Irma and Harvey, allowing utilities output to bounce back.
GBP/USD: UK Consumer Price Index
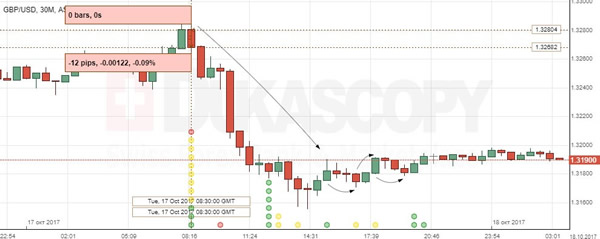
The GBP/USD exchange rate retreated from the peak to start a downward trend after a decent UK economic data. The Sterling weakened against the US Dollar by 12 base points to keep falling to the intraday low and start consolidation nearing the 1.3200 level.
The Office for National Statistics revealed the UK consumer inflation matched growth forecasts with a 3.0% pace in September, as Brexit continued to boost the cost of living in the country. Meanwhile, the strong CPI figure is set to make the Bank of England’s interest rate increase virtually certain. In addition, the release showed that the inflation rate was 0.9% above the wage growth pace, suggesting that the squeeze on incomes has become tighter.
USD Bounces Back As US Yield Curve Shifts To The Upside, Oil Rises Amid Geopolitical Tensions
US inventories to decline for a fourth straight week
Crude oil prices extended gains on Tuesday with the WTI and Brent rising 0.50% and 0.80%, respectively, amid mounting geopolitical tensions and shrinking oil inventories. Donald Trump officially withdraws his certification of Iran compliance deal and leaves the fate of the nuclear deal in the hand of the Congress. After being unable to export its oil production for several years, international sanctions against Iran have been lifted last year, allowing the country to ramp up production. This increasing in supply coupled with building US stockpile clouded the outlook for oil prices.
The recent geopolitical tensions, more specifically in regarding the Iran deal and Kurdistan-Iraq situation, have provided a fresh boost to oil prices and sent both gauge to test multi-months highs. The Brent even surged to its highest level since July 2015 as it tested $59.05.
In addition, the contraction in US crude oil inventories accelerated recently. After shrinking by 2.7mio barrels last week, inventories are expected to contract by 3.25mio barrels which would be the fourth week in a row. Finally, the decline of US rig counts also weights on the supply.
The crude oil price outlook is quite uncertain as a lot of variables have to be taken into consideration. Although the Kurdistan-Iraq situation will only have short-term impact on crude oil prices, the potential reinstatement of sanctions against Iran will have longer-time effects. Against such a backdrop, we remain cautious regarding the oil price outlook. There are many clouds on the horizon and we do not rule out a reversal in the short-term.
US Treasury Report fails to brand China a manipulator again
If markets need further evidence they should fade everything US president Trump say in public we got the semi-annual Treasury report. The most glaring omission was the US treasury against declined to label China a currency manipulator despite very public tough attitude. Most recently seen in current NAFTA negotiations. The Treasury actually soften its tone on China excluding the criticism present in April 2017 report. Although not country met the criterial of “currency manipulators” a few inched closer. In the Treasury report interventions as net purchased of foreign currency, totaling in excess of 2% of economy GDP over a 12-month period. Switzerland and Brazil reached these criteria for the four quarters ending June 17. Trade imbalances were also highlight with China, Germany, South Korea, Japan and Switzerland continue on the list of major trading partners that would be monitored.
Euro Edges Lower, Markets Eye US Housing Data
The euro continues to have an uneventful week. In the Wednesday session, EUR/USD is trading at 1.1743, down 0.20% on the day. On the release front, there are no major indicators out of the eurozone. Earlier in the day, ECB President Mario Draghi spoke at an ECB conference in Frankfurt. Draghi discussed structural reforms in the eurozone economy, but did not address monetary policy. In the US, the focus will be on housing data. Building Permits is expected to slow to 1.25 million, and Housing Starts are forecast to remain unchanged at 1.18 million. On Thursday, the US releases unemployment claims and the Philly Fed Manufacturing Index.
Investors are optimistic about economic conditions in Germany, but the markets expected a bit too much, as German ZEW Economic Sentiment for October missed expectations. Analysts had forecast a surge in investor confidence, which did not materialize. Still, the indicator did improve slightly to 17.6 points, marking a 4-month high. Eurozone ZEW Economic Sentiment disappointed, slowing to 26.7 and also missing expectations. On the inflation front, there were no surprises as Eurozone Final CPI remained steady at 1.5 percent. With the rebound of the eurozone in 2017, inflation has moved higher, but still remains below the ECB’s target of around 2 percent.
The game of brinkmanship between the Spanish and Catalan governments continues, as a Thursday deadline looms. The Spanish has given Catalan President, Carles Puigdemont until Thursday to recant his declaration of independence. If Puigdemont refuses, Madrid has threatened to trigger Article 155 of the Spanish constitution, which would allow the central government to disband the Catalan parliament and impose direct rule. However, this clause has never been used, and could set off a violent reaction in Catalonia, with emotions already at a fever pitch. The deepening constitutional crisis has led hundreds of companies to start leaving Catalonia, and the Standard and Poor’s rating agency has said that the region could face a recession if the situation is not resolve. Investment projects are at a standstill in the region, and if the situation worsens, investors could get nervous and send the euro lower.
DAX Higher On Q3 European Earnings
The DAX has posted gains in the Wednesday session. Currently, the index is at 13,057.00 up 0.46% on the day. On the release front, there are no major indicators out of the eurozone. Earlier in the day, ECB President Mario Draghi spoke at an ECB conference in Frankfurt. Draghi discussed structural reforms in the eurozone economy, but did not address monetary policy. Later in the day, Germany releases the yield on 10-year bonds.
European stock markets have started the Wednesday session with gains, as European corporate earnings for the third quarter begin to roll in. Earnings for Q3 are expected to be 4.5 percent higher compared to Q3 in 2016, and most of the companies on the DAX are showing gains on Wednesday. However, financial stocks are showing little movement, led by Commerzbank and Deutschebank, which are almost unchanged.
Investors are pleased with the robust Germany economy, but the markets overestimated investor optimism, as German ZEW Economic Sentiment for October missed expectations. Analysts had forecast a surge in investor confidence, which did not materialize. Still, the indicator did improve slightly to 17.6 points, marking a 4-month high. Eurozone ZEW Economic Sentiment disappointed, slowing to 26.7 and also missing expectations. On the inflation front, there were no surprises as Eurozone Final CPI remained steady at 1.5 percent. With the rebound of the eurozone in 2017, inflation has moved higher, but still remains below the ECB’s target of around 2 percent.
Technical Outlook: AUDUSD – Bearish Bias Under Daily Cloud
The Aussie dollar remains in red against the greenback on Wednesday and establishing below thick daily cloud which weighs on near-term action.
Near-term bears are re-taking full control after Tuesday's trading ended in long-legged Doji and signaled indecision, although the pair remained below cloud base and maintained negative tone.
Fresh easing eyes pivotal support at 0.7815 (daily Tenkan-sen / 50% of 0.7732/0.7897 upleg), where Tuesday's downside attempts were rejected. Support is also reinforced by converged 10/100SMA's and break here would generate bearish signal for further weakness towards 0.7795 (Fibo 61.8%).
Near-term structure remains bearish while daily cloud caps, however, repeated rejection at 0.7815 support zone would signal bears are running out of steam, but sustained break above daily cloud base is needed to confirm scenario and sideline persisting downside risk.
Res: 0.7834, 0.7848, 0.7860, 0.7897
Sup: 0.7815, 0.7795, 0.7771, 0.7732
EUR/CAD Elliott Wave Analysis
EUR/CAD – 1.4700
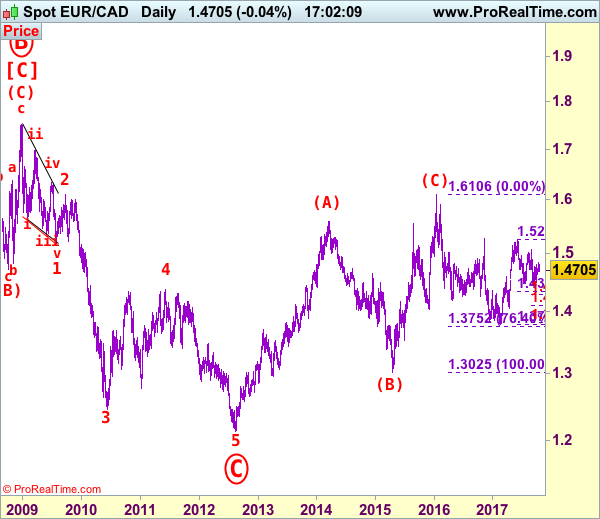
Although the single currency edged higher to 1.439 last week, the subsequent retreat suggests consolidation below this level would be seen and weakness to 1.4635 support cannot be ruled out, however, a daily close below there is needed to suggest the rebound from 1.4441 has ended there, bring further fall to 1.4550-55 and later towards support at 1.4488. Looking ahead, euro needs to penetrate this support to revive bearishness and signal early erratic decline from 1.5259 top has resumed for retest of 1.4441. An drop below this level would extend the fall from 1.5259 to 1.4400 and possibly towards 1.4345-50 (61.8% Fibonacci retracement of 1.3784-1.5259), however, reckon downside would be limited to 1.4290-95 (100% projection of 1.5259-1.4478 measuring from 1.5076) and 1.4190-00 should hold, price should stay above 1.4110-15 (1.236 times projection), bring rebound later.
Our latest preferred count is that larger degree wave [C] from 1.3289 as well as circle wave B ended at 1.7509 in Dec 2008 with (A): 1.6325, (B): 1.4719 followed by wave (C) at 1.7509, hence circle wave C is unfolding with wave 1 ended at 1.5186 (diagonal wave 1), wave 2 at 1.6096, impulsive wave 3 has ended at 1.2451, followed by wave 4 at 1.4380, in view of recent strong rebound, we are now treating the wave 5 as well as larger degree circle wave C has ended at 1.2129, hence (A)-(B)-(C) correction has commenced from there with impulsive wave (C) now unfolding and indicated initial upside target at 1.6000 had been met and reckon 1.6500 would hold.
On the upside, whilst initial recovery to 1.4750-60 cannot be ruled out, reckon upside would be limited and said resistance at 1.4839 should hold, bring another retreat. Above said resistance would signal the rebound from 1.4441 is still in progress for further gain too 1.4900, having said that, price should falter below 1.5000 and bring another decline later.
Recommendation: Stand aside for tis week.
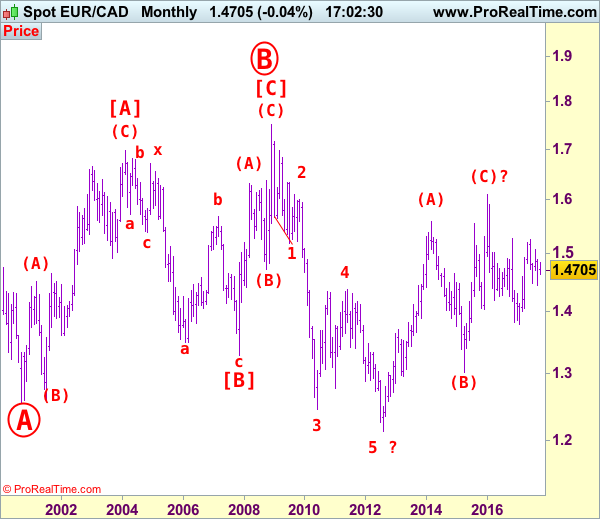
On the bigger picture, our long-term count on the monthly chart is that a big sideways consolidation from 2000 low of 1.2557 has possibly ended at 1.7509 as circle wave B with [A]: 1.6976 ( (A): 1.4513, (B): 1.2612, (C): 1.6976), wave [B]: 1.3289 is a double three with 1st a-b-c: 1.5384, x: 1.6709 and 2nd a-b-c: 1.3289. As indicated above, the wave [C] has ended at 1.7509. The selloff from there is now unfolding which itself should be labeled as an impulsive wave with wave 1: 1.5186 (diagonal wave 1), followed by wave 2: 1.6096 and wave 3: 1.2451, wave 4: 1.4380, wave 5 as well as larger degree circle wave C has possibly ended at 1.2129 and major correction has possibly commenced for retracement of recent decline towards 1.4000, then 1.4180-90 (38.2% Fibonacci retracement of 1.7509-1.2129). Below said support at 1.2129 would risk weakness to psychological support at 1.2000 and then 1.1851 (50% projection of 1.7509-1.2451 measuring from 1.4380) but reckon 1.1500 would remain intact, bring reversal later.
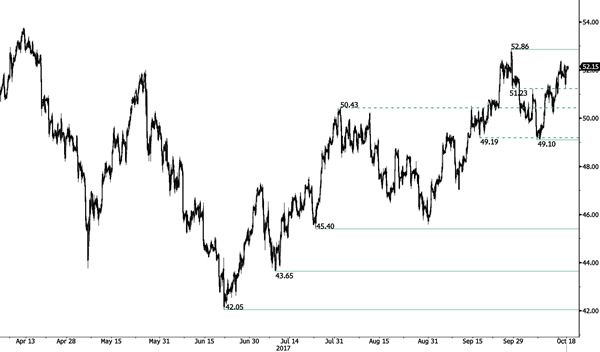
CRUDE OIL Monitoring Resistance At 52.86
Crude oil is pushing higher within a range defined by the support at 50.43 and the strong resistance lies at 52.86 (28/09/2017). Expected to show continued increase within this range.
In the long-term, crude oil has recovered after its sharp decline last year. However, we consider that further weakness are very likely. For the time being the pair lies in an upside momentum. Strong support lies at 35.24 (05/04/2016) while resistance can now be found at 55.24 (03/01/2017 high).
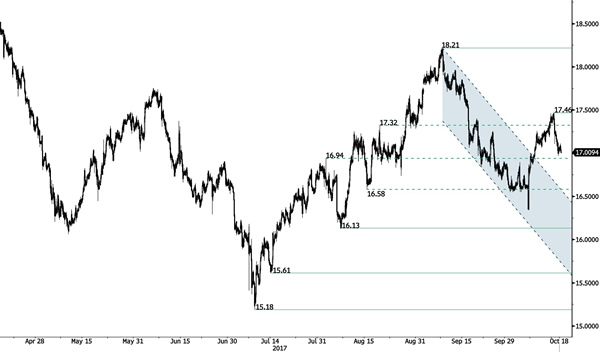
SILVER Approaching The Support At 16.94
Silver is weakening and is now close to the support at 16.94. Hourly resistance is given at 17.46 (13/10/2017 high). Additional support can be found at 16.13 (06/10/2017 low). Hourly resistance can be found at 17.10 (intraday high).
In the long-term, the trend is rater negative. Further downsides are very likely. Resistance is located at 25.11 (28/08/2013 high). Strong support can be found at 11.75 (20/04/2009).