
Sample Category Title
EUR/USD Weak Recovery Bounce
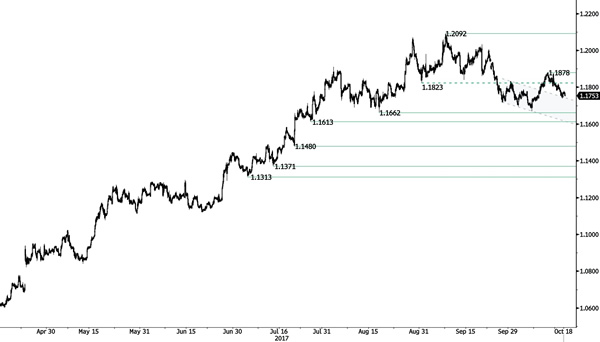
EUR/USD momentum is reversing since the pair has set up an hourly resistance at 1.1878 (12/10/2017 high). Strong support is given at a distance at 1.1662 (17/08/2017 low). Expected to show some short-term consolidation.
In the longer term, the momentum is now turning largely positive. We favour a continued bullish bias. Key resistance is holding at 1.2252 (25/12/2014 high) while strong support lies at 1.0341 (03/01/2017 low).
Technical Outlook: USDJPY – Stronger Direction Signal On Lift Above Tenkan-Sen
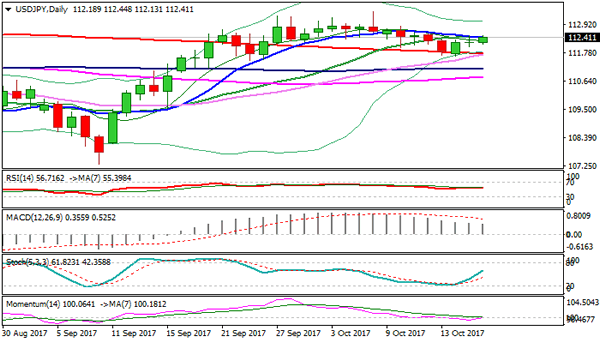
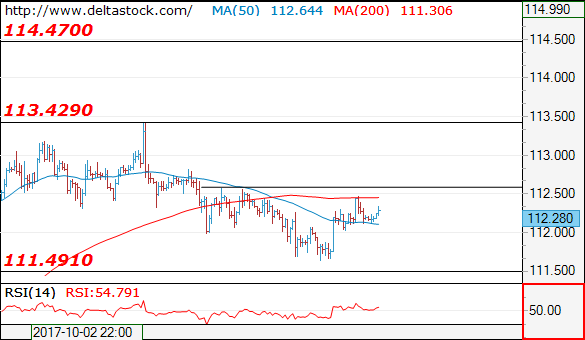
The pair is attempting to break above 10/20SMA's (112.39/42) which capped previous day's rally. Fresh attempts to signal direction are under way after Tuesday's trading ended in long-legged Doji, showing strong indecision. However, near-term bias is turned higher after the pair bounced from key 200SMA support which contained several attacks. Stronger direction signal could be expected on lift above 10/20SMA's and daily Tenkan-sen (112.54) which would expose 112.75 (Fibo 61.8% of 113.43/111.65 downleg) and psychological 113.00 barrier (also Fibo 76.4%). Otherwise, extended consolidation could be expected while the pair holds within 11.40/112.00 range, while return below 112.00 will generate negative signal for renewed attempt at 200SMA.
Res: 112.54, 112.75, 113.00, 113.25
Sup: 112.33, 112.00, 111.75, 111.65
Technical Outlook: GBPUSD Stand At The Back Foot On Wednesday, Awaiting UK Jobs Data For Fresh Signal
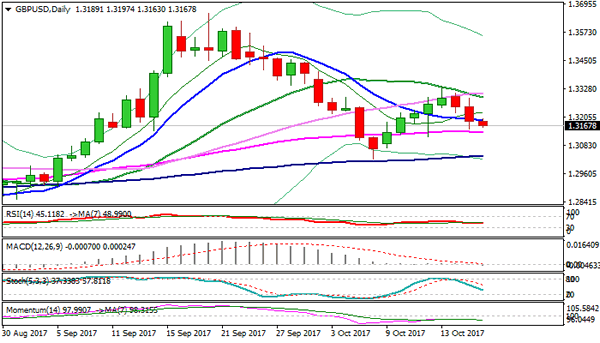
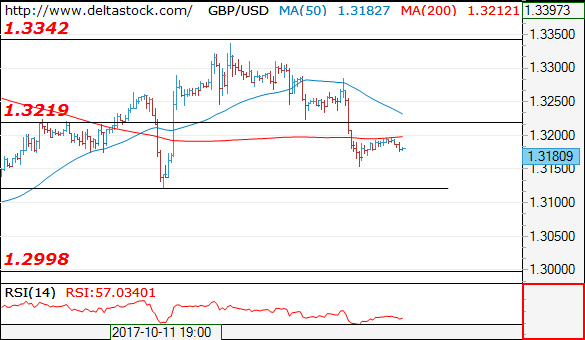
Cable holds in red in early Wednesday's trading but still above Tuesday's low at 1.3154 and pivotal supports at 1.3145/41 (Fibo 61.8% of 1.3026/1.3337 upleg / 55SMA). Tuesday's weakness was rejected at 1.3154 and failed to close below daily Tenkan-sen (1.3182), but negative bias persists for fresh attempts lower after pound fell significantly in past two days. Asian trading was capped by falling 10SMA at 1.3200 zone, maintaining negative stance for fresh probe through 1.3145/41, for test of 1.3100 (Fibo 76.4%) and top of thin daily cloud at 1.3082 which continues to attract bears. UK jobs data are in focus today. Average earnings are expected to stay unchanged at 2.1% in September, while jobless claims are forecasted for 1K rise in September after falling by 2.8K previous month. Unemployment rate is forecasted unchanged at 4.3% in August. Weaker than expected earnings would put pound under increased pressure, while better than expected jobs numbers would boost sterling and sideline immediate downside risk.
Res: 1.3182, 1.3197, 1.3225, 1.3286
Sup: 1.3154, 1.3141, 1.3121, 1.3100
Technical Outlook: EURUSD – Consolidation To Precede Fresh Weakness, Falling Hourly Cloud To Cap Upside Attempts
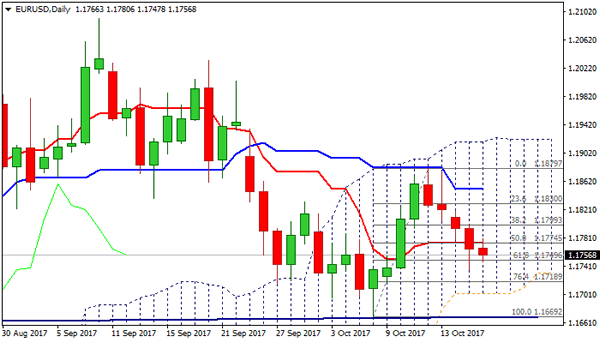
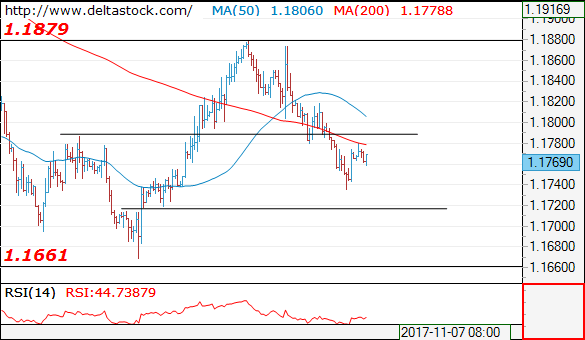
Action in Asia/early Europe was choppy and shaped in long-legged Doji, signaling no clear direction. Strong bears of past four days are taking a breather above cracked support at 1.1749 (Fibo 61.8% of 1.1669/1.1879 upleg, but underlying bear-trend from 1.1879 high remain intact, as bearish signal was generated on Tuesday's close below daily Tenkan-sen (1.1774).
Near-term action targets daily cloud base (1.1702), break of which would generate fresh bearish signal for extension towards another key support at 1.1669 (06 Oct low/neckline of larger H&S pattern, formed on daily chart). Base of thick falling hourly cloud and broken 10SMA cap today's action (1.1782) and should ideally limit upside attempts, however, extended upticks should remain under top of hourly cloud (1.1815) to keep near-term bearish bias in play.
Res: 1.1782, 1.1800, 1.1815, 1.1851
Sup: 1.1749, 1.1702, 1.1669, 1.1620
Trade Idea: GBP/USD – Hold short entered at 1.3315
GBP/USD – 1.3167
Original strategy :
Sold at 1.3315, Target:1.3115, Stop: 1.3315
Position: - Short at 1.3315
Target: - 1.3115
Stop: - 1.3315
New strategy :
Hold short entered at 1.3315, Target:1.3115, Stop: 1.3290
Position: - Short at 1.3315
Target: - 1.3115
Stop:- 1.3290
As cable met renewed selling interest at 1.3287 yesterday and has slipped again, retaining our view that top has possibly been formed at 1.3338 late last week and consolidation with downside bias remains for test of indicated support at 1.3121, however, break there is needed to signal the rebound from 1.3027 has ended, bring further fall to 1.3065-75, then retest of said support at 1.3027.
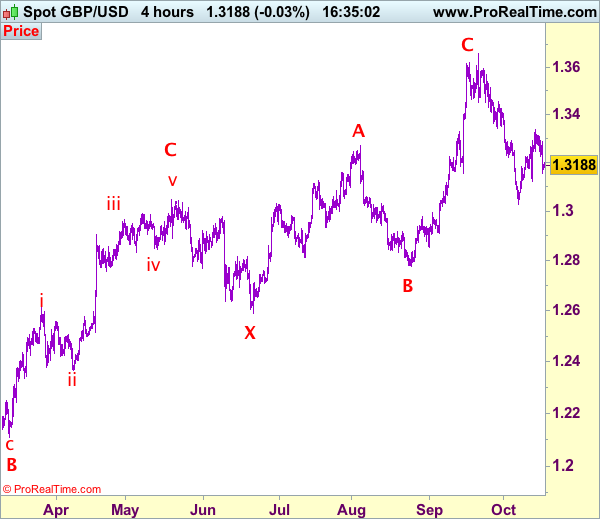
In view of this, we are holding on to our short position entered at 1.3315. Only above said resistance at 1.3312-15 would risk test of said resistance at 1.3338 (last week’s high), break there would abort and signal low has been formed at 1.3027 instead, bring at least a correction of the fall from 1.3658 top to 1.3390-00 later. Our preferred count is that (pls see the attached chart) the wave IV is unfolding as a complex double three (ABC-X-ABC) correction with 2nd wave B ended at 1.2774, hence 2nd wave C could have ended at 1.3658.
Our preferred count on the daily chart is that cable's rebound from 1.3500 (wave (A) trough) is unfolding as a wave (B) with A ended at 1.7043, followed by triangle wave B and wave C as well as wave (B) has ended at 1.7192, the subsequent selloff is the larger degree wave (C) which is still unfolding with minor wave (III) of larger degree wave 3 ended at 1.1986, hence wave (IV) correction is in progress which could either be a triangle wave (IV) of a complex formation but upside should be limited to 1.3500 and price should falter well below 1.4000, bring another decline in wave (V) of 3 for weakness to 1.1500, then 1.1200.
Forex Technical Analysis: EUR/USD, USD/JPY, GBP/USD
EUR/USD
Current level - 1.1796
Current rebound above 1.1735 should be considered corrective, preceding another leg downwards, to 1.1660.
| Resistance | Support | ||
| intraday | intraweek | intraday | intraweek |
| 1.1780 | 1.1940 | 1.1720 | 1.1660 |
| 1.1880 | 1.2030 | 1.1660 | 1.1480 |
USD/JPY
Current level - 112.28
The bias here is positive, for a break through 112.60, towards 113.40 and 114.50. Initial minor support lies at 112.00.
| Resistance | Support | ||
| intraday | intraweek | intraday | intraweek |
| 112.60 | 114.50 | 112.00 | 111.00 |
| 113.40 | 114.50 | 111.50 | 107.30 |
GBP/USD
Current level - 1.3180
The outlook is bearish below 1.3220 resistance, for a break through 1.3120, towards 1.3020 area. Crucial on the upside is 1.3280 peak.
| Resistance | Support | ||
| intraday | intraweek | intraday | intraweek |
| 1.3340 | 1.3340 | 1.3220 | 1.2910 |
| 1.3460 | 1.3650 | 1.3120 | 1.2760 |
Trade Idea: GBP/JPY – Stand aside
GBP/JPY - 148.25
New strategy :
Stand aside
Position: -
Target: -
Stop:-
Despite dropping to 147.80 yesterday, the subsequent rebound has retained our view that further consolidation would take place and another bounce to 149.00-05 cannot be ruled out, however, break of resistance at 149.25 is needed to extend the rebound from 146.95 for retracement of the fall from 152.85 to 149.90-00 and possibly test of resistance at 150.25 but still reckon upside would be limited to 150.90-00 and bring another decline later.
On the downside, expect pullback to be limited to 148.00 and said support at 147.80 should hold, bring another rebound. Below 147.80 would suggest top is possibly formed, bring weakness towards said support at 147.30 but break there is needed to revive bearishness and bring retest of 146.95. Looking ahead, once this level is penetrated, this would confirm the fall from 152.85 top has resumed for retracement of recent upmove to 146.60-65 and then 146.00, having said that, loss of momentum should limit downside and previous support at 145.25 should remain intact.
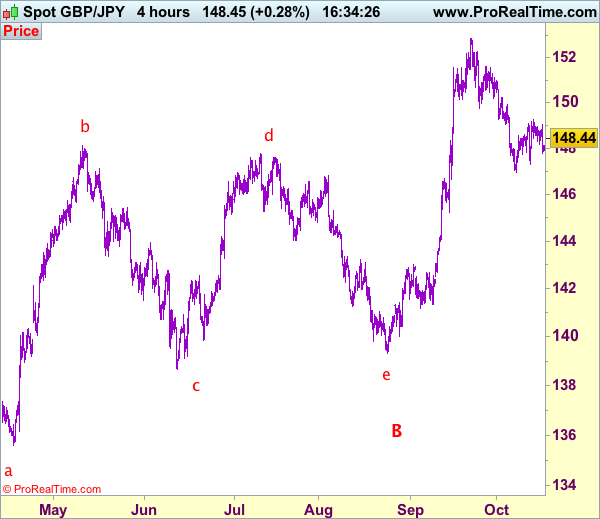
Our preferred count is that larger degree wave V with circle is unfolding from 251.12 with wave (I) 219.34, (II): 241.38 and wave (III) is subdivided into 1: 192.60, 2: 215.89 (23 Jul 2008) and wave 3 ended at 118.87 earlier in 2009. The correction from there to 162.60 is wave 4 which itself is a double three and is labeled as first a-b-c ended at 151.53, followed by wave x at 139.03, 2nd a ended at 162.60, 2nd b at 146.75 and 2nd c leg of wave 4 ended at 163.00. Therefore, the decline from 163.00 to 116.85 is now treated as wave 5 which also marked the end of larger degree wave (III), hence wave (IV) major correction has commenced for retracement of the wave (III) from 241.38 and upside target at 183.95-00 (50% Fibonacci retracement of the wave (II) from 241.38) had been met, a drop below 160.00 would suggest wave (IV) has ended at 195.85, bring decline in wave (V) for initial weakness to 130 (already met) and 120.
Trade Idea: EUR/JPY – Sell at 132.90
EUR/JPY - 132.33
Original strategy:
Sell at 132.70, Target: 130.95, Stop: 133.30
Position: -
Target: -
Stop: -
New strategy :
Sell at 132.90, Target: 130.90, Stop: 133.50
Position: -
Target: -
Stop:-
As euro has rebounded again today, retaining our view that near term consolidation above support at 131.66 would be seen and another bounce to 132.50 cannot be ruled out, however, reckon upside would be limited to 132.90-00 and bring another decline, below said support would add credence to our view that the decline from 134.41 top is still in progress and bearishness remains for this move to bring retracement of recent upmove to 130.95-00 but oversold condition should limit downside to support at 130.62 and reckon psychological support at 130.00 would remain intact.
In view of this, we are looking to reinstate short on recovery as 132.90-00 should limit upside. Only above indicated resistance at 133.50 would abort and risk further gain towards 134.00 but only break there would signal the correction from 134.41 has ended at 131.75, bring retest of this recent high. Once this level is penetrated, this would confirm recent uptrend has resumed and extend headway to 135.00-10 and later 135.50-60.
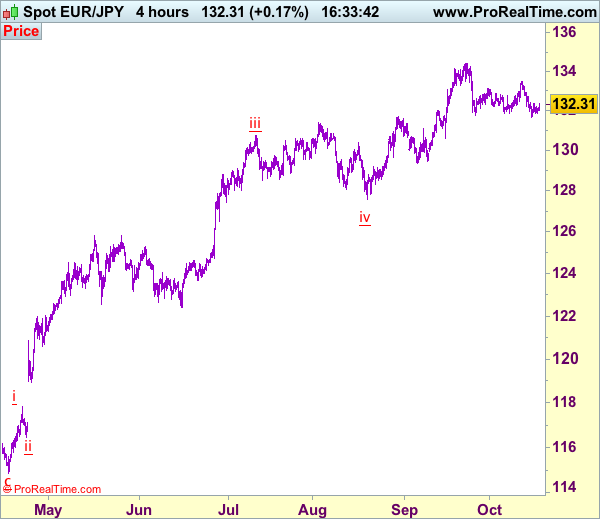
Our latest preferred count is that wave (ii) is ABC-X-ABC which ended at 123.33 and wave (iii) is unfolding with wave iii ended at 100.77, followed by wave iv at 111.57 and wave v as well as the wave (iii) has ended at 97.04, followed by wave (iv) at 111.43 and wave (v) has ended at 94.12 which is also the end of the larger degree v, this also implied the major wave (C) has also ended there, hence major correction has commenced from there with (A) leg unfolding in its lower degree wave c which has possibly ended at 145.69. Under this count, A-B-C wave (B) has commenced with A leg ended at 136.23, wave B at 143.79 and wave C has possibly ended at 149.79.
Our larger degree count is that the decline from 139.26 is wave (C) and is sub-divided into a diagonal triangle i-ii-iii-iv-v with wave i - 105.44, wave ii- 123.33, wave iii - 97.03, wave iv - 111.43, followed by the final wave v as well as the end of wave (C) at 94.12, this also mark the bottom of larger degree wave B. Under this count, major rise in wave C has commenced as an impulsive wave with minor wave III ended at 145.69, wave V is still in progress for further gain to 150.00. Having said that, this so-called wave V could well be the first leg of larger degree 5-waver wave C and this wave C should bring at least a retest of wave A top at 169.97 (July 2008).
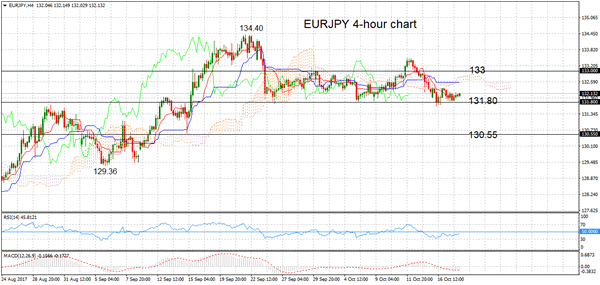
EURJPY Holds Neutral Bias, Risk Tilted To Downside
EURJPY has been neutral since September 25, trading in a broad range between 131.80 and 133.00. Trend and momentum indicators are pointing to more sideways trading in the short-term.
On the 4-hour chart, RSI and MACD are flat, while the Ichimoku cloud analysis also shows a lack of direction in the market.
EURJPY is currently trading at the lower end of the range, with support at 131.80. Immediate risk is tilted to the downside. Breaking below this level would target 130.55 ahead of the September low of 129.36.
Prices would need to break above the 133.00 level to improve the odds for an extension up to 134.40, a level not seen since November 2015. Clearing this peak would see a resumption of the longer-term uptrend.
The intraday bias is neutral as prices consolidate just above the lower end of the broader range. In the bigger picture, EURJPY is lacking direction after pausing and pulling back from a strong rally in September.
Trade Idea: AUD/USD – Hold short entered at 0.7875
AUD/USD – 0.7833
Original strategy:
Sold at 0.7875, Target: 0.7700, Stop: 0.7900
Position: - Short at 0.7875
Target: - 0.7700
Stop:- 0.7935
New strategy :
Hold short entered at 0.7875, Target: 0.7700, Stop: 0.7890
Position: - Short at 0.7875
Target: - 0.7700
Stop:- 0.7890
Although aussie found support at 0.7818 and recovered, if our view that top formed at 0.7897 late last week is correct, upside would be limited to 0.7860-65 and bring another decline to 0.7800, break there would add credence to this view and bring test of 0.7770-75, break there would provide confirmation, then retest of said support at 0.7733 would follow, below there would signal recent fall from 0.8125 top has resumed for weakness to 0.7700-10 and later towards 0.7660-65.
In view of this, we are holding on to our short position entered at 0.7875. Only above previous support at 0.7908 (now resistance) would defer and risk a stronger rebound to 0.7950 but resistance at 0.7986 should remain intact and bring another decline later.
On the 4-hour chart, recent upmove from 0.7329 is unfolding as an impulsive rise with wave 3 as well as smaller degree wave (iii) extending, only minor wave v of (iii) has ended at 0.8125, hence bullishness remains for this move to extend headway to 0.8200, then towards 0.8300, however, reckon upside would be limited to 0.8400 and the final wave 5 should falter below 0.8500, bring correction later.
