Sample Category Title
Trade Idea : EUR/USD – Sell at 1.1800
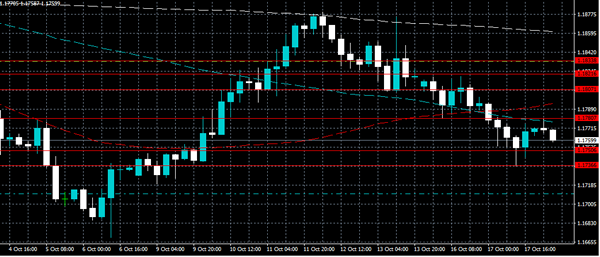
EUR/USD - 1.1762
Most recent candlesticks pattern : N/A
Trend : Near term up
Tenkan-Sen level : 1.1765
Kijun-Sen level : 1.1759
Ichimoku cloud top : 1.1816
Ichimoku cloud bottom : 1.1783
Original strategy :
Sell at 1.1800, Target: 1.1700, Stop: 1.1835
Position : -
Target : -
Stop : -
New strategy :
Sell at 1.1800, Target: 1.1700, Stop: 1.1835
Position : -
Target : -
Stop : -
As the single currency has remained under pressure after falling to 1.1736 yesterday, adding credence to our view that top has possibly been formed at 1.1880 last week and the fall from there may extend weakness towards support at 1.1719, however, break there is needed to retain bearishness and signal the rebound from 1.1669 has ended, then further decline to 1.1700 would follow.
In view of this, we are looking to sell euro on recovery as 1.1800 should limit upside. Above 1.1820 would suggest low is formed instead, bring a stronger rebound to 1.1845-50 but price should falter below said resistance at 1.1880, bring another retreat later.
Trade Idea : USD/JPY – Buy at 112.30
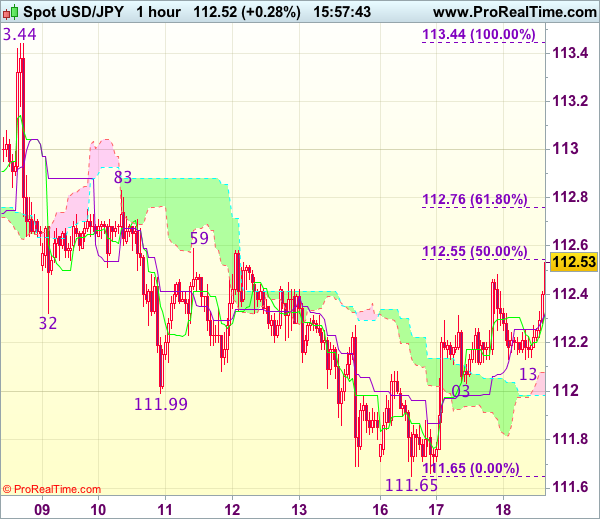
USD/JPY - 112.51
Most recent candlesticks pattern : N/A
Trend : Near term down
Tenkan-Sen level : 112.34
Kijun-Sen level : 112.33
Ichimoku cloud top : 112.08
Ichimoku cloud bottom : 111.98
Original strategy :
Buy at 112.05, Target: 113.05, Stop: 111.70
Position : -
Target : -
Stop : -
New strategy :
Buy at 112.30, Target: 113.30, Stop: 111.95
Position : -
Target : -
Stop : -
As dollar has surged again after finding renewed buying interest at 112.13, adding credence to our view that low has been formed at 111.65 and consolidation with mild upside bias remains for gain to 112.55-59 (50% Fibonacci retracement of 113.44-111.65 and previous resistance), however, break there is needed to signal the fall from 113.44 has ended, bring further gain to 113.00 and 113.30 but said resistance at 113.44 should hold from here due to near term overbought condition.
In view of this, we are looking to buy dollar on pullback as said support at 112.13 should limit downside and bring another rebound later. Below said support at 112.03 would defer and risk weakness to 111.80 but still reckon support at 111.65 (this week’s low) would hold from here. Only break there would revive bearishness for the fall from 113.44 top to extend weakness to 111.47 support and later towards another previous support at 111.11.
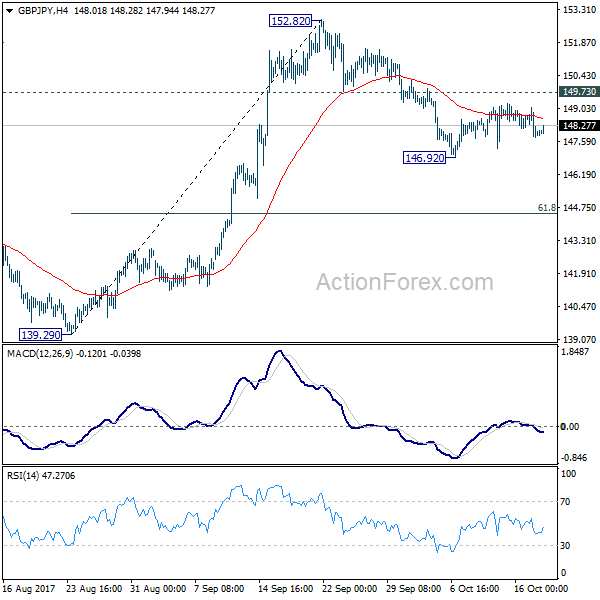
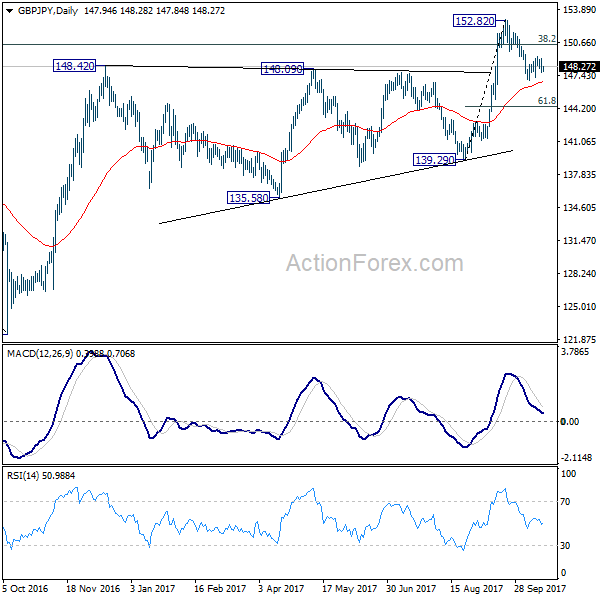
GBP/JPY Daily Outlook
Daily Pivots: (S1) 147.50; (P) 148.28; (R1) 148.80; More
GBP/JPY is still staying in the consolidation pattern from 146.92 temporary low. Intraday bias remains neutral first. With 149.73 minor resistance intact, deeper decline is still expected. . Below 146.92 will target 61.8% retracement of 139.29 to 152.82 at 144.45. Such decline is seen as a correction and we'd look for strong support from 144.45 to bring rebound. On the upside, break of 149.73 support turned resistance will argue that the pull back is completed and turn bias back to the upside for retesting 152.82 high. However, sustained break of 144.45 will put 139.29 key support in focus.
In the bigger picture, medium term rebound from 122.36 is still expected to resume after corrective pull back from 152.82 completes. Firm break of 38.2% retracement of 196.85 to 122.36 at 150.43 will carry long term bullish implications. In that case, GBP/JPY could target 61.8% retracement at 167.78. However, break of 139.29 will indicate rejection from 150.43 key fibonacci level. And the three wave corrective structure of rebound from 122.36 will argue that larger down trend is resuming for a new low below 122.26.
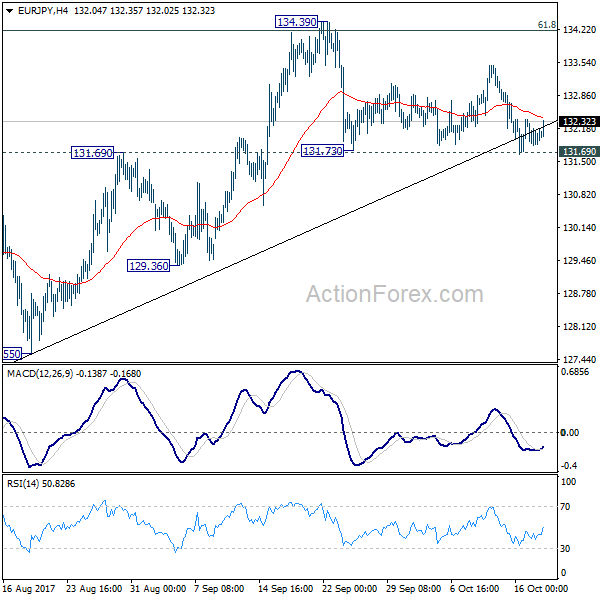
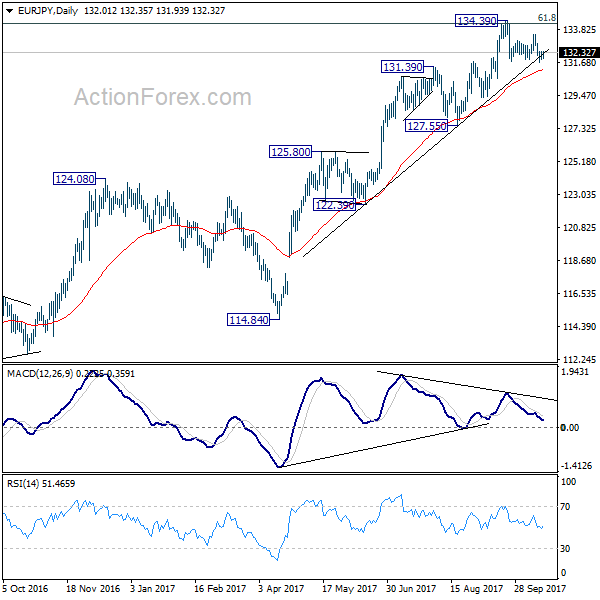
EUR/JPY Daily Outlook
Daily Pivots: (S1) 131.77; (P) 132.07; (R1) 132.29; More...
EUR/JPY is trying to recovery after drawing support from 131.69. Intraday bias stays neutral first. On the downside decisive break of 131.69 will be an early sign of medium term reversal and will target 127.55 key support level. On the upside, firm break of 134.39 is needed to confirm up trend resumption. Otherwise, more corrective trading would be seen.
In the bigger picture, medium term rise from 109.03 (2016 low) is seen as at the same degree as the down trend from 149.76 (2014 high) to 109.03 (2016 low). 61.8% retracement of 149.76 to 109.03 at 134.20 is already met. Sustained break there will pave the way to key long term resistance zone at 141.04/149.76. However, break of 127.55 support will argue that the medium term trend has reversal and will turn outlook bearish for deeper fall.
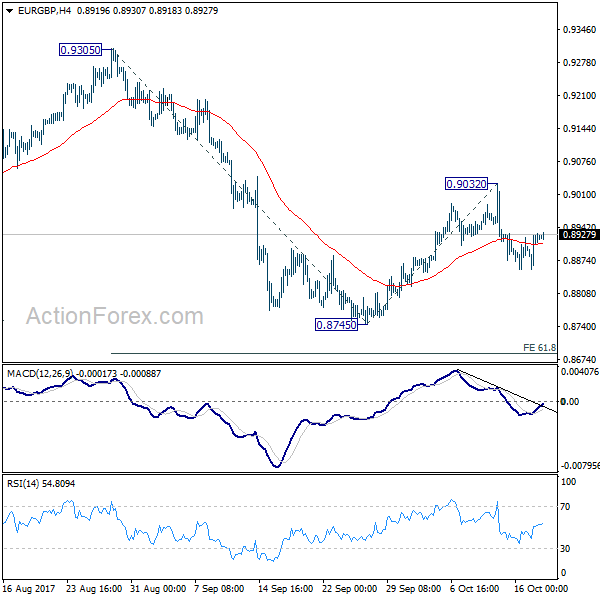
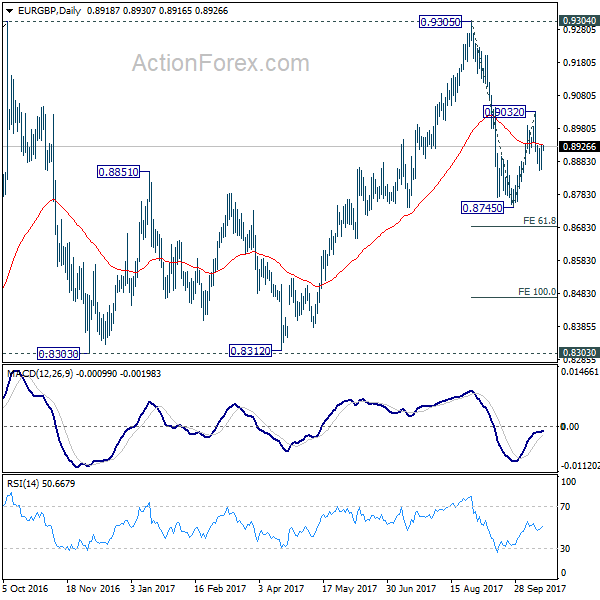
EUR/GBP Daily Outlook
Daily Pivots: (S1) 0.8873; (P) 0.8901; (R1) 0.8945; More...
As long as 0.9032 resistance holds, risk will stay on the downside for EUR/GBP. Fall from 0.9032 should target 0.8745 low first. Break there will resume whole decline from 0.9305. In that case, it should target 61.8% projection of 0.9305 to 0.8745 from 0.9032 at 0.8686, and then 100% projection at 0.8472.
In the bigger picture, there are various ways to interpret price actions from 0.9304 high. But after all, firm break of 0.9304/5 is needed to confirm up trend resumption. Otherwise, range trading will continue with risk of another fall. And in that case, EUR/GBP could have a retest on 0.8303. But we'd expect strong support from 0.8116 cluster support (50% retracement of 0.6935 to 0.9304 at 0.8120) to contain downside.
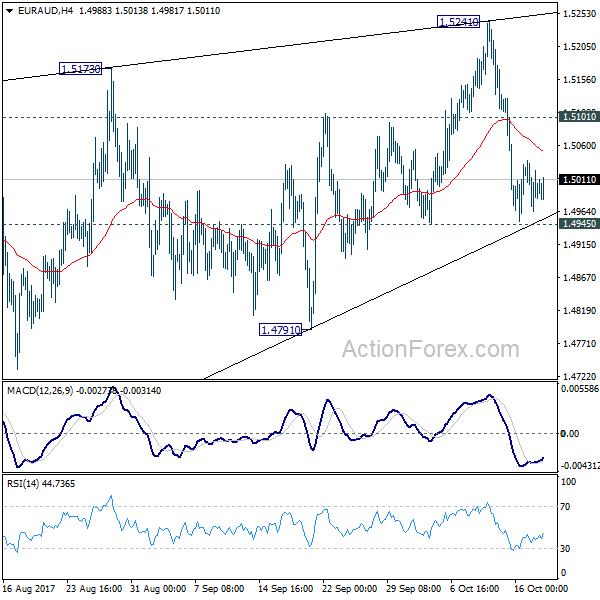
EUR/AUD Daily Outlook
Daily Pivots: (S1) 1.4961; (P) 1.4999; (R1) 1.5035; More....
No change in EUR/AUD's outlook. Deeper decline is expected as long as minor resistance holds. Consolidation pattern from 1.5226 is still unfolding with fall from 1.5241 as the third leg. Break of 1.4945 will affirm this case and send EUR/AUD through 1.4791 to 1.4421 support cluster support (50% retracement of 1.3624 to 1.5226 at 1.4425). We'd expect strong support from there to bring rebound. On the upside, though, above 1.5101 will turn focus back to 1.5241 instead.
In the bigger picture, we're holding on to the view that corrective decline from 1.6587 medium term top has completed at 1.3624. Rise from 1.3624 is expected to extend to retest 1.6587. The corrective structure of the price actions from 1.5226 is affirming this view. Sustained trading above 1.5226 will target a test on 1.6587 key resistance. However, break of 1.4421 support will dampen our view and would drag EUR/AUD lower to retest key support zone around 1.3624.
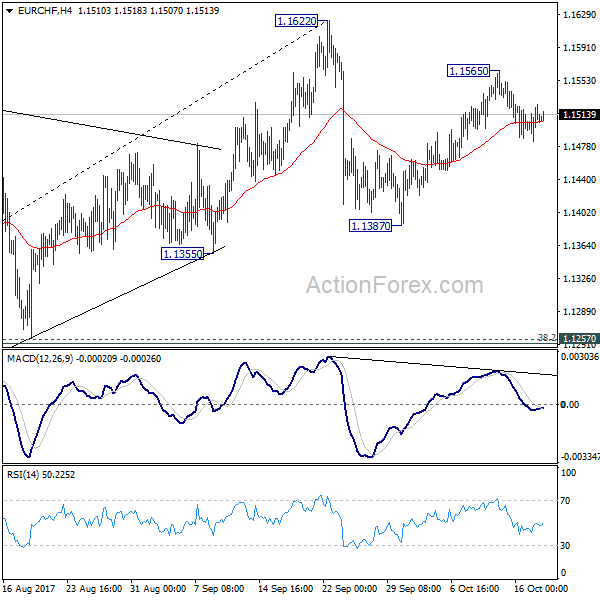
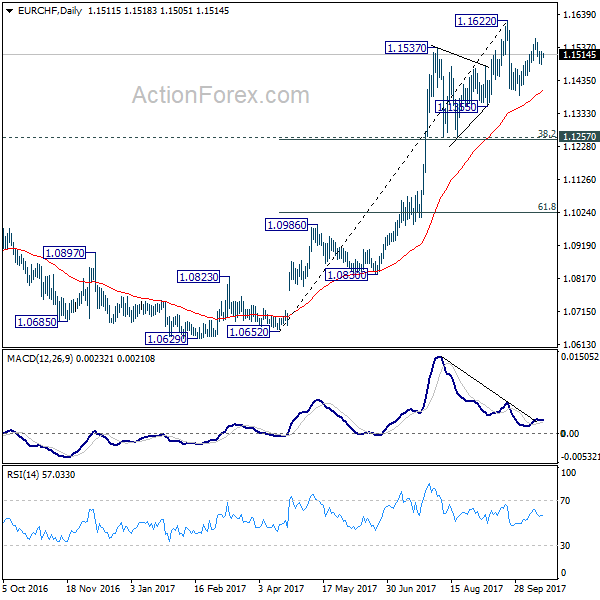
EUR/CHF Daily Outlook
Daily Pivots: (S1) 1.1488; (P) 1.1507; (R1) 1.1530; More....
As noted before, the recovery from 1.1387 could have completed at 1.1565 already. Intraday bias is mildly on the downside for 1.1387 support first. Break there will extend the correction from 1.1622 and should target 1.1257 cluster support (38.2% retracement of 1.0652 to 1.1622 at 1.1251). We'd expect strong support from there to bring rebound.
In the bigger picture, long term rise from SNB spike low back in 2015 is still in progress. EUR/CHF should now be heading back to prior SNB imposed floor at 1.2000. For now, this will be the favored case as long as 1.1198 resistance turned support holds.
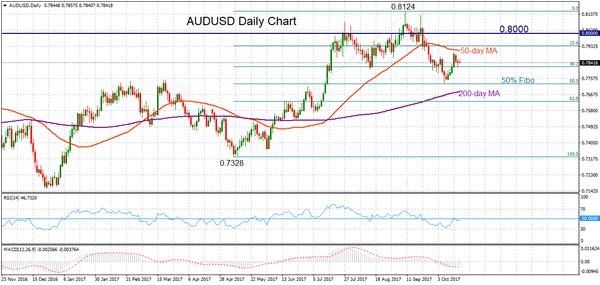
AUDUSD Maintains Soft Undertone In Short-Term
AUDUSD maintains a soft undertone and the neutral to bearish technical indicators are supporting the bearish view for the short term.
The downward move from the 0.8124 peak is still in progress after the recent bounce off 0.7732 reversed back down as prices found resistance at the 50-day moving average.
AUDUSD may be forming a lower top at 0.7897 to continue the downtrend. This would be confirmed if prices break below the 50% Fibonacci retracement level of the uptrend from 0.7328 to 0.8124. This level is acting as support at 0.7725. From here the market remains at risk of additional losses towards the 0.7500 area before re-testing the 0.7328 low.
Should prices break above the 50-day MA (0.7909), AUDUSD would shift the focus back to the upside to target the key 0.8000 level and then the 0.8124 peak, with scope to resume the uptrend that started from 0.7328.
Looking at the bigger picture, the underlying market structure is still bullish as the pullback from 0.8124 is not that deep yet. Prices are currently only at the 38.2% Fibonacci retracement level.
Central Bank Speakers Headline Wednesday Session
Wednesday will be an active session in the global financial markets, as investors sift through a steady stream of economic data and key remarks from a parade of central bank speakers.
Monetary policy is on the docket early Wednesday as European Central Bank (ECB) President Mario Draghi delivers a speech at 08:10 GMT. A stronger Eurozone recovery through the first nine months of the year suggests the ECB could be willing to begin normalizing monetary policy in the near future.
ECB officials Peter Praet and Benoit Coeure are also scheduled to speak during the North American session.
Europe’s data wire kicks off at 08:30 GMT with British employment numbers. The UK’s claimant count change is forecast to rise by 1,000 for the month of September. The ILO-calculated unemployment rate is projected to hold steady at 4.3% annually in the three months ending August.
Average hourly earnings for UK workers is forecast to rise 2% annually over the same period.
The European Commission’s statistical agency will report on Eurozone construction output at 09:00 GMT.
A pair of Federal Reserve officials will kick off the North American session. Federal Open Market Committee (FOMC) member Robert Kaplan and New York Fed president William Dudley will deliver speeches around 12:00 GMT.
Data from the US Commerce Department will report on housing starts and building permits at 12:30 GMT. North of the border, Canada will also release manufacturing data at the same time.
Traders will also be keeping an eye on the Fed’s Beige Book, which is scheduled for release at 18:00 GMT. The Beige Book provides a snapshot of the current US economic situation.
Finally, energy traders will monitor the weekly crude inventory report at 14:30 GMT.
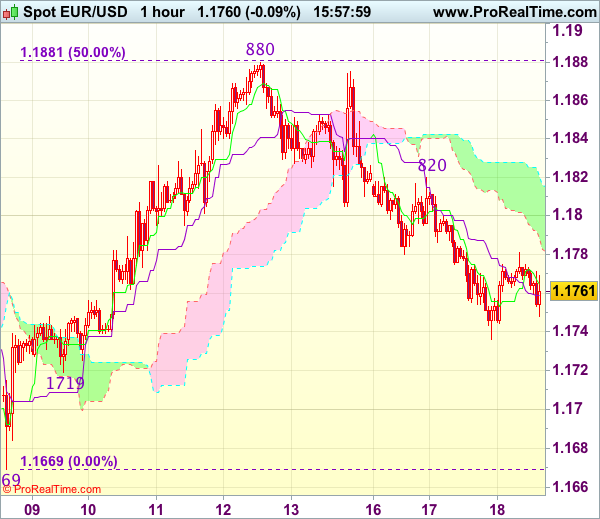
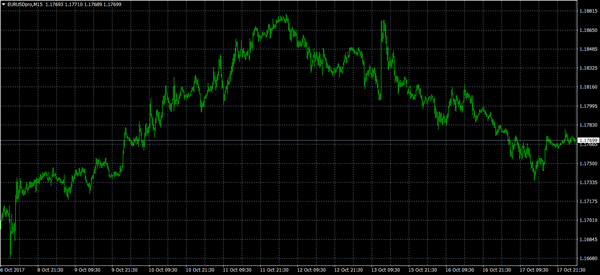
EUR/USD
The euro succumbed to pressure on Tuesday, falling back below 1.1800 US. While the common currency remains supported over the short-term, there is a risk of a further breakdown toward the 1.1700 region. The EUR/USD is currently feeling the pinch of a rebounding US dollar. The world’s most actively traded currency has gained in each of the past four sessions.
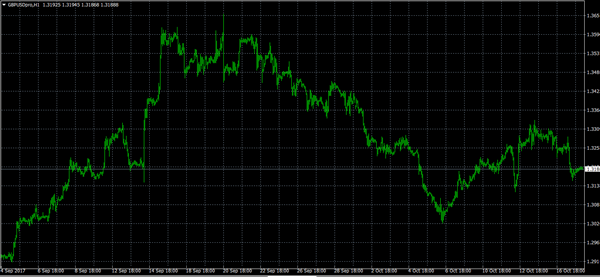
GBP/USD
The British pound also backtracked on Tuesday, as investors continued to back the US dollar. Cable opened around 1.3190, and was little changed at the time of writing. Above 1.32, the GBP/USD is likely to run into resistance near 1.3260. On the flipside, a fall back toward the 1.3160 region would expose the short-term support signal near the 12 October low of 1.3120.
USD/CAD
The USD/CAD reached a high of 1.2573 on Tuesday, which would have marked the best settlement in 11 days. The pair would later surrender most of its gains to settle near 1.2500. The bulls appear to be hesitating now that the USD/CAD is back at 1.2500. This suggests the market will remain neutral for the time being.
EURO Still Bearish Below 1.1780
The euro continues to struggle below the 1.1780 level against the U.S dollar, after earlier finding strong support from the 1.1736 level. Price-action continues to consolidate around the 1.1760 level, as investors begin to focus on a scheduled speech by European Central Bank President Mario Draghi later this morning.
The EURUSD continues to remain under bearish selling pressure while price trades below the 1.1780 resistance level. Further losses can be expected towards the former weekly pivot point, at 1.1740, and the 2015 price-high, at 1.1713. Extended support is found at the euro's 200-week moving average, at 1.1685.
If price-action moves above the 1.1780 level during Wednesday trading, further gains can be seen towards the daily pivot point, at 1.1798, and the euro's weekly pivot point, at 1.1807. Extended intraday resistance is found at the 1.1821 and 1.1833 levels.