Sample Category Title
EURUSD Higher after Solid Data
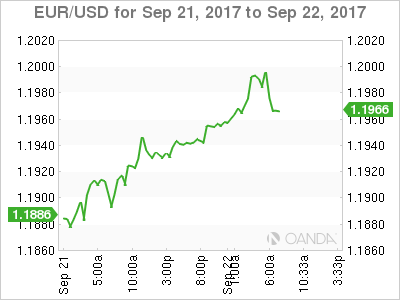
The euro continues to push higher against the U.S dollar in Friday trading, with the EURUSD pair further supported by solid European economic data. The highlight of the eurozone's PMI'S came from the German economy, which came in at 60.6 for the month of September.
Going forward, the EURUSD pair has yet to close price-action above the key 1.2038 technical level on a higher-time frame basis, the pair may remain confined to the 1.2030 to 1.1884 range, until a break-out happens.
The euro has set a daily price high of 1.2004 and a daily low of 1.1938, indicating traders are bullish, but cautious to add long positions over the weekend.
Key EURUSD intraday technical support is found at the 1.1957 whilst the current daily price-low and daily pivot point are both found at 1.1938.
Below 1.1938, the 1.1915 and 1.1984 levels offer critical support.
To the upside, key intraday resistance above 1.2004 is found at 1.2031, 1.2069 and 1.2089. Once above 1.2089, the euro will likely target 1.2140 and 1.2260.
Elliott Wave Analysis: Bulls Taking Over On German DAX
Good day traders! Today we are goiong to take a look at German DAX and its 4h look.
German dax is trading bullish since end of August, when bigger correction was completed. We now see a five-wave bullish impulse in the making, with price currently trading in one of its sub-waves, wave 4). We know that wave 4) is a correction, which means it represent a pullback within an impulse and can go choppy, slow and overlapping. Ideally current wave 4) will search for a potential base near the 1.2450 region and later make a bounce higher, into final wave 5).
German DAX, 1H
Euro Rallies on Strong PMI Data Out of Germany, France and the Eurozone
Notes/Observations
- Euro rallies on strong PMI data out of Germany, France and the Eurozone
- European Indices trade mixed on continuing Geopolitical tensions in regards to North Korea
- ECB Chief Draghi notes that they are not there on inflation yet
Overnight
Asia:
- Geopolitical tensions rose again in the far east with North Korea responding to President Trumps executive order for additional US sanctions by considering the 'highest level of countermeasures'
- It was later reported that North Korea could conduct a Hydrogen-bomb test which has weighed on markets.
- S&P downgrades Hong Kong sovereign rating to AA+ from AAA (follows recent downgrade of China); Outlook revised to Stable from Negative; cites potential for spillover risks
- China's metals, including iron ore, have traded lower by over 2%, following reports that the Shanghai Metals Exchange raised trading fees
Europe:
- German, French and Eurozone prelim PMI readings handily beat estimates, French and German Composite PMI readings highest in over 6 years.
- UK PM May to give Speech in Florence, it is speculated that she will propose payments of €20B over a two year transitional period, in which she will emphasis it is a shared responsibility to make Brexit work 'Smoothly'.
Oil:
- OPEC panel to discuss export monitoring and and oil pact extension
Economic data
(DE) GERMANY SEPT PRELIMINARY MANUFACTURING PMI: 60.6 V 59.0E (34TH MONTH OF EXPANSION)
- Services PMI: 55.6 v 53.7e (50th month of expansion)
- Composite PMI: 57.8 v 55.7e
*(FR) FRANCE SEPT PRELIMINARY MANUFACTURING PMI: 56.0 V 55.5E (11TH MONTH OF EXPANSION)
- Services PMI: 57.1 v 54.8e (15th month of expansion)
- Composite PMI: 57.2 v 55.0e (15th month of expansion)
(EU) EURO ZONE SEPT PRELIMINARY MANUFACTURING PMI: 58.2 V 57.2E (50TH MONTH OF EXPANSION)
- Services PMI: 55.6 v 54.8e
- Composite PMI: 56.7 v 55.6e
- (FR) FRANCE Q2 FINAL GDP Q/Q: 0.5% V 0.5%E; Y/Y 1.8% V 1.7%E
- (NL) NETHERLANDS Q2 FINAL GDP Q/Q: 1.5% V 1.5%E; Y/Y: 3.3% V 3.3%E
Fixed Income Issuance:
- Non seen
SPEAKERS/FIXED INCOME/FX/COMMODITIES/ERRATUM
Equities
Indices [Stoxx50 +0.1% at 3,544, FTSE -0.1% at 7,256, DAX +0.1% at 12,613, CAC-40 +0.2% at 5,280, IBEX-35 -0.1% at 10,284, FTSE MIB +0.2% at 22,531, SMI +0.1% at 9,137, S&P 500 Futures -0.2%]
Market Focal Points/Key Themes: European stocks open lower but pair losses as session progressed; geopolitical concerns weighed on indices, supported safe haven flows; materials stocks impacted by drop in metal prices; L'Oreal heiress Bettencourt died, leading to moves in L'Oreal, Nestle and Sanofi; Israel closed for Jewish New year; attention turning to UK PM May's Brexit speech later in the day, and German elections over the weekend; upcoming earnings in the US session include Carmax
Equities
- Consumer discretionary: Adecco ADEN.CH -1.3% (strategy update)
- Energy: Lamprell LAM.UK -9.8% (outlook)
- Financials: Unicredit UCG.IT +0.9% (meeting to remove voting cap)
- Healthcare: Roche ROG.CH -0.2% (drug approvals)
- Industrials: Fincantieri FCT.IT +3.1% (press speculation STX deal near)
- Materials: Rio Tinto RIO.UK -0.8% (share buyback)
- Technology: Smiths Gorup SMIN.UK -5.2% (earnings)
Speakers
- (EU) ECB Chief Draghi: We aren't there on inflation yet; We see some local bubbles not systemtic
- (NO) Norway Central Bank (Norges) Gov Olsen: Flexible inflation target is more and more important
- (CH) SNB Gov Board member Moser: An end to Libor will challenge the private sector but will not hinder the SNB's ability to conduct monetary policy
- (VE) Venezuela Oil Min: Opec, Non-Opec evaluating all parameters when asked about export monitoring
- (EU) ECB Supervisory Board member Angeloni: Far from neutralising the transmission of risks between banks and public sector finances at the national level
Currencies
EUR/USD trades higher after stronger PMI readings out of Europe briefly topping 1.20. A clear break would see a move to 1.2027.
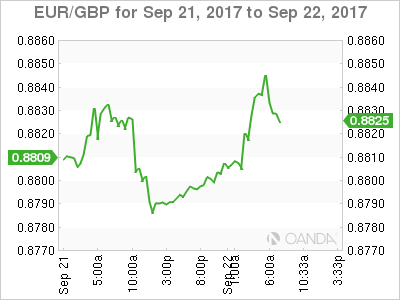
GBP/USD trades at the lower end of today's range after trading just below 1.36 earlier ahead of UK PM May's Brexit speech. Resistance seen just above $1.36.
Fixed Income
- Friday's liquidity report showed Thursday's excess liquidity rose to €1.734T from €1.729T, and use of the marginal lending facility fell to €116M from €137M.
- Corporate issuance saw $3.7B come to market via 3 deals led by 3M Co 3 part $2B offering, which brings weekly issuance to $16.7B.
- For the week ending Sep 20th Lipper US fund flows reported IG Funds net inflows of $2.86B bringing YTD inflows to $91.3B, High Yield funds reported net inflows of $865.8M bringing YTD outflows to $8.41B.
Looking Ahead
- 06:00 (UK) Sept CBI Industrial Trends Total Orders: 13e v 13 prior; Selling Prices: No est v 19 prior
- 06:00 (IE) Ireland Aug PPI M/M: No est v -1.1% prior; Y/Y: No est v -1.9% prior
- 07:00 (BR) Brazil Sept FGV Consumer Confidence: No est v 101.6 prior
- 07:30 (IN) India Weekly Forex Reserves
- 08:05 (UK) Baltic Dry Bulk Index
- 08:00 (PL) Poland Aug M3 Money Supply M/M: 0.3%e v 0.3% prior; Y/Y: 5.2%e v 5.0% prior
- 08:00 (CL) Chile Aug PPI M/M: No est v 1.7% prior
- 08:30 (CA) Canada Aug CPI M/M: 0.2%e v 0.0% prior; Y/Y: 1.5%e v 1.2% prior
- 08:30 (CA) Canada Aug CPI Core- Common YoY: No est v 1.4% prior; CPI Core- Trim YoY: No est v 1.3% prior; CPI Core- Median YoY: No est v 1.7% prior; Consumer Price Index: e v 130.4 prior
- 08:30 (CA) Canada Retail Sales M/M: 0.2%e v 0.1% prior; Retail Sales Ex Auto M/M: 0.4%e v 0.7% prior
- 09:00 (BE) Belgium Sept Business Confidence: -2.0e v -2.1 prior
- 09:00 (MX) Mexico Q2 Aggregate Supply and Demand Y/Y: 2.6%e v 4.0% prior
- 09:45 (US) Sept Preliminary Markit Manufacturing PMI: 53.0e v 56.0 prior; Composite PMI: No est v 55.3 prior
- 13:00 (US) Weekly Baker Hughes Rig Count data
- 15:00 (CO) Colombia July Economic Activity Index (Monthly GDP) Y/Y: No est v 1.4% prior
Daily Technical Analysis: GBP/USD De-Risking Prior To The German Election
Currently we see a de-risking prior to the German Election on Sunday. The GBP/USD is trapped withing the engulfing master candle (candle that traps subsequent candles within it's range) which acts as important support and resistance. The price is dropping possibly targeting the POC 1.3520-35 (38.2, D L4, ATR pivot) and possibly the POC2 1.3465-75 (D L5, W L3, 38.2, historical buyers). The price could bounce from POC zones but have in mind that POC2 has a stronger confluence that the POC1. The drop below 1.3460 could put the pair in another bearish retracement wave towards 1.3345 zone.
W H3 - Weekly Camarilla Pivot (Weekly Interim Resistance)
W H4 - Weekly Camarilla Pivot (Strong Weekly Resistance)
D H4 - Daily Camarilla Pivot (Very Strong Daily Resistance)
D L3 – Daily Camarilla Pivot (Daily Support)
D L4 – Daily H4 Camarilla (Very Strong Daily Support)
POC - Point Of Confluence (The zone where we expect price to react aka entry zone)
Technical Outlook: USDTRY – Reversal Pattern Is Forming On Daily Chart
The pair stays in red on Friday following double upside rejection at 3.5183 (Fibo 76.4% of 3.5585/3.3883 downleg / near falling 100SMA) on Wed /Thu and yesterday’s Doji with long upper shadow, signaling formation of reversal pattern.
Fresh weakness of the greenback on geopolitical tensions works in favor of such scenario, as slow stochastic is reversing from o/b territory and generating negative signal.
Dips were so far contained by 200SMA (3.4838) with close below needed to confirm and signal deeper correction of 3.3883/3.5194 upleg and expose its Fibo 38.2% retracement at 3.4693.
The pair may stay in extended consolidation before generating fresh direction signal while 200SMA support holds.
Res: 3.5065, 3.5194, 3.5394, 3.5488
Sup: 3.4838, 3.4693, 3.4590, 3.4384
Gold And Yen Gain On New Korea Angst
September 22: Five things the markets are talking about
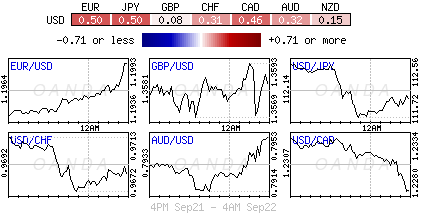
Global equities have retreated a tad overnight as the market purchased safe haven assets, including gold and yen (¥111.82), after N. Korea intensified their threats against the U.S. The EUR (€1.1957) remains better bid as German voters prepare to go to the polls this weekend.
N. Korea's overnight threats have managed to temporarily divert attention away from this week's monetary-policy decisions that have dominated the markets focus in the past three-sessions.
Expect investors to continue to eye speeches by Fed officials, as they may serve up some clues on what the central bank is thinking after bets for higher rates by year-end were raised following this week's Fed meeting.
In Europe, U.K PM Theresa May is set to give a speech on her Brexit strategy in Florence (9:00 am EDT), while Germany is preparing to go to the polls on Sunday, with Chancellor Merkel expected to secure a fourth-term, although she may not win an outright majority.
In Vienna, OPEC prepares to meet today and there is mixed signals on whether they will discuss deeper or longer cuts.
Down-under, New Zealand heads to the polls tomorrow.
1. Stocks mixed results
In Japan, the Nikkei slipped from its two-year high overnight after N. Korea threatened to test a hydrogen bomb in the Pacific Ocean, again heightening tension with the U.S.
Despite the rhetoric, Japanese equities have recorded their second consecutive week of gains, led by financial shares, which have found support from sovereign bond yields backing up after the Fed's policy statement midweek. The Nikkei slipped -0.3%, while the broader Topix Japan's fell -0.2%.
Down-under, Australia's S&P/ASX 200 Index added +0.5%, while S. Korea's Kospi index slid -0.7%.
In Hong Kong, stocks posted their biggest decline in a month, erasing this week's gains, as the market cashed out following S&P's downgrade of China's sovereign credit rating and N. Korea's nuclear threats. The Hang Seng index dropped -0.8%, while the Hong Kong China Enterprises Index lost -0.9%.
Note: S&P downgrades Hong Kong sovereign rating to AA+ from AAA – outlook is revised to stable from negative.
In China, domestic equities recovered most of their early losses as investors played down S&P's downgrade of China's sovereign rating and N. Korea's threat of another nuclear test. The blue-chip CSI300 index closed changed, while the Shanghai Composite Index shed -0.2%.
In Europe, regional indices trade mixed on continuing geopolitical tensions. Investors attention now turns to U.K PM May's Brexit speech later this morning, and German elections over the weekend.
U.S stocks are set to open in the ‘red' (-0.2%).
Indices: Stoxx50 +0.1% at 3,544, FTSE -0.1% at 7,256, DAX +0.1% at 12,613, CAC-40 +0.2% at 5,280, IBEX-35 -0.1% at 10,284, FTSE MIB +0.2% at 22,531, SMI +0.1% at 9,137, S&P 500 Futures -0.2%
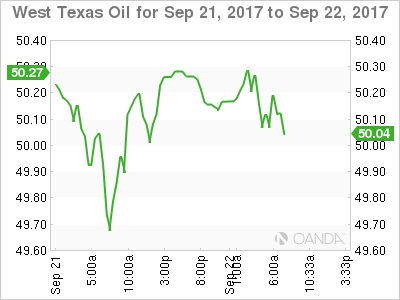
2. Oil prices higher as producers meet on output pact, gold rallies
Oil prices are a tad higher as the market waits to see whether OPEC and non-OPEC producers back an extension to output cuts beyond next March.
Brent crude futures are at +$56.51 a barrel, up +6c or +0.11%, while U.S West Texas Intermediate (WTI) crude futures are up +10c, or +0.2% at +$50.65 per barrel.
In January, OPEC and its allies agreed to reduce output by about -1.8m bpd until March 2018 in an attempt to empty inventories. The market is now anticipating an extension to that deal, possibly to the end of next year.
Note: Both contracts have risen more than +15% over the last three-months as global oil supply has tightened.
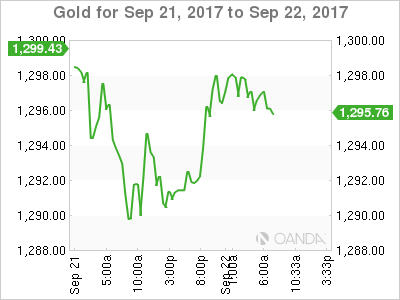
Ahead of the U.S open, gold has rebounded from its four-week low on sabre ratting rhetoric from N. Korea which prompted investors to seek safe-haven assets. Spot gold is up +0.4% at +$1,296.41 an ounce, after having hit a month low of +$1,287.61 Thursday.
Note: Bullion is down -1.7% for the week and heading for a second consecutive weekly decline.
3. Sovereign yield curves flatten
It appears that the Fed is determined to hike in December even if policy makers realize that inflation prints undershoot.
This week, Fed Chair Janet Yellen indicated that the drop in core price pressures this year – below the Fed's +2% target – a “mystery” while the board downgraded its long-run estimate for the fed-funds rate that keeps supply and demand balanced.
Since Wednesday, FI dealers have scrambled to price in a Dec. hike, pushing front-end U.S yields much higher (U.S 2's backed up to +1.43% for the first time since 2008). The net result is a flatter U.S yield curve, with the yield spread between 2-year Treasury's and U.S long-bond near the narrowest since June.
According to the CME, Fed fund future odds moved from pre-meet +50% to +73% possibility for a Dec. Fed rate hike.
Overnight, the yield on 10-year Treasuries fell -2 bps to +2.26%, the first retreat in more than a week, while in Germany the 10-year Bund yield declined less than -1 bps to +0.46%. In the U.K, the 10-year Gilt yield has advanced +1 bps to +1.375%, the highest in almost eight-months.
4. Where to for the EUR?
The EUR (€1.1957) remains better bid ahead of the U.S open, supported by stronger PMI data (see below) out of Germany, France and the Eurozone this morning.
Ahead of this weekend's German election, market consensus believes that if Chancellor Merkel's CDU party forms a coalition with the social democrats SPD party – the most likely scenario – then the EUR should trade little changed, focusing on regional data and ECB policy. However, if CDU allies itself with the liberal FDP and excludes the SPD, then the ‘single' currency could eventually come under pressure as politics will most likely shift towards a German domestic agenda, rather than Europe priority.
Note: Forming a German coalition could take weeks of negotiation.
5. Eurozone composite PMI higher than expected
Euro data this morning revealed that this months flash composite PMI for the region came in higher than expected, rising to 56.7 from 55.7 as against a market consensus forecast for a dip to 55.6.
The jump was led by manufacturing, which suggests that the EUR's (€1.1957) strength has not been much of a problem for growth.
Overall, today's report is another positive surprise from the eurozone economy, which many had been predicting slowing in H1 after a strong six-months.
The pickup is the latest positive surprise from an economy that has already outperformed most expectations this year.
Note: IHS Markit says the average PMI for Q3 points to acceleration in growth to +0.7%.
Technical Outlook: WTI OIL – Extended Consolidation Seen While $50.00 Support Holds
WTI oil price moves lower on Friday after Thursday's action ended in long-tailed Doji, signaling hesitation ahead of $51.00 barrier which was dented on Wednesday.
Today's easing was so far mild and suggesting the price may hold in extended consolidation while initial support at $50.00 (Thursday's low and strong downside rejection) holds.
Overall bullish structure was reinforced by formation of 10/200 SMA golden-cross, which underpins the action.
Sustained break above $50.83/$51.09 (cracked FE 100$ of the wave C from $46.99 trough/Wednesday's fresh four-month high) would signal bullish continuation and extension of the third wave (of five-wave sequence from $45.57) towards its FE 123.6% at $51.74.
Caution on break below $50.00 (as slow stochastic is reversing from o/b zone on daily chart and generating bearish signal) which may spark deeper pullback towards next pivotal support at $49.55 (200SMA).
Res: 50.83, 51.09, 51.55, 51.74
Sup: 50.44, 50.00, 49.74, 49.55
EUR/JPY Elliott Wave Analysis
EUR/JPY - 134.15
The single currency opened higher again this week and we were unable to enter long at recommended entry at 132.00 as euro rallied from 132.38 (this week’s low), adding credence to our bullish view that the major rise from 109.49 low (2016 low) is still in progress, indicated upside targets at 133.50-60 and 134.00-10 had been met, upside bias remains for further gain to 134.59 (previous chart resistance), then 135.00-10 but overbought condition should prevent sharp move beyond 136.00-10 and reckon 136.95-00 would hold, price should falter well below 138.45-50 (1.618 times extension of 109.49-124.10 measuring from 114.85), risk has increased for a retreat to take place later.
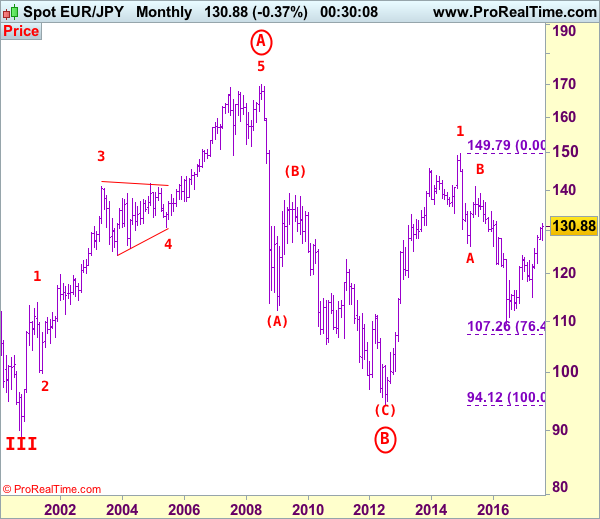
The daily chart is labeled as attached, early selloff from 169.97 (July 2008) to 112.08 is wave (A) of B instead of end of entire wave B and then the rebound from there to 139.26 is wave (B), hence, wave (C) has possibly ended at 94.12 with a diagonal triangle as labeled in the daily chart, hence upside bias is seen for further gain. Recent rally above indicated retracement level at 116.69 (50% Fibonacci retracement of the intermediate fall from 139.26-94.12) adds credence to this view and signal major reversal has commenced but first leg of this wave C has possibly ended at 149.79, hence wave 2 has commenced with wave A ended at 126.09, followed by wave B at 141.06, wave C commenced and could have ended at 109.49, indicated upside targets at 126.00 and 130.00 had been met and further gain to 135.00 would follow.
On the downside, whilst initial pullback to 133.50-60 is likely, reckon downside would be limited to 132.90-00 and bring another upmove later. Below this week’s low at 132.38 would bring test of previous resistance at 131.71 (now support) but a daily close below there is needed to signal a temporary top is possibly formed, bring retracement of recent rise to 131.00 and possibly test of support at 130.62 but downside should be limited to 130.00 and strong support at 129.37 should remain intact, bring another upmove later.
Recommendation: Buy at 132.70 for 135.00 with stop below 131.70.
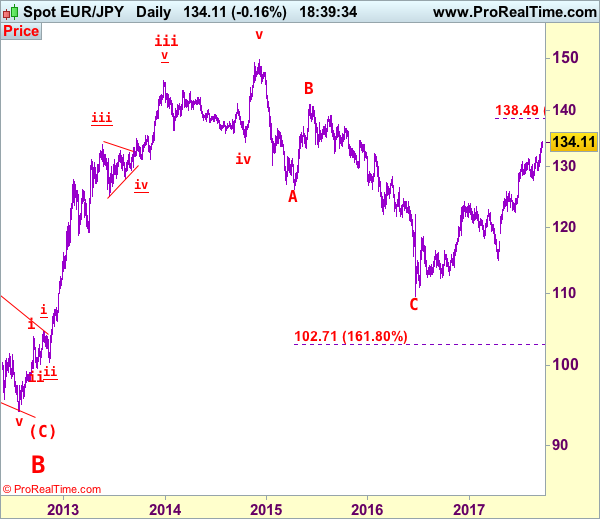
To re-cap the corrective upmove from the record low of 88.93 (18 Oct 2000), the wave A from there is subdivided as: 1:88.93-113.72, 2:99.88 (1 Jun 2001), 3:140.91 (30 May 2003), 4:124.17 (10 Nov 2003) and 5 ended at record high of 169.97 (21 Jul 2008). The brief but sharp selloff to 112.08 is viewed as a-b-c x a-b-c wave (A) of B. The subsequent rebound to 139.26 is (B) of B and (C) of (B) has possibly ended at 94.12 and in any case price should stay well above previous chart support at 88.93, bring rally in larger degree wave C towards 150.00.
USD/CHF Elliott Wave Analysis
USD/CHF – 0.9696
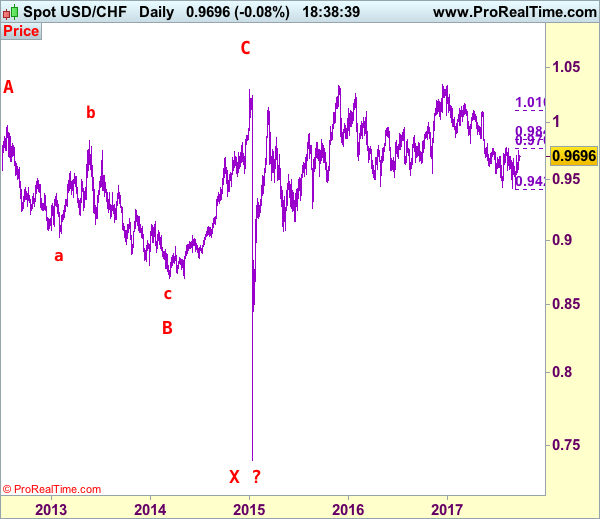
The greenback only retreated to 0.9565 (we recommended in our previous update to buy at 0.9550 and missed the entry) before staging the anticipated rally, this move adds credence to our view that low has been formed at 0.9421, hence consolidation with upside bias remains for test of previous resistance at 0.9774, a sustained breach above this level would confirm and bring retracement of early decline to resistance at 0.9808, then test of previous support at 0.9859, having said that, near term overbought condition should limit upside to 0.9900 and price should falter well below psychological resistance at 1.0000, bring another decline later.
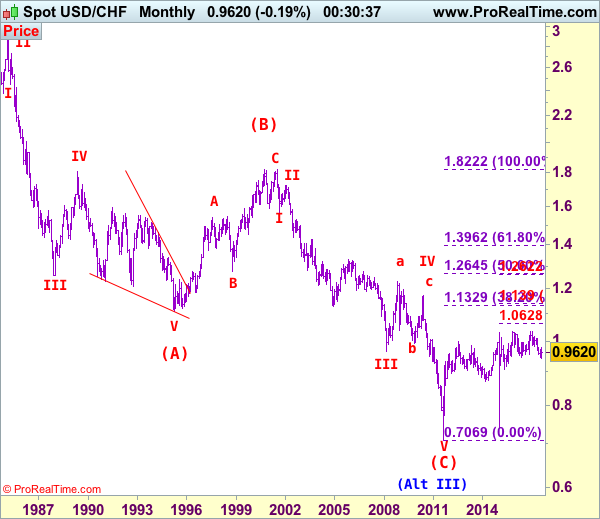
Our preferred count on the daily chart is that early selloff to 0.9630 is an end of the larger degree wave III and major correction is unfolding from there with a leg ended at 1.2298 (Nov 2008 with (a): 1.0625, (b):1.0011 and (c):1.2298), wave b ended at 0.9910 with (a): 1.0370, (b): 1.1967, (c): 0.9910. The rise from there to 1.1730 is the wave c which also marked the end of wave IV and wave V has possibly ended at 0.7068.
On the downside, whilst initial pullback to 0.9650 is likely, reckon downside would be limited to said support at 0.9565 and bring another rise later. Below 0.9525-30 would risk weakness to 0.9490-00 but still reckon downside would be limited to 0.9455-60 and said support at 0.9421 should remain intact, bring another rebound later. A drop below said support at 0.9421 would extend recent decline from 1.0344 top (formed back in late 2016) to 0.9350 and possibly 0.9300, however, loss of downward momentum should prevent sharp fall below 0.9250-60 and 0.9200-10 should hold.
Recommendation: Buy at 0.9575 for 0.9775 with stop below 0.9475.
Dollar's long-term downtrend started from 2.9343 (Feb 1995) and it was unfolding as a (A)-(B)-(C) with (A): 1.1100, (B): 1.8310 (26 Oct 2000), then followed by another impulsive wave (C) with wave III ended at 0.9630 (Mar 2008). Under this count, correction in wave IV has possibly ended at 1.1730 and wave V already broke below support at 0.9630 and met indicated downside target at 0.7500 and 0.7400. The reversal from 0.7068 suggests the wave V has possibly ended and the breach of resistance at 0.9595 add credence to this view and indicated upside target at 1.0000 had been met, however, the sharp retreat from 1.0296 to 0.7401 suggests choppy trading would be seen but price should stay above said record low at 0.7068.
EURJPY – Biased To Upside Medium Term Despite Hesitation
EURJPY - The pair continues to hold on to its broader medium term uptrend though facing price hesitation. On the downside, support comes in at the 133.50 level where a break if seen will aim at the 133.00 level. A cut through here will turn focus to the 132.50 level and possibly lower towards the 132.00 level. On the upside, resistance resides at the 134.50 level. Further out, we envisage a possible move towards the 135.00 level. Further out, resistance resides at the 135.50 level with a turn above here aiming at the 136.00 level. On the whole, EURJPY faces further bull pressure in the medium term.