Sample Category Title
Trade Idea: GBP/USD – Sell at 1.3620
GBP/USD – 1.3547
Original strategy :
Sell at 1.3600, Target:1.3400, Stop: 1.3660
Position: -
Target: -
Stop: -
New strategy :
Sell at 1.3620, Target:1.3420, Stop: 1.3680
Position: -
Target: -
Stop:-
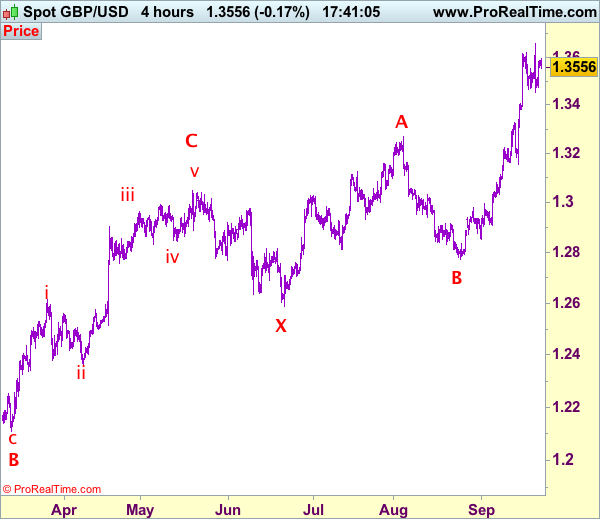
Although cable found support at 1.3452 and has rebounded, if our view that top has possibly been formed at 1.3658 earlier this week is correct, upside would be limited to 1.3615-20 and bring retreat later, below 1.3500 would bring test of said support at 1.3452, break there would add credence to this view, bring weakness to 1.3380-85, however, break there would bring retracement of recent rally to 1.3350, then towards 1.3300-10 which is likely to hold form here.
In view of this, we are looking to turn short on further recovery as 1.3615-20 should limit upside. Above said resistance at 1.3658 (this week’s post-Fed high) would signal recent upmove is still in progress and may extend headway to 1.3700. Our preferred count is that (pls see the attached chart) the wave IV is unfolding as a complex double three (ABC-X-ABC) correction with 2nd wave B ended at 1.2774, hence 2nd wave C is unfolding and may extend further gain to 1.3650, then 1.3700, however, overbought condition should limit upside to 1.3770-75 and reckon 1.3800-10 would hold from here, bring retreat later.
Our preferred count on the daily chart is that cable's rebound from 1.3500 (wave (A) trough) is unfolding as a wave (B) with A ended at 1.7043, followed by triangle wave B and wave C as well as wave (B) has ended at 1.7192, the subsequent selloff is the larger degree wave (C) which is still unfolding with minor wave (III) of larger degree wave 3 ended at 1.1986, hence wave (IV) correction is in progress which could either be a triangle wave (IV) of a complex formation but upside should be limited to 1.3500 and price should falter well below 1.4000, bring another decline in wave (V) of 3 for weakness to 1.1500, then 1.1200.
Trump Lashes Out More Sanctions, North Korea May React
Trump Lashed More Sanctions On Korea
Dust Settled And US Indices Reacted To Fed’s Decision
German Election Would Be The Focus For The Weekend
Trump Lashed More Sanctions On Korea
The Asian markets are focused on the geopolitical tensions because the ongoing war of words between Trump and Kim Jong-un could explode.
Donald Trump announced some new tighter and tougher sanctions on North Korea. The sanctions will involve individuals, companies and banks which have anything to do with North Korea in terms of business. He has also asked Theresa May to join him to add more pressure on North Korea. He has called Kim Jong-un a 'rocket man' and the war of words between the two leaders has no sign of cooling off. Jim Jong has called President Trump 'mentally deranged'.
After these new sanctions, North Korea is not going to sit quiet. We do expect a reaction and it may be another nasty surprise for President Trump. If there is any kind of reaction from North Korea, the gold price could easily jump above the 1300 mark.
Dust Settled And US Indices Reacted To Fed’s Decision
The bears had it their way finally as the US markets closed in a negative territory for the first time in the last 10 days. The dust from the Fed meeting has finally settled and traders are showing some nervousness ahead of the potential upcoming rate hike. The US Jobless claims data came much better than the forecast and this reinforced the Fed outlook about the labour market. The Philadelphia Fed’s business outlook was also strong and came ahead of the expectations. If the Fed continues its rate hike glide path, repositioning in some portfolio rearrangement would be inevitable. The US financial sector is one of the most loved sectors by investors because higher rates would benefit the banking stocks.
German Election Would Be The Focus For The Weekend
Going into the weekend, a lot of attention will remain on the main event which will be unfolding on Sunday - the German elections. The German Chancellor is poised to win this election for the fourth time but the focus would be on whether she can secure the majority. Investors will be looking at her and they will be highly interested in the new form of collation which she is going to put together.
Sterling Traders To Focus On May
Another important event on Friday is the speech by the UK prime minister. The sterling has been roaring and literally paying no attention to how the Brexit negotiations have been choking off. For traders it is all about the BOE and when they will be increasing the interest rate. It is highly likely that the BOE may actually increase the interest rate in November but that doesn’t mean that the BOE will be on a rate hike glide path. The Brexit negations and the final outcome are both very significant. In her speech, May is expected to outline her new vision of Brexit. There are certainly chances that her new vision creates more political turmoil in the UK’s political system because the foreign secretary of the country has already made it clear that it is his way or the high way. So we would expect some major mover for the sterling
Trade Idea: GBP/JPY – Stand aside
GBP/JPY - 151.80
New strategy :
Stand aside
Position: -
Target: -
Stop:-
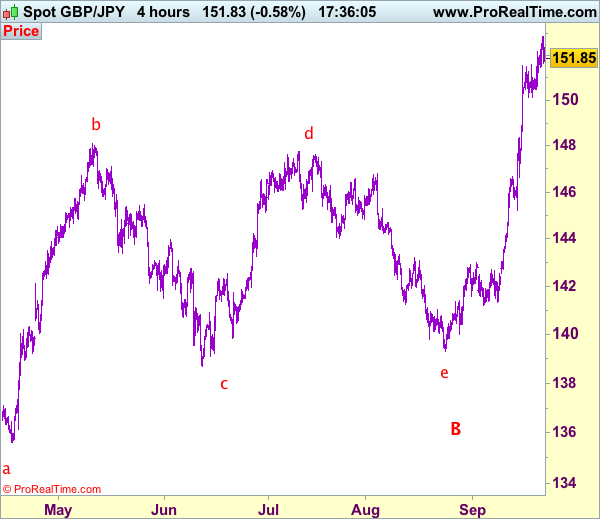
Despite rising to 152.85 yesterday, the subsequent retreat suggests consolidation below this level would be seen and test of support at 150.15 is likely, however, a firm break below there is needed to suggest a temporary top is possibly formed, bring further fall to 149.70-80, then towards 148.90-00, only a drop below there would add credence to this view, bring retracement of recent rise to 148.50 and then 148.00 later.
In view of this, would be prudent to stand aside in the meantime. Above 152.35-40 would bring another test of said resistance at 152.85 but break there is needed to signal upmove has once again resumed and extend headway to 153.00-10 and possibly towards 153.50-60, however, 154.00 should hold, risk from there has increased for a retreat to take place later.
Our preferred count is that larger degree wave V with circle is unfolding from 251.12 with wave (I) 219.34, (II): 241.38 and wave (III) is subdivided into 1: 192.60, 2: 215.89 (23 Jul 2008) and wave 3 ended at 118.87 earlier in 2009. The correction from there to 162.60 is wave 4 which itself is a double three and is labeled as first a-b-c ended at 151.53, followed by wave x at 139.03, 2nd a ended at 162.60, 2nd b at 146.75 and 2nd c leg of wave 4 ended at 163.00. Therefore, the decline from 163.00 to 116.85 is now treated as wave 5 which also marked the end of larger degree wave (III), hence wave (IV) major correction has commenced for retracement of the wave (III) from 241.38 and upside target at 183.95-00 (50% Fibonacci retracement of the wave (II) from 241.38) had been met, a drop below 160.00 would suggest wave (IV) has ended at 195.85, bring decline in wave (V) for initial weakness to 130 (already met) and 120.
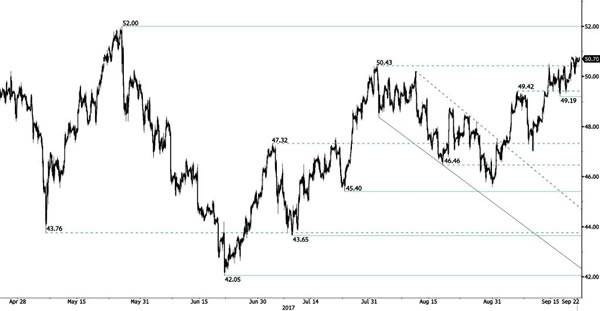
CRUDE OIL Buying Demand
Crude oil is edging higher above the $50 level. Key support is given at 45.40 (17/08/2017 high). Strong resistance found at 50.43 (31/07/2017) has been broken. Expected to show another leg higher.
In the long-term, crude oil has recovered after its sharp decline last year. However, we consider that further weakness are very likely. Strong support lies at 35.24 (05/04/2016) while resistance can now be found at 55.24 (03/01/2017 high).
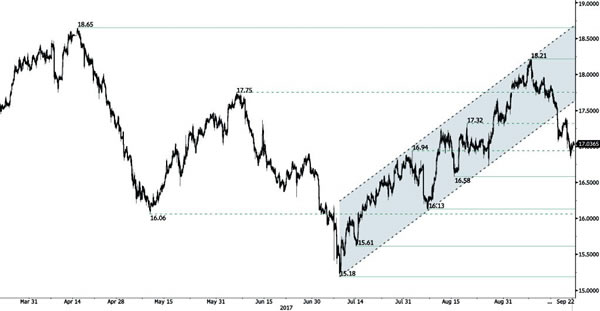
SILVER Continued Decline
Silver has reversed and has broken uptrend channel by breaking support implied by its lower bound. Strong resistance is given at 18.65 (17/04/2017 high) while support can be found at 16.58 (15/08/2017 high). Expected to show further bearish move.
In the long-term, the trend is rater negative. Further downsides are very likely. Resistance is located at 25.11 (28/08/2013 high). Strong support can be found at 11.75 (20/04/2009).
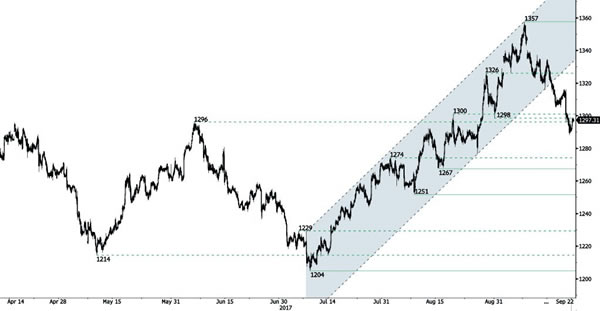
GOLD Downside Momentum Accelerates
Gold is consolidating below 1300. Hourly support is now given at 1288 (21/08/2017 low). Hourly resistance is located at 1357 (08/09/2016). Stronger support lies at 1204 (10/07/2017 high). Expected to show further bearish move.
In the long-term, the technical structure suggests that there is a growing upside momentum. A break of 1392 (17/03/2014) is necessary ton confirm it, A major support can be found at 1045 (05/02/2010 low)
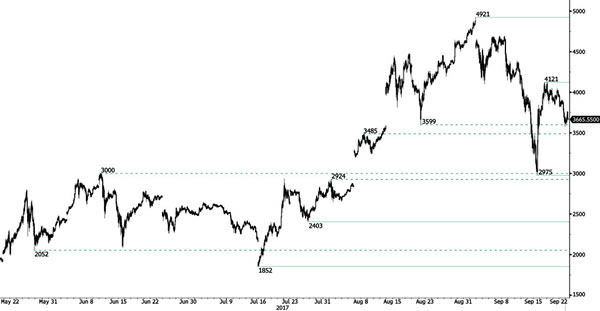
BITCOIN Downside Pressures Are Still There
Bitcoin has taken a dive after strong interest over the summer. The digital currency has set up a new support at 2975 (22/08/2017 low). Hourly resistance is given at 4121 (18/09/2017 low). Key resistance can be located at 4921 (01/09/2017 high). The road is wide open for further shortterm decline.
In the long-term, the digital currency has had an exponential growth. There are decent likelihood that the asset will reach $10'000.
EUR/CHF Strong Bullish Pressures
EUR/CHF's buying pressures are going up and the pair has broken resistance area between 1.1356 and 1.1472. The pair has also broken resistance at 1.1538 (04/08/2017 high). Expected to show continued bullish pressures.
In the longer term, the technical structure has reversed. Strong resistance is given at 1.20 (level before the unpeg). Yet, the ECB's QE programme is likely to cause persistent selling pressures on the euro, which should weigh on EUR/CHF. Supports can be found at 1.0184 (28/01/2015 low) and 1.0082 (27/01/2015 low).

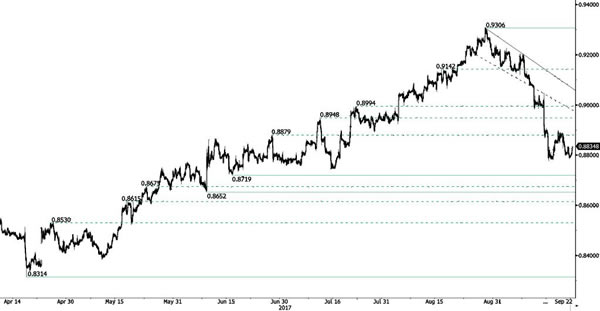
EUR/GBP Consolidating Above 0.88
EUR/GBP is weakening. The pair is having strong selling pressures.. However, as long as prices remain below the resistance at 0.9176 (declining trendline), the short-term technical structure is biased to the downside. Hourly support is given at 0.8719 (16/06/2017). Strong resistance lies at 0.9306 (29/07/2017 high).
In the long-term, the pair has largely recovered from recent lows in 2015. The technical structure suggests a growing upside momentum. The pair is trading above from its 200 DMA. Strong resistance can be found at 0.9500 (psychological level).
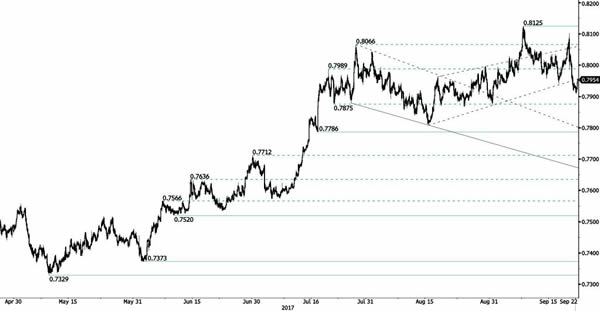
AUD/USD Breaking Lower Bound Of Uptrend Channel.
AUD/USD has broken support implied by the lower bound of the uptrend channel. Hourly resistance is given at 0.8125 (08/09/2017 high). Hourly support is given at a distance 0.7786 (18/07/2017 low). Expected to further weaken.
In the long-term, the trend is largely negative since 2011. Key supports stands at 0.6009 (31/10/2008 low) . A break of the key resistance at 0.8295 (15/01/2015 high) is needed to invalidate our long-term bearish view.