Sample Category Title
USDJPY Surrenders FOMC Gains
The USDJPY pair has surrendered much of Wednesday's strong gains, after North Korea threatened to detonate its most powerful Hydrogen bomb yet, into the Pacific Ocean. Investors have moved back into the safety of Japanese Yen, and away from riskier asset classes.
During the Asian session, the pair has fallen from the 112.55 level, finding critical intraday support from its monthly pivot point, located at 111.65.
Traders should watch the 110.67 level, which denotes the pairs inverse head and shoulder pattern neckline. A series of higher time frame price closes beneath this level, should be seen as strongly bearish.
Key USDJPY technical support below the 111.65 level is found at 111.57, 111.49 and 111.20. Below 111.20, price should further decline to 110.87 and 110.68.
To the upside, intraday USDJPY resistance is found at 111.90 and pairs the 50-hour moving average, at 112.07. Further resistance above 112.07 is found at the daily pivot point, at 112.42 and the current weekly price-high, at 112.71
.
Euro Bullish Heading Into Elections
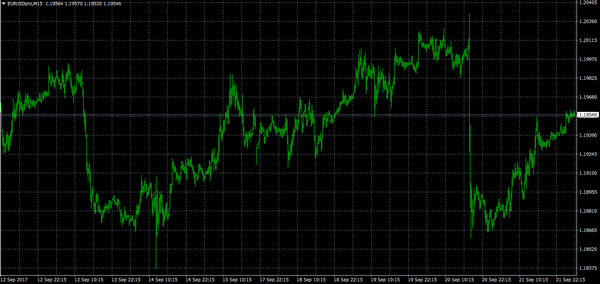
The EURUSD pair is turning increasingly bullish ahead of the weekend's Federal election in Germany. Yesterday, the euro regained bullish momentum after Wednesday's steep decline, reversing sharply from its monthly pivot point, at 1.1884, hitting 1.1964.
In early Asian trading, the pair found dip buying demand as it moved back towards its weekly pivot point, at 1.1938, with price-action now testing the key 1.1957 resistance level.
The euro faces a major risk-event over the weekend, if the German election result is closer than most analysts predict. A larger than expected majority win by Angel Merkel should be euro supportive on Monday, whilst a closer than expected result should be seen as euro negative.
Key intraday resistance for the EURUSD above the 1.1957 level is seen at 1.1980 and 1.1999. Further resistance is located at 1.2031, 1.2038 and 1.2069.

To the downside, the weekly pivot point is found at 1.1938, whilst the daily pivot point is found at 1.1928.
Below the daily pivot point, yesterday's break-out resistance area becomes support, at 1.1915, with the 1.1884 level once again acts as critical support.
.
Data Deluge Expected For Friday
The financial calendar is in full swing on Friday, with a deluge of economic data and monetary policy developments scheduled to come our way.
Action begins at 6:45 GMT when France releases revised second-quarter GDP. The French economy is projected to grow 0.5% between April and June.
PMI data courtesy of IHS Markit will dominate the headlines between 07:00 GMT and 08:00 GMT. Manufacturing, services and composite indicators will be released for Germany, France and the 19-member Eurozone.
Germany’s composite PMI is projected to edge up slightly to 55.9 in September, from 55.8 the previous month. The Eurozone composite indicator likely edged down slightly to 55.5 from 55.7.
The North American session also features a spate of economic releases, beginning at 12:30 GMT with Canadian retail sales and consumer inflation. Canada emerged as the G7’s fastest-growing economy in the first half. Analysts expect retail sales to rise again in July. The consumer price index (CPI) is also projected to strengthen for the month of August.
Markit will also release US services, manufacturing composite PMI at 13:45 GMT. Current projections show a slight improvement in manufacturing conditions and a slight drop in the services gauge. Combined, these results are likely to see little change for the composite indicator.
On the monetary policy front, European Central Bank (ECB) President Mario Draghi is expected to deliver a speech on Friday. British Prime Minister Theresa May is also slated to speak.
EUR/USD
The euro recovered lost ground on Friday after a hawkish Federal Reserve drove the US dollar to weekly highs against a basket of its peers. The EUR/USD exchange rate climbed back toward the mid-1.19 region on Thursday, and was last up 0.1% at 1.1955. The pair continues to eye the 1.20 region in the short term. However, gains north of that level could prove difficult now that investors are pricing in a good probability of a December rate hike by the Federal Reserve.
GBP/USD
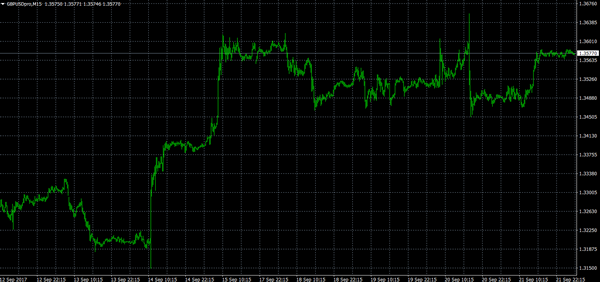
After a volatile mid-week session, cable rebounded Thursday as the greenback lost some of its post-Fed zeal. The GBP/USD exchange rate was last seen trading at 1.3578, a region it has become familiar with over the past week. Cable has strong support at the key 1.3500 psychological mark. On the opposite side of the leger, 1.3600 is the immediate resistance test, followed by 1.3660
GOLD
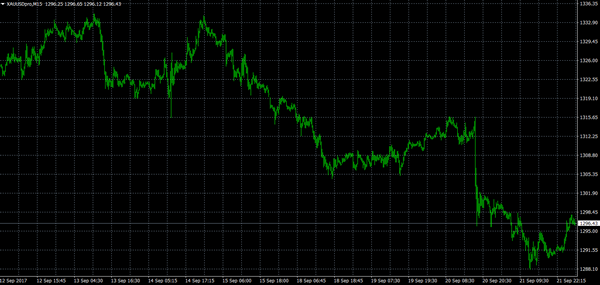
A weaker dollar helped stem gold’s multiweek retreat on Thursday, as bullion climbed back toward $1,300.00 a troy ounce. Prices are down more than $50 over the past two weeks. The spot exchange rate (XAU/USD) was last seen trading at $1,297.00 a troy ounce on the Comex division of the New York Mercantile Exchange. That represents a gain of 0.4%.
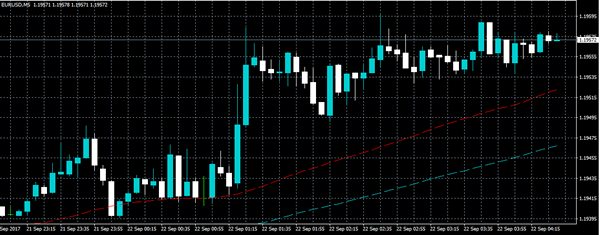
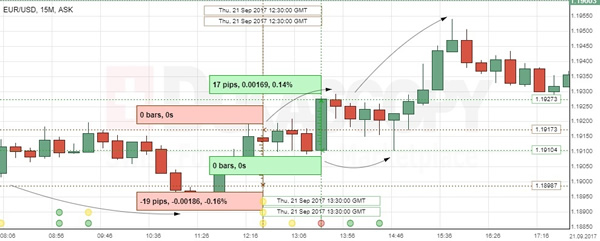
EUR/USD: US Jobless Claims, ECB Draghi Speech
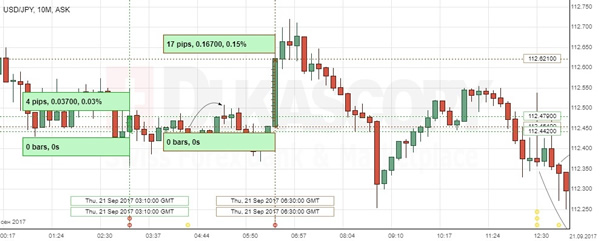
The EUR/USD fluctuated between the 1.1898 and 1.1917 marks to decrease slightly, following the US Jobless Claims report. The fall was easily offset by the bullish market reaction on the Mr. Draghi speech, where the Euro added 17 base points or 0.14% and continued gradual increase to the intraday high of 1.1947.
The US Labour Department stated that the number of Americans filing for unemployment benefits dropped unexpectedly to 259K last week, suggesting that the hurricanes-related increase continued to reverse. The next move in the pair was set by the ECB President Mario Draghi comments on the banking sector risks, while avoiding to provide any hints on the Bank's monetary policy changes decision.
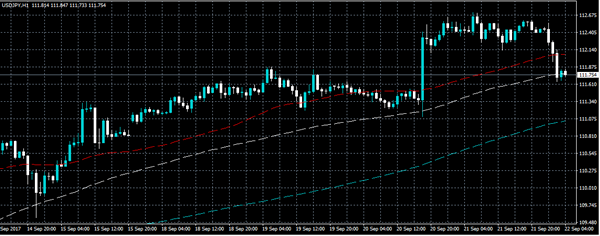
USD/JPY: BoJ Interest Rate Decision
The USD/JPY exchange rate was little changed after the Bank of Japan's interest rate decision announcement. However, the further reaction on the Bank's press conference put the pair to a two-month high of 112.70, where the US Dollar strengthened against the Yen by more than 0.15%. Both events managed to keep USD/JPY above the 112.0 level, though the pair returned to the 111.80 area in the early Friday trading session.
The Bank of Japan left the key interest rate at negative 0.1%, as expected, keeping its accommodative monetary policy on the table in an attempt to achieve 2% inflation target without additional stimulus. Meanwhile, the Greenback's position was determined by speculation over bets that the Fed would raise rates in December.
Foreign Exchange Market Commentary: EUR/USD, USD/JPY, GBP/USD, GOLD, WTI CRUDE, DJIA, FTSE100, DAX
EUR/USD
The American dollar spent Thursday giving back part of the Fed's triggered gains, ending the day with uneven results, but down across the board, anyway. The common currency gained in spite of comments from ECB's Executive Board member Peter Praet, who said that the time has no yet come for the ECB to start winding down its massive monetary stimulus. ECB's head, Mario Draghi, was also on the wires, but said little over current monetary policy, beyond saying that monetary policy is not the right instrument to address financial imbalances in the euro zone. Backing the EUR was consumer confidence that improved from -1.5 to -1.2 in September, the highest level in about 16 years.
In the US, macroeconomic figures were mixed, as in the week ending September 16, initial jobless claims reached 259K, a decrease from the previous week's revised level of 282K. The 4-week moving average, however, was 268,750, the highest level for this average in over a year. Additionally, manufacturing firms reported an improvement in regional manufacturing conditions in September, according to the Philadelphia Fed monthly survey, with the index up for September to 23.8 from previous 18.9, also beating market's expectations of 17.9, but July's Housing Price Index came in below expected up on the month by 0.2%.
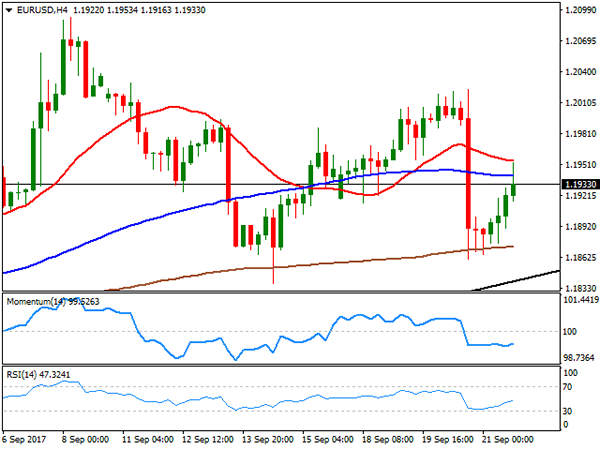
The EUR/USD pair peaked at 1.1953 to end the day in the 1.1930 region, pretty much flat for the week, midway between 1.18 and 1.21, the range established late August. Potential gains are being limited by speculation that the ECB will continue with some sort of verbal intervention on spikes through the 1.2000 level, but a dollar's steeper recovery is on doubt, weighed by political jitters and the lack of progress in the growth agenda. Technical readings in the 4 hours chart indicate that the upward potential is limited, as technical indicators have posted modest recoveries within negative territory, but remain in the red and with little directional strength, whilst the price is incapable to surpass its 20 and 100 SMAs, with the shortest providing an immediate resistance at 1.1965.
Support levels: 1.1900 1.1860 1.1820
Resistance levels: 1.1965 1.2000 1.2030
USD/JPY
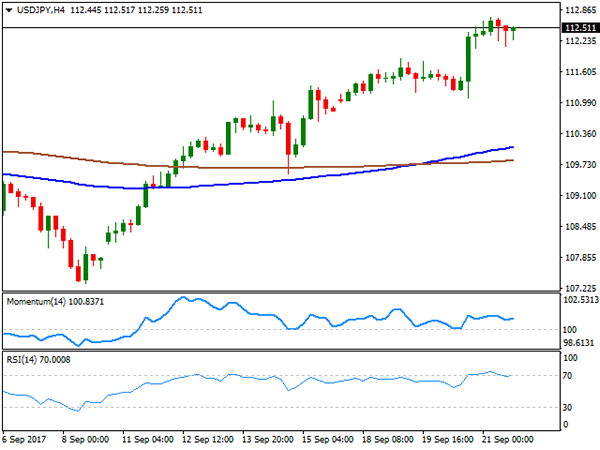
The USD/JPY pair advanced for fifth consecutive day this Thursday, reaching a daily high at 112.71 during early trading hours, and after the BOJ stuck to its ultra-loose monetary policy. Following Fed's hawkish announce, including a third rate hike for this year and details on how the US Central Bank will unwind its balance sheet, the on-hold stance of Japanese policymakers highlighted the imbalances between both central banks, supportive of the pair's advance. The pair fell down to 112.13 early US session, but recovered to close near the mentioned high, following the behavior of US Treasury yields, which eased intraday, but managed to regain their post-Fed levels ahead of Wall Street's close. The pair remains biased higher according to technical readings, as in the 4 hours chart, the price continues developing well above its 100 and 200 SMAs, whilst the Momentum indicator is aiming to regain its bullish strength as the RSI indicator remains within overbought territory. The immediate resistance comes at 112.86, July 17th daily high, and an advance beyond it will open doors for a recovery up to the 114.40 price zone, where the pair topped out in May and July.
Support levels: 112.10 111.75 111.40
Resistance levels: 112.85 113.30 113.70
GBP/USD
Having spent most of the first half of the day confined to a tight range around the 1.3500 level, the GBP/USD pair broke higher in the US afternoon, ending the day some 20 pips below the 1.3600 level, following news indicating that UK's PM May is willing to pay the EU up to €20b, but only if the UK has granted access to the single market after the Brexit, alongside with some form of custom union. PM May is scheduled to speak in Florence, this Friday to finally present her Brexit strategy. So far, the UK and the EU have made little progress on Brexit negotiations, and May´s offer could be decisive when it comes to move forward. The pair gained a modest upward potential with the late intraday advance, but would need to break beyond the 1.3600 figure to be able to advance at a firmer pace. In the 4 hours chart, the price has recovered above a now flat 20 SMA, whilst technical indicators entered positive territory, maintaining their upward slopes, although with limited momentum, favoring the upside anyway.
Support levels: 1.3535 1.3490 1.3450
Resistance levels: 1.3615 1.3650 1.3690

GOLD
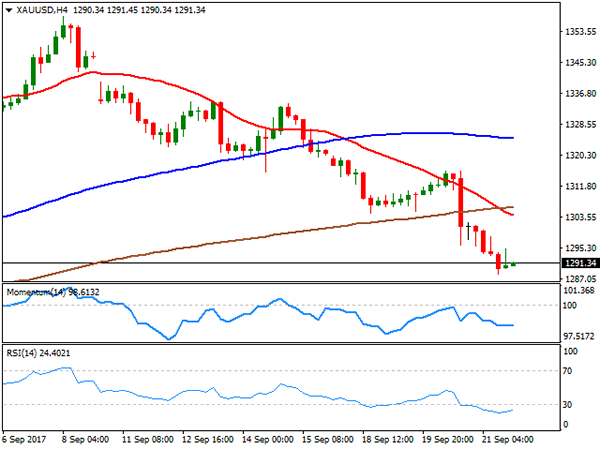
Spot gold posted its lowest settlement since August 25th, ending the day at $1,291.30 a troy ounce, weighed by US Federal Reserve latest announcement. The central bank revived hopes for a third rate hike this year, with odds of such move now at 72% from 51% before the event. Risk-related headlines coming from US President Donald Trump weren't enough to boost demand for the metal, as he said that "North Korea's nuclear weapons and missile development is a grave threat to peace and security in our world and it is unacceptable that others financially support this criminal, rogue regime," when signing an executive order to further isolate the country. In the daily chart the bearish momentum remains strong, as technical indicators keep heading sharply lower within bearish territory, whilst the price moved further below its 20 SMA, which gains bearish traction far above the current level. Shorter term, and according to the 4 hours chart, the risk is also steady towards the downside, with the 20 SMA crossing below the 200 SMA, both around 1,305.00, and technical indicators holding flat well into bearish territory, with no signs of changing course.
Support levels: 1,288.10 1,280.45 1,273.45
Resistance levels: 1,296.00 1,304.00 1,311.60
WTI CRUDE OIL
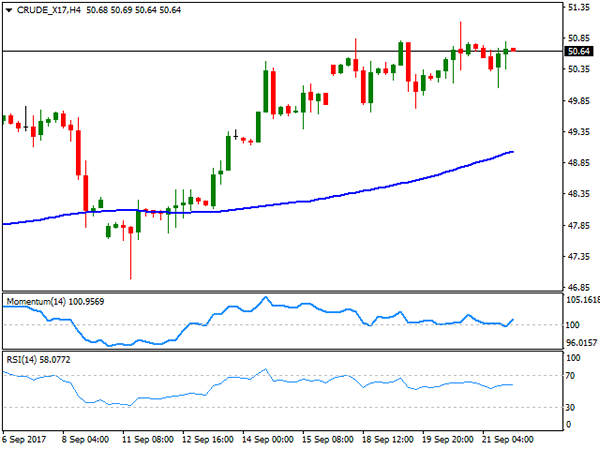
West Texas Intermediate crude futures closed Thursday little changed at $50.64 a barrel, reverting an early slide down to 50.06. The OPEC and non-OPEC producers who agreed an output cut late last year, are scheduled to meet this Friday in Vienna to discuss the market impact of their agreement, and the progress achieved so far. Any mention on an extension of their deal beyond its current end, at March 2018, may boost the black gold. In the meantime, the daily chart shows that the price holds near its recent highs, well above still directionless 100 and 200 SMAs, and that technical indicators keep turning lower, but well into positive territory, rather reflecting the ongoing consolidation than suggesting an upcoming decline. In the 4 hours chart and for the short term the commodity retains a positive stance as the price holds within a consolidative range well above a bullish 100 SMA, whilst technical indicators have managed to regain the upside after approaching their mid-lines, still poised to test the 52.00 critical level.
Support levels: 50.20 49.60 49.10
Resistance levels: 51.10 51.55 52.00
DJIA
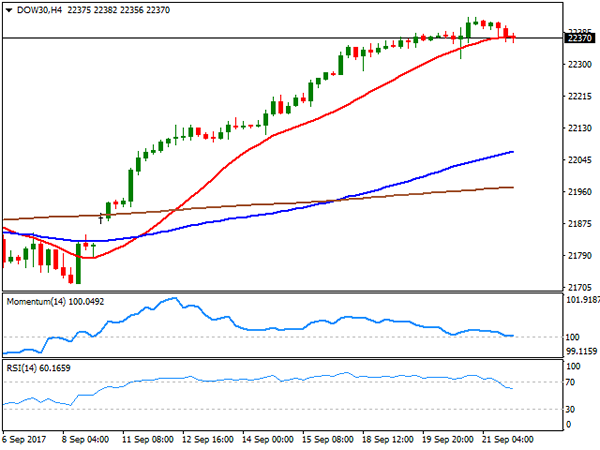
The Dow Jones Industrial Average put an end to its bullish run, closing the day in the red after nine consecutive advances. The index lost 53 points, or 0.24%, to end at 22,359.23. The S&P shed 7 points and closed at 2,500.60, while the Nasdaq Composite also closed in the red, at 6,422.69 after losing 33 points. Banks remained on the winning side, with Goldman Sachs up 0.81% and JP Morgan gaining 0.53%, both among the best performers. Tech shares led the way lower, with Apple down 1.72%. The daily chart shows that the index held anyway above Wednesday's opening, and far above bullish moving averages, whist the upward Momentum remains strong. The RSI indicator in the mentioned chart has barely retraced, still within overbought readings, all of which limits chances of a steeper decline. Shorter term, and according to the 4 hours chart, the index presents a neutral stance, stuck around a bullish 20 SMA, and with technical indicators have pared their declines before turning flat within positive territory.
Support levels: 22,356 22,321 22,288
Resistance levels: 22,424 22,475 22,500
FTSE100
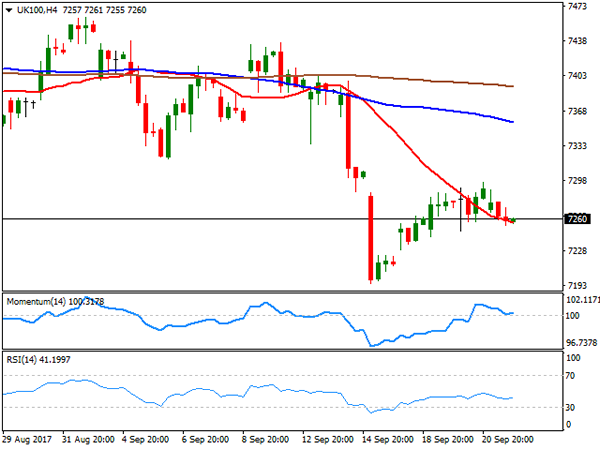
The FTSE 100 lost 8 points or 0.11% to end the day at 7,263.90, with little to motivate investors and ahead of PM May's Brexit plan announcement this Friday. Most members were down, with Kingfisher being the worst performer, shedding 4.09%, followed by J Sainsbury that lost 4.05%. Only 30 members closed higher, with Johnson Matthey adding 14.6%, after the company revealed a plan for a £200m investment in battery technology as it aims to become a key player in the coming electric car revolution. The index, however, fell in after-hours trading, as the Pound broke higher against its major rivals, heading into the Asian opening some 50 points below the mentioned close. Daily basis, the technical bias remains towards the downside, as indicators resumed their declines within bearish territory and with the Momentum at fresh multi-month lows, whilst the index keeps developing below a bearish 20 DMA. In the 4 hours chart, the index settled around a sharply bearish 20 SMA, whilst the RSI indicator heads lower around 39, also supporting a bearish extension for this Friday.
Support levels: 7,236 7,195 7,150
Resistance levels: 7,271 7,317 7,344
DAX
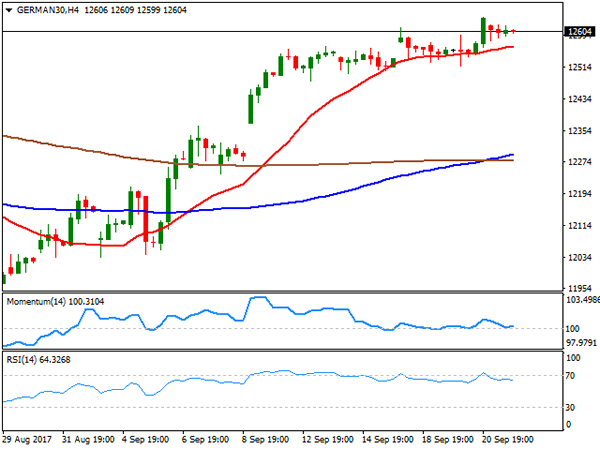
The German DAX closed at 12,600.03, up 30 points, as persistent strength in back-related equities lifted European equities benchmarks. Local indexes followed the lead of Wall Street, after the US Federal Reserve hawkish stance on tightening for the foreseeable future. Banks could make more money on charging interest when rates rose. Commerzbank led advancers, surging by 2.95%, followed by Deutsche Bank that added 1.78%. ThyssenKrupp, on the other hand, was the worst performer, down 3.49%. The index holds on to gains ahead of Friday's opening, although the daily chart shows that technical indicators are beginning to ease from near overbought readings, indicating that a downward correction is possible, although not yet confirmed. In the shorter term, and according to the 4 hours chart, the index turned neutral-to-bullish, as the Momentum indicator stands flat around its 100 level, whilst the price holds above an also horizontal 100 20 SMA. The RSI indicator in this last time frame, retreats from overbought levels, heading modestly lower around 62.
Support levels: 12,581 12,537 12,489
Resistance levels: 12,630 12,677 12,720
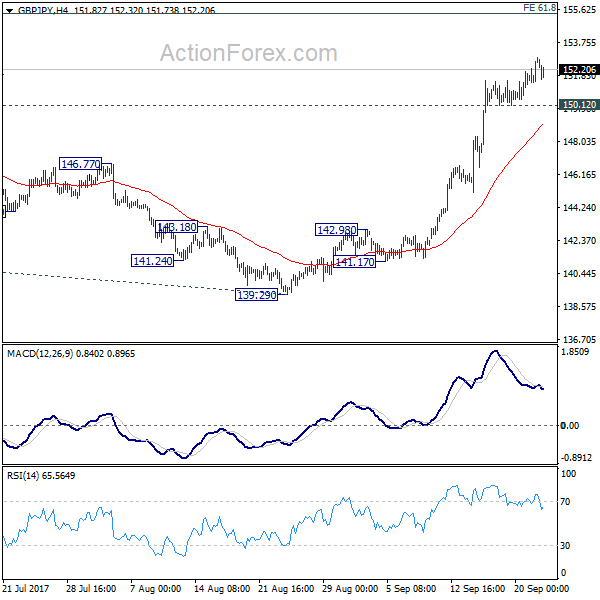
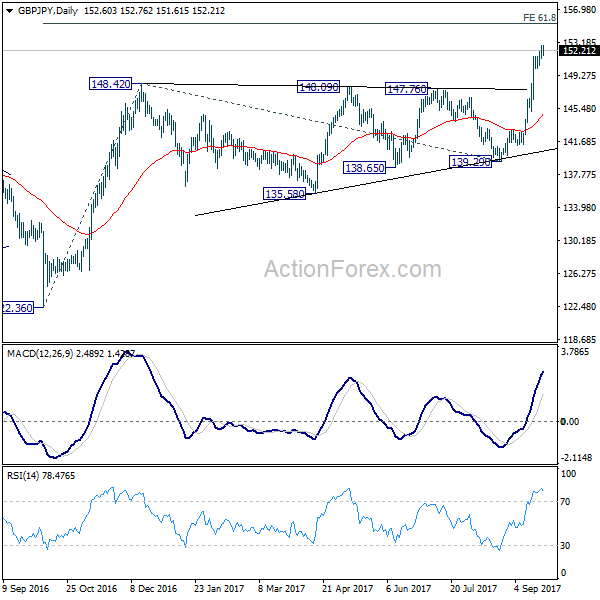
GBP/JPY Daily Outlook
Daily Pivots: (S1) 151.75; (P) 152.30; (R1) 153.30; More
Intraday bias in GBP/JPY remains on the upside with 150.12 minor support intact. Current medium term rise from 122.36 should target 61.8% projection of 122.36 to 148.42 from 139.29 at 155.39 next. On the downside, below 150.12 minor support will turn intraday bias neutral and bring consolidation before staging another rally.
In the bigger picture, the consolidation from 148.42 should have completed and medium term rebound from 122.36 is resuming. Firm break of 38.2% retracement of 196.85 to 122.36 at 150.43 will carry long term bullish implications. In that case, GBP/JPY could target 61.8% retracement at 167.78. For now, the bullish scenario is preferred as long as 139.29 support holds.
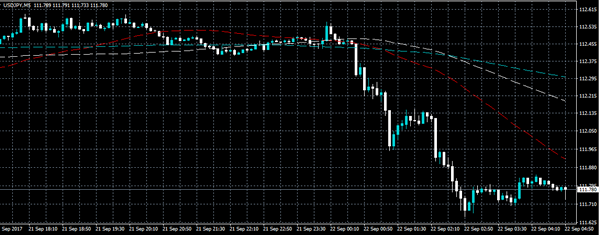
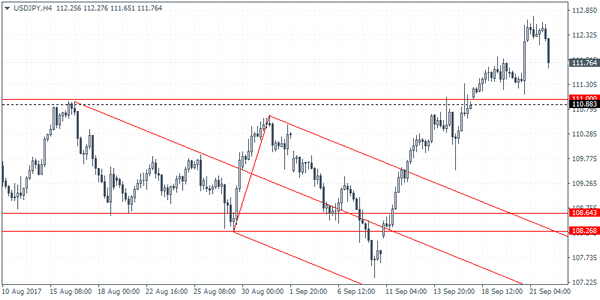
USDJPY Intraday Analysis
USDJPY (111. 76): Following a string of consecutive gains, USDJPY was seen easing back earlier today. This comes after the US dollar posted a two-month high yesterday. In the short term, support at 111.00 remains a key level that will be tested. This lever previously served as resistance and an unfilled gap from last Friday's close at 110.87 will most likely be filled. Further declines are unlikely unless USDJPY slips below this support level. To the upside, the next target is likely to be 113.00.
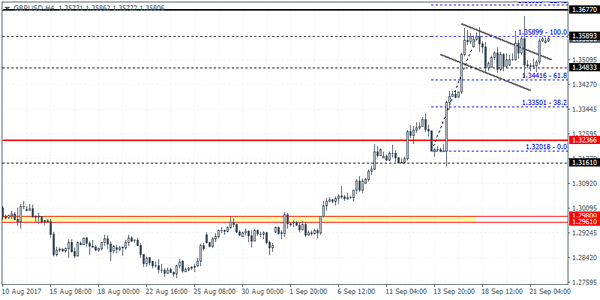
GBPUSD Intraday Analysis
GBPUSD (1.3580): The British pound extended gains once again yesterday breaking past the bullish flag pattern. Price action is critically trading below the resistance level of 1.3589. A breakout above this level is needed for the GBPUSD to continue to extend the gains. However, a reversal near the resistance level could send the cable lower as the bullish flag pattern becomes invalidated. The price action in GBPUSD will most likely be determined by the PM May's speech today.
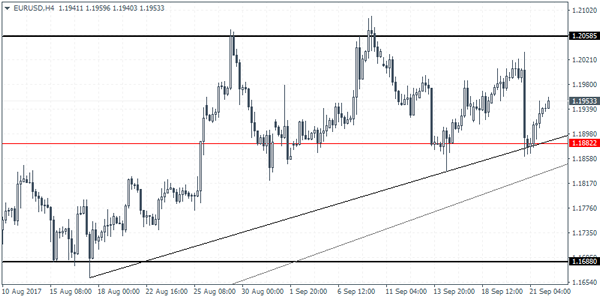
EURUSD Intraday Analysis
EURUSD (1.1953): Following a sharp decline of the 1.1950 level, the EURUSD managed to recover. Price action remains firmly range bound within the 1.2058 and 1.1822 levels of resistance and support. On the daily chart, the rising wedge pattern remains in play with the current level of 1.1950 proving to be a key level for the euro. A breakout above this level could signal a continuation to the upside, in which case we can expect gains towards 1.2090. To the downside, support at 1.1822 will be an important level as a breakdown below this level could signal a move to the lower support at 1.1672.