Sample Category Title
EUR/CHF Elliott Wave Analysis
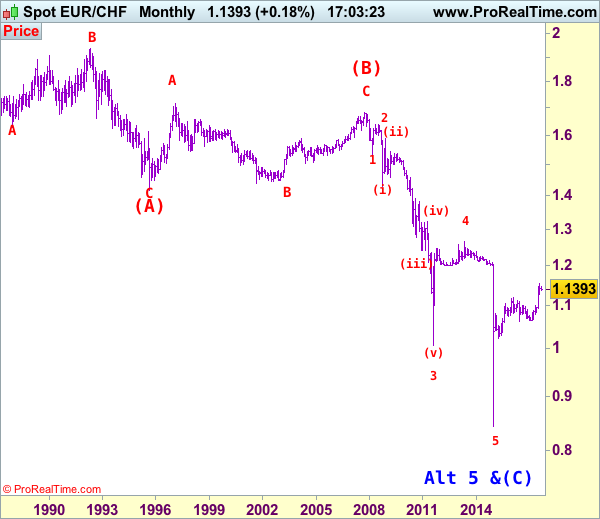
EUR/CHF : 1.1527
The single currency only retreated to 1.1345 (we recommended in our previous update to buy at 1.1330 and just missed our long entry) before finding renewed buying interest, the subsequent anticipated rally together with the breach of previous resistance at 1.1538 (wave iii top) add credence to our bullish view that medium term upmove has resumed and upside bias remains for further gain in wave v to 1.1600, then towards 1.1695-00 (61.8% projection of 1.0833-1.1538 measuring from 1.1259), however, this wave v is likely to be limited to1.1800 and price should falter well below 1.2000, bring correction later.
To recap our preferred count, the decline from 1.6828 (end wave (B)) is labeled as the beginning of wave (C) which should unfold as an impulsive move with 1: 1.5326, 2: 1.6377 and wave 3 is sub-divided into (i): 1.4300, (ii): 1.5880 and wave (iii) is still unfolding with (1): 1.4577, (2): 1.5448 and wave (3) is an extended 3rd with i: 1.5006, ii: 1.5383, wave iii: 1.3073, then wave iv ended at 1.3925 and wave v at 1.3073, wave (4) ended at 1.3925 and wave (5) has ended at 1.2765 which also marked the low of wave (iii) and wave (iv) has ended at 1.3835 and wave (v) as well as larger degree wave 3 has ended at 1.0075. The selloff from 1.2650 signals wave 4 has ended there and we are taking a view that the wave 5 could also have ended 0.8426, hence consolidation is seen with mild upside bias for rebound to 1.1400 (already met), then towards 1.1600.
On the downside, whilst initial pullback to 1.1490-00 is likely, reckon 1.1450 would limit downside and bring another rise later. Only a drop below said support at 1.1345 would abort and suggest top is possibly formed, bring subsequent weakness towards another previous support at 1.1259, a daily close below this level would indicate wave v has ended instead, bring major correction to 1.1200, then 1.1150-55.
Recommendation: Buy at 1.1455 for 1.1655 with stop below 1.1355.
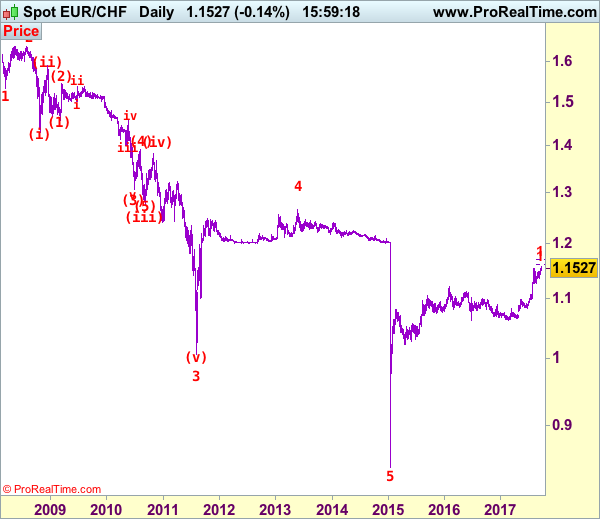
The long-term downtrend started from 1.9626 (Apr 1985) to 1.4166 (Sep 1995) is treated as wave (A) with A:1.6285 (Dec 1987), B: 1.9342 (May 1992) and C: 1.4166, then wave (B) ended at 1.6828 with A: 1.7147 (Feb 1997), B: 1.4398 (Sep 2001), C: 1.6828 (Nov 2007), therefore, wave (C) is now in progress with the breakdown indicated as above. This wave (C) already met indicated downside target at 1.1455/60 and 1.1300, it could have ended at 0.8426, consolidation with mild upside bias is seen for gain to 1.1000 and later towards 1.2000.
AUD/USD Elliott Wave Analysis
AUD/USD – 0.8009
Although aussie extended recent rise to as high as 0.8125, the subsequent retreat suggests consolidation would be seen and weakness to 0.7900 and possibly support at 0.7867-71 cannot be ruled out, however, break there is needed to signal a temporary top is formed, bring retracement of recent upmove to 0.7808 support which is likely to hold on first testing, bring rebound later.
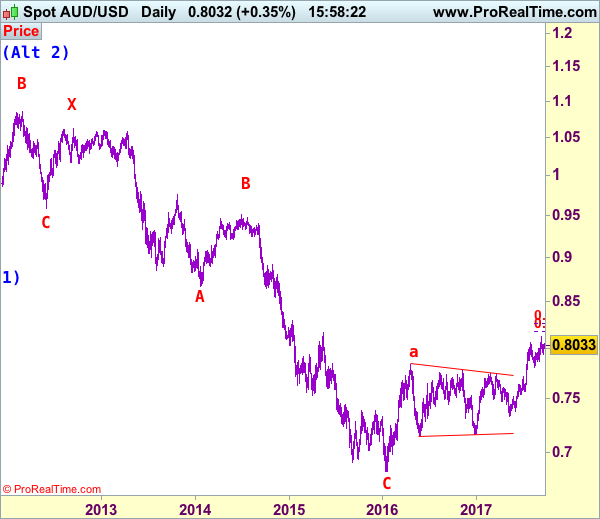
We are keeping our count that top has been formed at 1.1081 (wave 5 of V) and major correction (A-B-C-X-A-B-C) has commenced, indicated downside targets at 0.7945 (61.8% Fibonacci retracement of entire rise from 0.6007-1.1081) and 0.7750 had been met and downside bias is seen for further weakness to 0.6800, then 0.6700 but reckon 0.6500 would hold from here.
Our preferred count is that the rally from 0.6007 to 0.7270 (7 Jan 2009) is marked as wave A, the retreat to 0.6248 (2 Feb 2009) is wave B and the subsequent upmove is labeled as wave C with wave (iii) and wave (iv) ended at 0.8265 and 0.7700 respectively and wave (v) as well as 3 ended at 0.9407, then wave 4 ended at 0.8066 (instead of 0.8578). The wave 5 has met our indicated projection target of 1.1060 and could ended at 1.1081, this level is now treated as the peak of wave (C) as well as larger degree wave B, hence major fall in wave C has commenced, our initial downside target at psychological support at 0.7000 has just been met and further weakness to 0.6500 would be seen later.
On the upside, expect recovery to be limited to 0.8060-70 and said resistance at 0.8126 should hold, bring retreat later. A break of 0.8126 would signal recent erratic rise is still in progress and may extend further gain to previous resistance at 0.8163, then 0.8200, however, loss of upward momentum should prevent sharp move beyond 0.8260-65 (61.8% projection of 0.7329-0.8066 measuring from 0.7808), risk from there is seen for a retreat later.
Recommendation: Venture short at 0.8070 for 0.7870 with top above 0.8170.
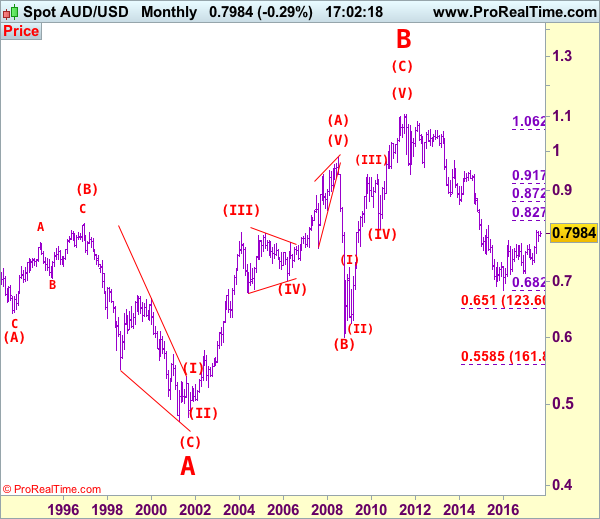
Our alternate count on the daily chart treated the top formed in 2008 at 0.9851 could be a larger degree wave I and was followed by a deep and sharp correction in wave II to 0.6007 and wave III is unfolding from there.
The long-term uptrend started from 0.4775 (2 Apr 2001) with an impulsive structure. Wave I is labeled as 0.4775 to 0.9851 (15 Jul 2008), wave II has ended at 0.6007 (Oct 2008) and wave III is still in progress which may extend further gain to 1.1265.
Daily Technical Analysis: EURUSD, GBPUSD, USDJPY, USDCHF
EURUSD
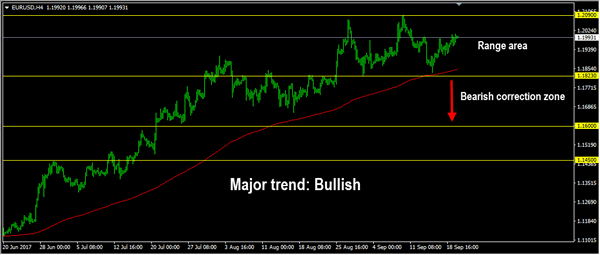
The EURUSD had a moderate bullish momentum yesterday topped at 1.2006. The bias is bullish in nearest term testing 1.2090 key resistance which need to be clearly broken to the upside to continue the bullish scenario targeting 1.2175 area. Immediate support is seen around 1.1950. A clear break below that area could lead price to neutral zone in nearest term but key support remains around 1.1823 area, which remains a good place to buy with a tight stop loss as a clear break below that area would take the pair to a bearish correction zone.
GBPUSD
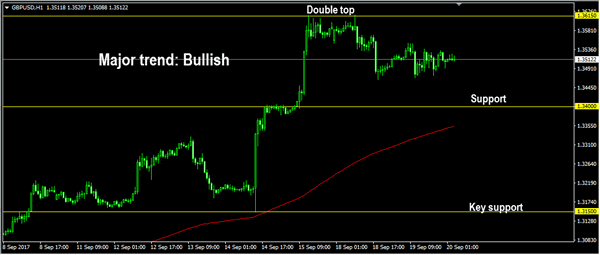
The GBPUSD was indecisive yesterday. The bias is neutral in nearest term. Overall I remain bullish but price is still in a bearish correction/consolidation phase after formed a double top formation as you can see on my H1 chart below. Immediate support is seen around 1.3465 followed by 1.3400 region. Immediate resistance is seen around 1.3550. A clear break above that area could trigger further bullish pressure retesting 1.3615 key resistance which need to be clearly broken to the upside to continue the bullish scenario targeting 1.3700 – 1.3750 area.
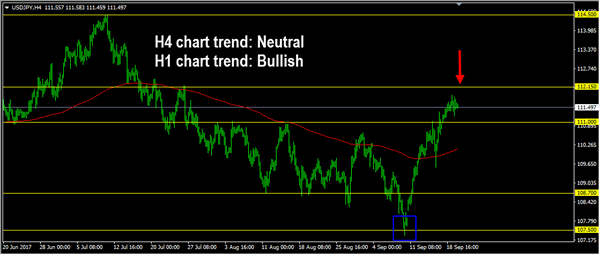
USDJPY
The USDJPY was indecisive yesterday. The bias is neutral in nearest term but overall price is still in a bullish phase since bounced-off 107.50 support area. Immediate support is seen around 111.00. A clear break below that area could trigger further bearish pressure testing 110.50 or lower. Immediate resistance is seen around 112.15. A clear break and daily close above that area could trigger further bullish pressure testing 113.10/50 area. Overall I remain neutral.
USDCHF
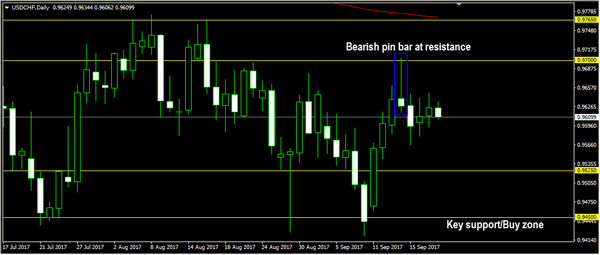
The USDCHF had another indecisive movement yesterday. There are no changes in my technical outlook. The bias remains neutral in nearest term probably with a little bearish bias testing 0.9565 – 0.9525 support area as a part of the bearish scenario after the appearance of the bearish pin bar on daily chart last week. Immediate resistance remains around 0.9650. A clear break and daily close above that area could trigger further bullish pressure testing 0.9700 region or higher. On the downside, a clear break and daily close below 0.9525 would expose 0.9450 key support which remains a good place to buy.
Trade Idea: GBP/USD – Buy at 1.3380
GBP/USD – 1.3519
Original strategy :
Buy at 1.3400, Target:1.3600, Stop: 1.3340
Position: -
Target: -
Stop: -
New strategy :
Buy at 1.3380, Target:1.3580, Stop: 1.3320
Position: -
Target: -
Stop:-
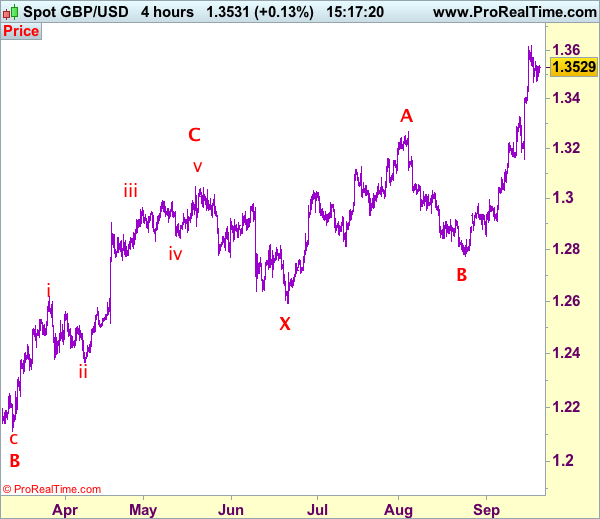
Cable’s retreat after meeting resistance at 1.3619 has retained our view that consolidation below this level would be seen and retracement to 1.3440-50 is likely, however, reckon 1.3380-85 would limit downside and bring another rise later, above resistance at 1.3552 would signal the retreat from 1.3619 has ended, bring retest of this level first. Looking ahead, a break of 1.3619 would extend recent upmove to 1.3650-60, then towards 1.3700. We have re-labeled our preferred count (pls see the attached chart) that the wave IV is unfolding as a complex double three (ABC-X-ABC) correction with 2nd wave B ended at 1.2774, hence 2nd wave C is unfolding and may extend further gain to 1.3650, then 1.3700, however, near term overbought condition should limit upside to 1.3770-75 and reckon 1.3800-10 would hold from here, bring retreat later.
In view of this, would not chase this rise here and would be prudent to buy sterling on subsequent pullback as 1.3380-85 should limit downside. Only below previous resistance at 1.3329 (now support) would abort and signal a temporary top is formed instead, bring deeper correction to 1.3290-00 and possibly towards 1.3250-60.
Our preferred count on the daily chart is that cable's rebound from 1.3500 (wave (A) trough) is unfolding as a wave (B) with A ended at 1.7043, followed by triangle wave B and wave C as well as wave (B) has ended at 1.7192, the subsequent selloff is the larger degree wave (C) which is still unfolding with minor wave (III) of larger degree wave 3 ended at 1.1986, hence wave (IV) correction is in progress which could either be a triangle wave (IV) of a complex formation but upside should be limited to 1.3500 and price should falter well below 1.4000, bring another decline in wave (V) of 3 for weakness to 1.1500, then 1.1200.
Trade Idea: GBP/JPY – Hold short entered at 151.00
GBP/JPY - 150.60
Original strategy:
Sold at 151.00, Target: 149.00, Stop: 151.60
Position: - Short at 151.00
Target: - 149.00
Stop: - 151.60
New strategy :
Hold short entered at 151.00, Target: 149.00, Stop: 151.05
Position: - Short at 151.00
Target: - 149.00
Stop:- 151.60
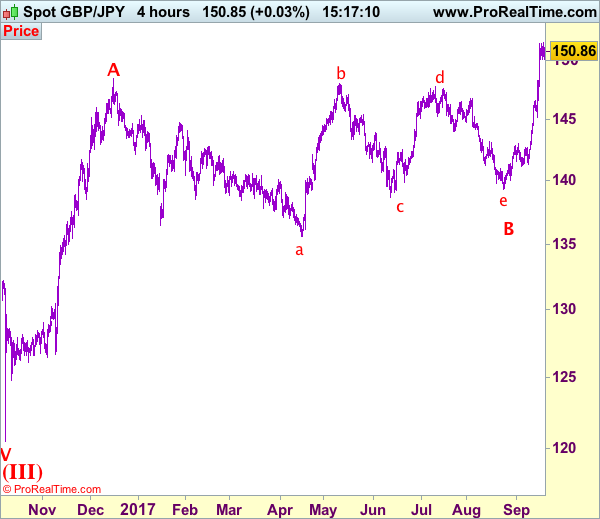
Sterling has remained confined within near term established range and further consolidation would be seen, however, reckon upside would be limited to 151.00 and bring retreat later, below 150.00-10 would suggest a temporary top is possibly formed, bring retracement of recent rise to 149.50, then 149.00, however, reckon previous resistance at 148.35 (now support) would hold and bring rebound later.
In view of this, we are holding on to our short position entered at 151.00. A firm break above 151.00-05 would suggest the pullback from 151.55 has ended, bring retest of this resistance, break there would extend recent rise to 152.00, then 153.00, however, overbought condition should limit upside to 154.00-10 and price should falter below 155.00. Our latest preferred count is that triangle wave B correction ended at 139.35 (the final e leg of triangle), hence wave C has commenced and may extend further gain to 153.00 and later 154.00.
Our preferred count is that larger degree wave V with circle is unfolding from 251.12 with wave (I) 219.34, (II): 241.38 and wave (III) is subdivided into 1: 192.60, 2: 215.89 (23 Jul 2008) and wave 3 ended at 118.87 earlier in 2009. The correction from there to 162.60 is wave 4 which itself is a double three and is labeled as first a-b-c ended at 151.53, followed by wave x at 139.03, 2nd a ended at 162.60, 2nd b at 146.75 and 2nd c leg of wave 4 ended at 163.00. Therefore, the decline from 163.00 to 116.85 is now treated as wave 5 which also marked the end of larger degree wave (III), hence wave (IV) major correction has commenced for retracement of the wave (III) from 241.38 and upside target at 183.95-00 (50% Fibonacci retracement of the wave (II) from 241.38) had been met, a drop below 160.00 would suggest wave (IV) has ended at 195.85, bring decline in wave (V) for initial weakness to 130 (already met) and 120.
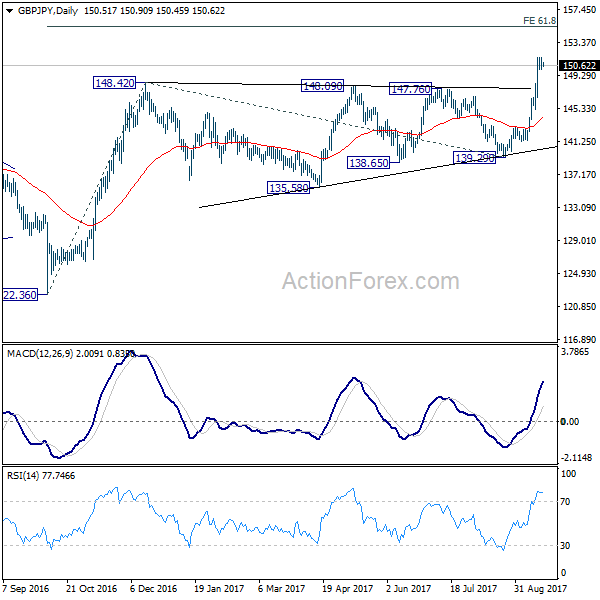
GBP/JPY Daily Outlook
Daily Pivots: (S1) 150.07; (P) 150.83; (R1) 151.53; More
With 150.12 minor support intact, intraday bias in GBP/JPY remains on the upside. Current medium term rise from 122.36 should target 61.8% projection of 122.36 to 148.42 from 139.29 at 155.39 next. On the downside, below 150.12 minor support will turn intraday bias neutral and bring consolidation before staging another rally.
In the bigger picture, the consolidation from 148.42 should have completed and medium term rebound from 122.36 is resuming. Firm break of 38.2% retracement of 196.85 to 122.36 at 150.43 will carry long term bullish implications. In that case, GBP/JPY could target 61.8% retracement at 167.78. For now, the bullish scenario is preferred as long as 139.29 support holds.

Currencies: Will Fed Help To Put A Floor Under The Dollar?
Sunrise Market Commentary
- Rates: Flattening US yield curve on Fed verdict?
We expect the FOMC to announce the start of its BS run-off, hang on the 2017/2018 rate projections (1-3) and potentially lower its neutral rate forecast. That would cause a flattening of the US yield curve. The front end of the US yield curve will in this scenario rise further as the market implied probability of a 2017 rate hike currently stands at 53%. - Currencies: Will Fed help to put a floor under the dollar?
Today's Fed policy assessment might be key for the dollar. The start of reducing the BS will probably give the dollar only limited additional interest rate support short-term. The new Fed dots will signal substantial additional rate rises to come. In theory this should be USD positive, but will the FX market believe the Fed more than it did until now?
The Sunrise Headlines
- US stock markets eked out small gains yesterday (+0.1%) in an uneventful session. Overnight, Asian risk sentiment is mixed but changes remain small.
- Trump warned that America would “totally destroy” North Korea if forced to defend itself or its allies, as the US president used his debut address to the UN general assembly to issue stark threats to a “wicked few” oppressive regimes.
- Theresa May will offer a €20B Brexit payment to the EU when she lays out her divorce strategy Friday, according to the FT. She hopes it will break a threemonth deadlock over negotiations and allow talks to include a future trade deal.
- Shipments of cars and electronics in August drove up Japan's exports at the fastest pace in nearly 4 years (18.1% Y/Y), evidence that overseas demand is strong enough to support healthy economic growth. Imports rose 15.2% Y/Y.
- Iraq's oil minister said OPEC and other crude producers were considering extending or even deepening a supply cut to curb a global glut, while a report showed a smaller-than-expected increase in U.S. inventories.
- Two key US senators said they had reached a pact on the parameters of a critical budget resolution, removing an obstacle on the complex path towards Republican-led tax cuts.
- Today's calendar contains UK retail sales, US existing home sales and a German 30-yr Bund auction. However, these will all be overshadowed by tonight's FOMC meeting and press conference by chair Yellen.
Currencies: Will Fed Help To Put A Floor Under The Dollar?
Will Fed put a floor under the dollar?
USD trading remained technical in nature yesterday as investors counted down to tomorrow's FOMC decision. Data were second tier and had little impact on trading. USD/JPY set a new ST top, but reversed gains later. EUR/USD traded close to mostly slightly below 1.20.
Overnight, Asian equities are narrowly mixed after WS closing at again new record levels. Japan August trade data were stronger-than-expected, but doesn't change to broader picture going into tomorrow's BOJ policy announcement. The BOJ is largely expected to keep course, lagging the normalisation process in other major economies. This prospect weighs on the yen, especially if rates in the US or Europe would rise further. The overall picture for the dollar stays unchanged. USD/JPY holds in the mid 111 area, within reach of the ST correction top. The dollar continues to trade weak against the euro. EUR/USD tries to regain the 1.20 barrier. EUR/JPY trades near the highest levels since December 2015.
Today, the eco data (German PPI, US existing home sales) will be largely ignored as investors will forward to the Fed policy decision. For an in depth preview of the Fed decision, see the fixed income part of this report. The start of the reduction of the balance sheet is a symbolic step in the normalisation process. The move was extensively pre-announced and the initial impact on market liquidity is limited. In this context, the new Fed rate dots might be more important for the dollar. We don't see changes in the median dot for 2017 (one additional hike) and for 2018 (3 extra hikes), but chances of a downward revision of the 2019 median dot (2.5 extra rate hikes) and the long run (3%) are high. The Fed's ongoing intention to normalize policy should be USD supportive given that hardly any further tightening is discounted. However, are there reasons for the market to believe the Fed more after today's meeting than it did till now? For that to happen, the Fed dots probably need ‘confirmation' from good eco data and higher inflation. We won't get that today. In this context, the defuse/fragile picture for the dollar might persist for some time. We assume more USD consolidation near the recent lows, maybe with room for some modest USD gains, but we dare not anticipate on it.
From a technical point of view EUR/USD hovers in a ST consolidation pattern between 1.1823 and 1.2070. It was disappointing for EUR/USD bears that last week's correction didn't reach the range bottom. More confirmation is needed that the recent bottoming out process in US yields and in the dollar might be the start of more sustained USD gains (against the euro).
The day-to-day momentum in USD/JPY is more constructive. The yen trades weak across the board. USD/JPY regained the 110.67/95 previous resistance. This a short-term positive. EUR/JPY shows a similar positive picture. So, the yen might stay under pressure at least until the next event risk pops up.
EUR/USD: nearing correction top ahead of the FOMC decision
EUR/GBP
UK retail sales in focus
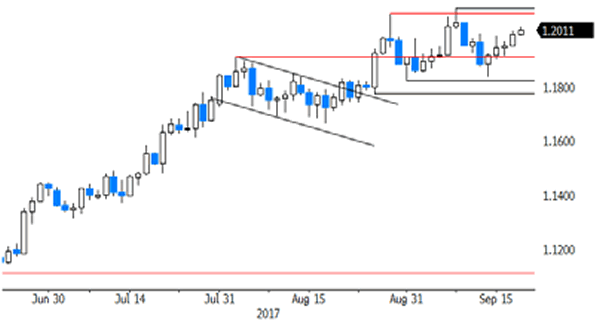
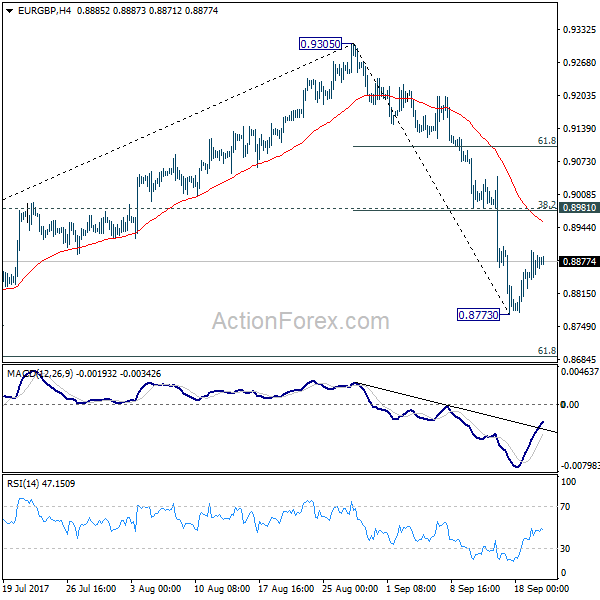
Sterling traded with a slightly negative intraday yesterday following a sharp rally last week, when the BoE warned that it was likely to raise its policy rate in the coming months. BoE governor Carney confirmed that view on Monday, but sterling started to lose ground. The political bickering between UK PM May and UK Foreign Secretary Johnson was also a slight sterling negative. EUR/GBP closed the session at 0.8881 (from 0.885). Cable hovered around the 1.35 pivot.
Today, the UK August retail sales take centre stage. A very modest rise of 0.2% M/M and 1.2% is expected A soft figure questions the viability of the recent hawkish BoE speak. However, the BoE is temporary giving more weight on prices than on activity data. Even so, the sterling rally might lose further momentum in case of a poor report. Markets will also look forward to PM's Brexit speech. A more conciliatory PM May would be a ST sterling positive. The recent GBP rebound is losing momentum. Even so, we look out whether sterling can return to the recent correction top (EUR/GBP low). If that move fails, the easiest part of the sterling rebound might be behind us.
EUR/GBP made an impressive uptrend since April and set a new MT top at 0.9307 late August on the back of euro strength. Simultaneously, UK price data were soft enough to keep the BoE side-lined. Recent price data amended this story and the ST-trend reversal of sterling was reinforced by recent BoE hawkish comments. Medium term, we maintain a EUR/GBP buy-on-dips approach as we expect the mix of relative euro strength and sterling softness to persist. However, the prospect of (limited) withdrawal of BOE stimulus put a solid floor for sterling ST term. We look out how far the current correction has to go. EUR/GBP is nearing support at 0.8743 and 0.8652, which we consider difficult to break. We start looking to buy EUR/GBP on dips.
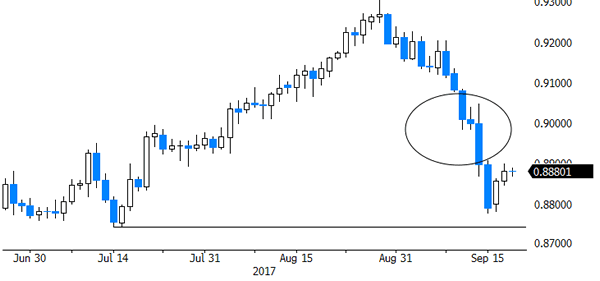
EUR/GBP: GBP-rebound rebound slows
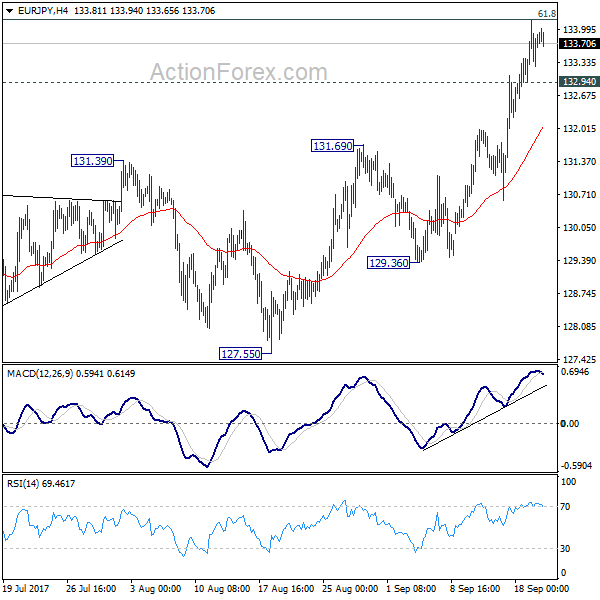
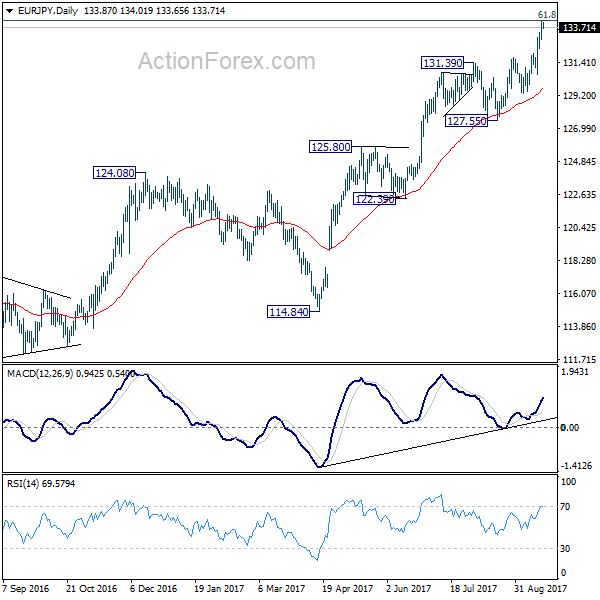
EUR/JPY Daily Outlook
Daily Pivots: (S1) 133.33; (P) 133.74; (R1) 134.27; More...
At this point, intraday bias remains on the upside for further rally. Firm break of 134.20 fibonacci level will pave the way to 141.04 resistance next. On the downside, below 132.94 minor support will turn intraday bias neutral and bring consolidations. But firm break of 131.39 resistance turned support is needed to be the first sign of near term reversal. Otherwise, outlook will remain bullish in case of retreat.
In the bigger picture, current rise from 109.03 is seen as at the same degree as the down trend from 149.76 (2014 high) to 109.03 (2016 low). as long as 124.08 resistance turned support holds, further rise is expected to 61.8% retracement of 149.76 to 109.03 at 134.20. Sustained break there will pave the way to key long term resistance zone at 141.04/149.76. On the downside, break of 127.55 support is needed to be the first signal of medium term reversal. Otherwise, outlook will remain bullish.
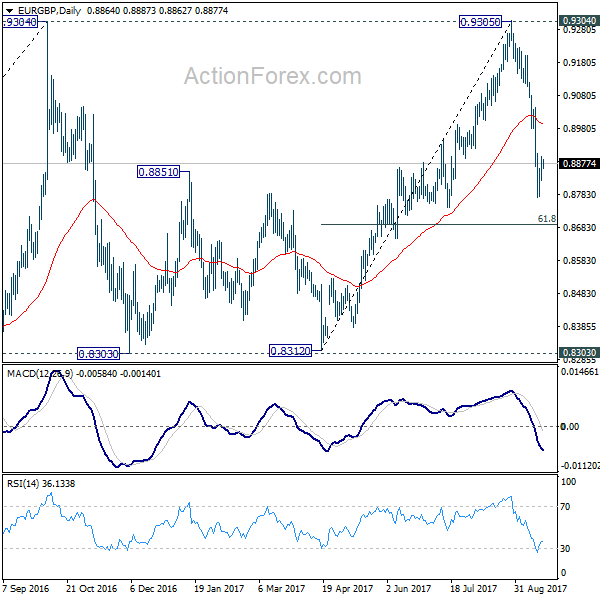
EUR/GBP Daily Outlook
Daily Pivots: (S1) 0.8846; (P) 0.8872; (R1) 0.8901; More
Intraday bias in EUR/GBP remains neutral for consolidation above 0.8773 temporary low. Near term outlook stays bearish as long as 0.8981 cluster resistance holds (38.2% retracement of 0.9305 to 0.8773 at 0.8976). Fall from 0.9305 is seen as the third leg of consolidation pattern from 0.9304. Below 0.8773 will target 61.8% retracement of 0.8312 to 0.9305 at 0.8691 and below. We'll look for bottoming signal again at it approaches 0.8303 support.
In the bigger picture, price actions from 0.9304 are viewed as a medium term corrective pattern. It's still in progress with fall from 0.9305 as the third leg. Break of 0.8303 could be seen. But we'd expect strong support from 0.8116 cluster support (50% retracement of 0.6935 to 0.9304 at 0.8120) to contain downside. Whole up trend from 0.6935 is expected to resume after consolidation from 0.9304 completes.
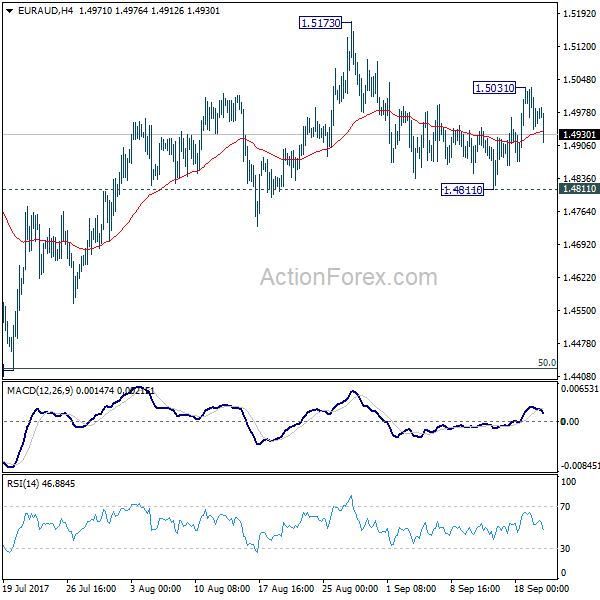
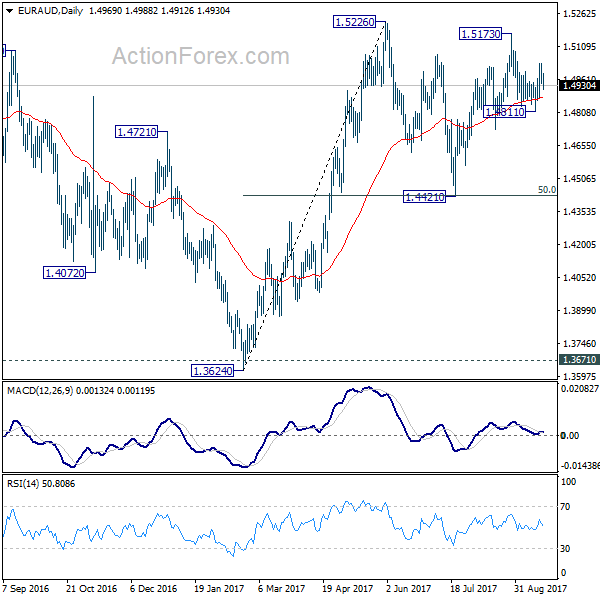
EUR/AUD Daily Outlook
Daily Pivots: (S1) 1.4932; (P) 1.4982; (R1) 1.5024; More....
EUR/AUD lost momentum after hitting 1.5031 and intraday bias is turned neutral again. Above 1.5031 will target 1.5173/5226 resistance zone first. Break will resume medium term rally from 1.3624. On the downside, below 1.4811 will turn bias to the downside and extend the fall from 1.5173 to retest 1.4421 support.
In the bigger picture, we're holding on to the view that corrective decline from 1.6587 medium term has completed at 1.3624. Rise from 1.3624 is expected to extend to retest 1.6587. The corrective structure of the price actions from 1.5226 is affirming this view. Above 1.5226 will target a test on 1.6587 key resistance. However, break of 1.4421 support will dampen our view and would drag EUR/AUD lower to retest key support zone around 1.3624.