Sample Category Title
Profit Taking Seen After Positive Start To The Week
- Geopolitical risks remain despite period of calm;
- Negative UK wage growth creates dilemma for BoE;
- Oil inventories eyed after API report.
It would appear that a running start to the week and fresh record highs in the S&P 500 has proven a little much for some traders, with profit taking seen ahead of Wednesday's open.
Naturally there is still plenty of underlying geopolitical risk in the markets at the moment, even if acts of provocation have decreased and become less hostile, and this is likely to put a cap on risk rallies for now. The longer this period of calm continues, the more relaxed investors will become which will be better for riskier assets, while safe havens will continue to experience unwinding. Gold is a perfect example of this having come off its highs while remaining at elevated levels.
The British pound got off to a good start on Wednesday, building on Tuesday's impressive gains which came on the back of stronger than expected inflation data, before labor market figures got in the way. Unemployment in the UK fell to its lowest level since June 1975 in the three months to July in an apparent sign that the labor market is tightening and yet, wage growth remained subdued at 2.1%, falling short of market expectations.
To put this into context, inflation last month rose by 2.9% which means real wage growth remains negative. Rising wages alongside prices would suggest that there is potential for higher inflation to become more ingrained in the economy but in the absence of this, the Bank of England can afford to look past the temporary currency driven spike and avoid putting additional pressure on household finances. Whether it will or not when it meets tomorrow is another question.
The rally in the pound over the last week or so and the moves after yesterday's CPI release would suggest traders are pricing in an increasing likelihood of a rate hike over the next 12 months. Should any more policy makers join Ian McCafferty and Michael Saunders in voting for a rate hike tomorrow – such as Andy Haldane who's previously indicated he may be tempted – then the pound could head higher once again.
With the two most notable US data releases this week due tomorrow and Friday, focus will shift to oil now as we await the latest inventory data from EIA. A 2.285 million barrel increase is expected for last week which is well short of the number reported by API on Tuesday evening leaving the potential for some upside surprise.
Euro Yawns As German CPI Matches Estimate
The euro is having an uneventful Wednesday. Currently, the pair is trading at 1.1973, up 0.06% on the day. On the release front, German Final CPI posted a small gain of 0.1%, matching the estimate. German WPI gained 0.3%, above the forecast of 0.1%. Eurozone data met expectations, with Employment Change gaining 0.4% and Industrial Production posting a gain of 0.1%. Inflation will also be the focus in the US, led by PPI, which is expected to improve to 0.3%. On Thursday, the US will release CPI and unemployment reports.
The German economy is the strongest in Europe, but even Germany finds itself grappling with stubbornly low inflation, which has also been a chronic problem in the US, Japan and throughout the Eurozone. German Final CPI, the primary gauge of consumer inflation, slowed to 0.1% in September, down from 0.4% in the August release. On the employment front, there was positive news as Eurozone Employment posted a second straight gain of 0.4%. This reflects stronger employment numbers in the eurozone, as stronger economic conditions have improved the labor market and pushed unemployment rates lower.
The US economy has been performing well in the second quarter. Preliminary GDP came in at a sizzling 3.0%, and the labor market remains close to capacity. Still, the Achilles heel of the economy remains stubbornly low inflation levels. Wage pressure has been limited, despite the fact that many businesses cannot fill job openings. Weak inflation has hampered the Fed’s plans to raise interest rates a third time this year, and the odds of a December hike have dipped to just 31%, as the markets are increasingly doubtful that the Fed will make a move before next year. Will the inflation picture improve? We could see better numbers this week for August inflation – PPI is expected to improve to 0.3% on Tuesday, and the same gain is forecast for CPI on Wednesday. Both estimates are higher than the July readings.
AUD/USD Elliott Wave Analysis
AUD/USD – 0.8043
Although aussie did resume recent upmove as the pair broke above previous resistance at 0.8066 (our long position entered at 0.7920 met target at 0.8120), the subsequent retreat from 0.8126 suggests consolidation would be seen and pullback to 0.7995-00 and possibly 0.7963 cannot be ruled out, however, reckon downside would be limited to 0.7921 and brig another rise later. Only a daily close below support at 0.7867-71 would signal a temporary top has been formed, bring retracement of recent rise towards support at 0.7808 which is likely to hold on first testing.
We are keeping our count that top has been formed at 1.1081 (wave 5 of V) and major correction (A-B-C-X-A-B-C) has commenced, indicated downside targets at 0.7945 (61.8% Fibonacci retracement of entire rise from 0.6007-1.1081) and 0.7750 had been met and downside bias is seen for further weakness to 0.6800, then 0.6700 but reckon 0.6500 would hold from here.
Our preferred count is that the rally from 0.6007 to 0.7270 (7 Jan 2009) is marked as wave A, the retreat to 0.6248 (2 Feb 2009) is wave B and the subsequent upmove is labeled as wave C with wave (iii) and wave (iv) ended at 0.8265 and 0.7700 respectively and wave (v) as well as 3 ended at 0.9407, then wave 4 ended at 0.8066 (instead of 0.8578). The wave 5 has met our indicated projection target of 1.1060 and could ended at 1.1081, this level is now treated as the peak of wave (C) as well as larger degree wave B, hence major fall in wave C has commenced, our initial downside target at psychological support at 0.7000 has just been met and further weakness to 0.6500 would be seen later.
On the upside, expect recovery to be limited to 0.8100 and said resistance at 0.8126 should hold, bring retreat later. A break of 0.8126 would signal recent erratic rise is still in progress and may extend further gain to previous resistance at 0.8163, then 0.8200, however, loss of upward momentum should prevent sharp move beyond 0.8260-65 (61.8% projection of 0.7329-0.8066 measuring from 0.7808), risk from there is seen for a retreat later.
Recommendation: Long entered at 0.7920 met target at 0.8120 with 200 points profit and would stand aside for this week.
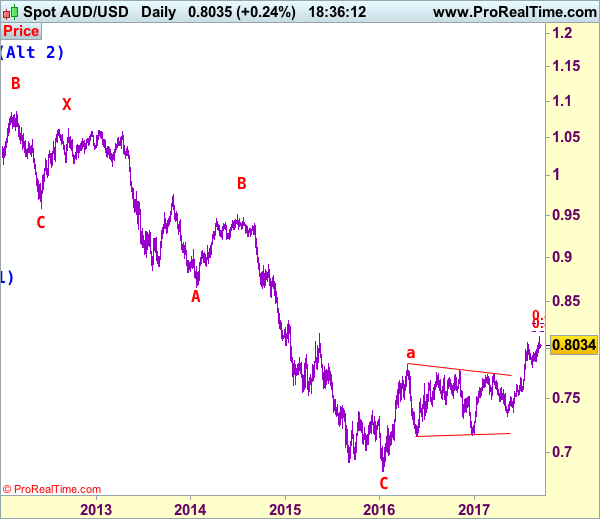
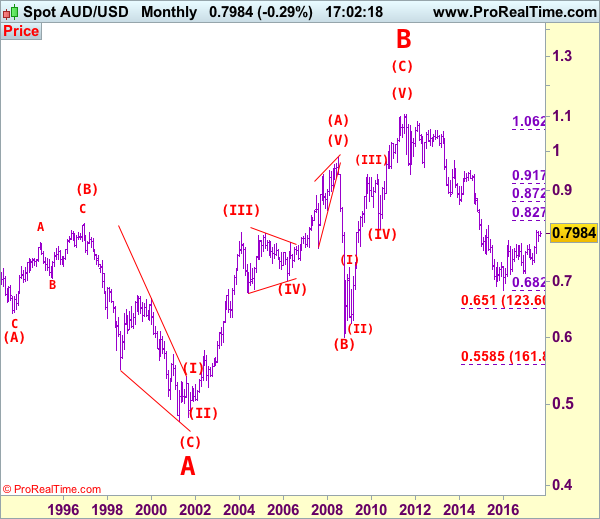
Our alternate count on the daily chart treated the top formed in 2008 at 0.9851 could be a larger degree wave I and was followed by a deep and sharp correction in wave II to 0.6007 and wave III is unfolding from there.
The long-term uptrend started from 0.4775 (2 Apr 2001) with an impulsive structure. Wave I is labeled as 0.4775 to 0.9851 (15 Jul 2008), wave II has ended at 0.6007 (Oct 2008) and wave III is still in progress which may extend further gain to 1.1265.
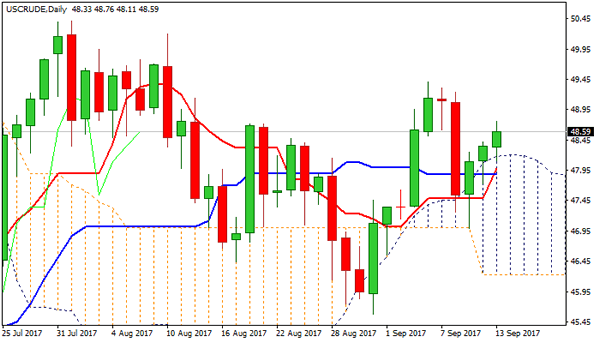
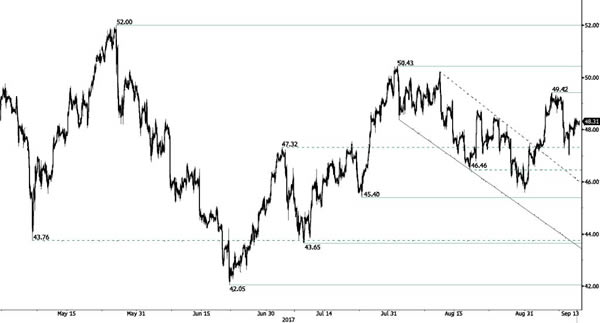
Technical Outlook: WTI OIL Extends Rally Into Third Straight Day, EIA Crude Stocks Report In Focus
WTI oil price remains steady and extends rally from $46.99 (11 Sep low) into third straight day, approaching round-figure barrier at $49.00.
Oil prices received support from OPEC monthly oil report which showed OPEC output fell by 79.000 barrels in August which offset negative impact from API crude stocks report which showed build of crude inventories by 6.1 million barrels last week (well above forecasted build of 2.5 million barrels).
This was the second consecutive build of crude stocks after Hurricane Harvey shut most of refining plants in Texas and reduced demand for the crude oil.
Today’s focus is on EIA weekly crude stocks report, due at 14:30 GMT. Forecast for the week ending Sep 8 is for build of crude inventories by 3.2 million barrels, which stands well below last week’s 4.5 million barrels build.
Bullish technical studies on daily chart are supportive for further advance, as yesterday’s break and close above daily cloud was strong bullish signal.
Near-term bulls focus at $49.00 barrier, break of which would open way for retest of key near-term barrier at $49.40 (06 Sep high).
The action is underpinned freshly formed daily Tenkan-sen / Kijun-sen bull-cross at $47.89.
Top of thick daily cloud at $48.20 offers solid support.
Res: 48.83, 49.00, 49.40, 49.58
Sup: 48.20, 47.89, 47.74, 47.50
EUR/CAD Elliott Wave Analysis
EUR/CAD – 1.4975
The single currency ran into heavy selling pressure at 1.5076 and has dropped sharply, the subsequent breach of previous support at 1.4478 signals early fall from 1.5259 is still in progress and may extend weakness to 1.4400 and possibly towards 1.4345-50 (61.8% Fibonacci retracement of 1.3784-1.5259), however, reckon downside would be limited to 1.4290-95 (100% projection of 1.5259-1.4478 measuring from 1.5076) and 1.4190-00 should hold, price should stay above 1.4110-15 (1.236 times projection), bring rebound later due to near term oversold condition.
Our latest preferred count is that larger degree wave [C] from 1.3289 as well as circle wave B ended at 1.7509 in Dec 2008 with (A): 1.6325, (B): 1.4719 followed by wave (C) at 1.7509, hence circle wave C is unfolding with wave 1 ended at 1.5186 (diagonal wave 1), wave 2 at 1.6096, impulsive wave 3 has ended at 1.2451, followed by wave 4 at 1.4380, in view of recent strong rebound, we are now treating the wave 5 as well as larger degree circle wave C has ended at 1.2129, hence (A)-(B)-(C) correction has commenced from there with impulsive wave (C) now unfolding and indicated initial upside target at 1.6000 had been met and reckon 1.6500 would hold.
On the upside, whilst initial recovery to 1.4600 is likely, reckon upside would be limited to 1.4665-70 and bring another decline later. Above 1.4730-35 would risk rebound to resistance at 1.4810-15 but only break there would signal low is formed instead, bring further gain too 1.4900, having said that, price should falter below 1.5000 and bring another decline later.
Recommendation: Sell at 1.4665 for 1.4465 with stop above 1.4765.

On the bigger picture, our long-term count on the monthly chart is that a big sideways consolidation from 2000 low of 1.2557 has possibly ended at 1.7509 as circle wave B with [A]: 1.6976 ( (A): 1.4513, (B): 1.2612, (C): 1.6976), wave [B]: 1.3289 is a double three with 1st a-b-c: 1.5384, x: 1.6709 and 2nd a-b-c: 1.3289. As indicated above, the wave [C] has ended at 1.7509. The selloff from there is now unfolding which itself should be labeled as an impulsive wave with wave 1: 1.5186 (diagonal wave 1), followed by wave 2: 1.6096 and wave 3: 1.2451, wave 4: 1.4380, wave 5 as well as larger degree circle wave C has possibly ended at 1.2129 and major correction has possibly commenced for retracement of recent decline towards 1.4000, then 1.4180-90 (38.2% Fibonacci retracement of 1.7509-1.2129). Below said support at 1.2129 would risk weakness to psychological support at 1.2000 and then 1.1851 (50% projection of 1.7509-1.2451 measuring from 1.4380) but reckon 1.1500 would remain intact, bring reversal later.

CRUDE OIL Sideways Price Action
Crude oil has strongly declined after the commodity monitored the $50 level. Key support is given at 45.40 (17/08/2017 high). Strong resistance can be found at 50.43 (31/07/2017). Expected to show continued short-term bearish move.
In the long-term, crude oil has recovered after its sharp decline last year. However, we consider that further weakness are very likely. Strong support lies at 35.24 (05/04/2016) while resistance can now be found at 55.24 (03/01/2017 high).
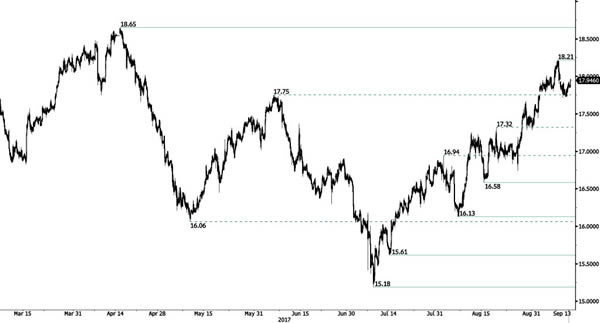
SILVER Consolidating Around 18.00
Silver has failed to reach strong resistance at 18.65 (17/04/2017 high) while support can be found at 16.58 (15/08/2017 high). The commodity lies in an uptrend channel. Expected to show another leg higher.
In the long-term, the trend is rater negative. Further downsides are very likely. Resistance is located at 25.11 (28/08/2013 high). Strong support can be found at 11.75 (20/04/2009).
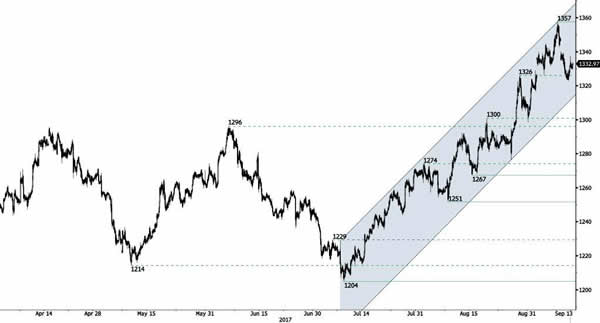
GOLD Riding Uptrend Channel
Gold has seen increased buying interest, clearing rising trend-line. Hourly support is given at a distance 1326 (gap low). Key resistance is located at 1375 (06/07/2016). Stronger support lies at 1204 (10/07/2017 high). Expected to show continued increase within uptrend channel.
In the long-term, the technical structure suggests that there is a growing upside momentum. A break of 1392 (17/03/2014) is necessary ton confirm it, A major support can be found at 1045 (05/02/2010 low)
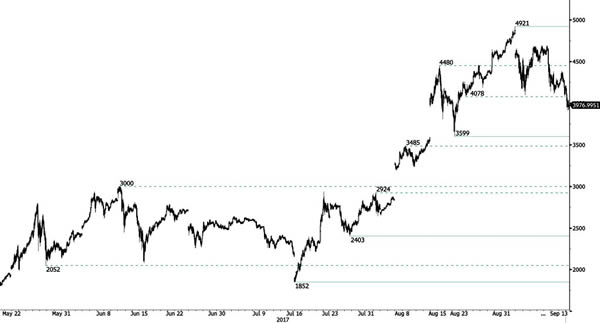
BITCOIN Strong Bearish Pressures
Bitcoin is taking a dive after strong interest over the summer. Support at 4078 (23/08/22017 low) has been broken. Technical picture remains nonetheless bullish as long as key support hold. Strong support lies at 3599 (22/08/2017 low). Key resistance can be located at 4921 (01/09/2017 high).
In the long-term, the digital currency has had an exponential growth. There are decent likelihood that the asset will reach $10'000.
EUR/CHF Buying Demand
EUR/CHF's buying pressures are going up and the pair has broken resistance area between 1.1356 and 1.1472. Further medium-term sideways moves are favoured.
In the longer term, the technical structure has reversed. Strong resistance is given at 1.20 (level before the unpeg). Yet, the ECB's QE programme is likely to cause persistent selling pressures on the euro, which should weigh on EUR/CHF. Supports can be found at 1.0184 (28/01/2015 low) and 1.0082 (27/01/2015 low).