Sample Category Title
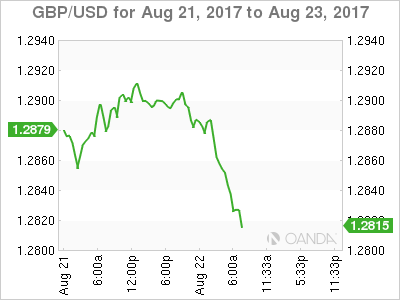
GBP/USD Elliott Wave Analysis
GBP/USD – 1.2825
As cable has remained under pressure after brief recovery, suggesting the fall from 1.3269 top is still in progress and bearishness remains for this fall to extend weakness to support at 1.2812, break there would encourage for decline to 1.2775-80 (38.2% Fibonacci retracement of 1.1986-1.3269), then towards 1.2700, however, near term oversold condition should limit downside to 1.2650-60 and reckon 1.2620-30 (50% Fibonacci retracement) would hold from here, price should stay well above previous chart support at 1.2589, bring rebound later.
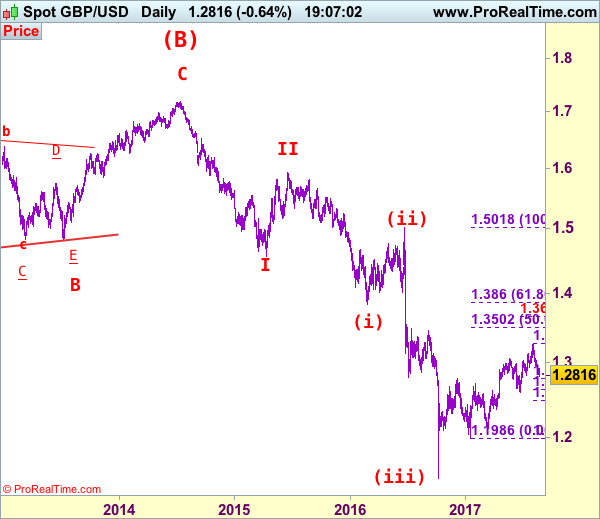
Our preferred count on the daily chart is that cable's rebound from 1.3500 (wave (A) trough) is unfolding as a wave (B) with A ended at 1.7043, followed by triangle wave B and wave C as well as wave (B) has possibly ended at 1.7192, below support at 1.4232 would add credence to this count, then further fall to 1.4000 level would follow but reckon downside would be limited to 1.3655 support and price should stay above previous support at 1.3500.
On the upside, expect recovery to be limited to 1.2915-20 and renewed selling interest should emerge below previous support at 1.2933 (now resistance), bring another decline. Above 1.2970 would risk test of 1.3000 but only break of resistance at 1.3032 would suggest first leg of decline from 1.3269 has ended, bring a stronger rebound to 1.3100 but still reckon upside would be limited to 1.3165 and price should falter well below said resistance at 1.3269, bring another decline later.
Recommendation: Sell at 1.2910 for 1.2710 with stop above 1.3010.
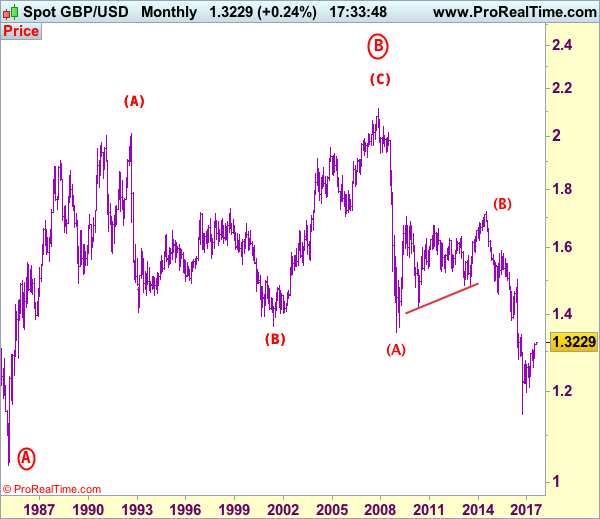
Longer term - Cable's rise from 1.0520 (Feb 1985) to 2.0100 (September 1992) is seen as [A], the decline to 1.3682 is labeled as (B) and (C) wave rally has ended at 2.1162 (9 Nov, 2007) which is also the top of larger degree wave B with circle. The selloff from there is a 5-waver with wave (A) ended at 1.3500 (23 Jan 2009), wave (B) itself is labeled as A: 1.6733, triangle wave B: 1.4813 and wave C as well as top of wave (B) ended at 1.7192 (2014), hence the selloff from there is an impulsive wave (C) with wave I : 1.4566, wave II 1.5930, an extended wave III is unfolding and already exceeded our downside target at 1.3500 and 1.3000, hence weakness to 1.2500 and possibly 1.2000 cannot be ruled out, however, price should stay well above psychological level at 1.0000.
GBP/CHF Elliott Wave Analysis
GBP/CHF – 1.2385
Sterling ran into renewed selling interest at 1.2854 earlier this month and has dropped sharply from there, reviving our bearish view and suggesting the rebound from 1.2241 (June low) has ended there, hence consolidation with downside bias is seen for weakness to 1.2300, then test of support at 1.2270, however, break of latter level is needed to add credence to this view and signal the decline from 1.3069 top has resumed for retest of 1.2241. Looking ahead, a drop below this level would suggest early correction from 1.1475 (2016 low) has ended at 1.3069, bring further weakness towards previous support at 1.2102 but psychological support at 1.2000 would hold on first testing.
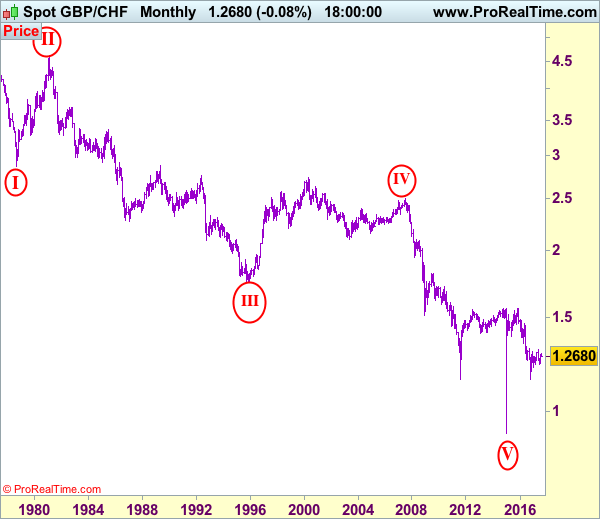
To recap the larger degree count, the selloff from 2.4965 (July 2007) is the beginning of wave V with circle and is labeled as 1: 2.3760, 2: 2.4425, wave 3 extension ended at 1.1470, followed by wave 4 at 1.5547, the quick rebound from 0.9106 suggests wave 5 as well as entire circle wave V could have ended there, hence consolidation with mild upside bias is seen for major correction to take place, bring initial test of 1.5547 (previous 4th of a lesser degree).
On the upside, whilst recovery to 1.2450 cannot be ruled out, reckon upside would be limited to 1.2500-10 and bring another decline later. Above 1.2580-85 would defer and risk test of resistance at 1.2646 but only a daily close above this level would suggest the retreat from 1.2854 has ended instead, risk a stronger rebound to 1.2700-10 and then 1.2750-55 but price should falter well below said resistance at 1.2854, bring another selloff later.
Recommendation: Sell at 1.2500 for 1.2275 with stop above 1.2600.

On the Monthly chart, the longer-term count is that major downtrend is under way with circle wave I at 2.8645 (Sep 1.978), then wave II with circle at 4.6175 (Feb 1981), the wave III with circle ended at 1.7425 (Nov 1995) and followed by wave IV with circle at 2.4965 (July 2007 with a short wave C) and wave V with circle has possibly ended at 0.9106. A monthly close above 1.5547 would add credence to this view, bring major correction to 1.7000, then towards psychological level at 2.0000.
Is It A Temporary Boost For The Dollar?
Tuesday August 22: Five things the markets are talking about
Uneven U.S economic data and political uncertainty have eaten away at investor confidence in recent weeks. Expectations that the Fed will raise rates at a “gradual” pace have been weighing on the dollar. Fed fund futures odds yesterday showed a roughly +40% chance of a rate-increase by December, down from +43% a month ago.
To date, the USD sell-off has already moved quite far, quite fast. The dollar ‘bulls' are starting to view the greenback's decline as becoming somewhat overdone at current levels, which leaves the dollar ripe for a recovery in the event of positive economic surprises.
With little in the way of top-tier economic data out this week stateside, markets are set to focus next on the annual conference of global central bankers hosted by the Kansas City Fed at Jackson Hole, Wyoming.
In particular, investors are awaiting comments from Fed Chairwoman Yellen and ECB President Draghi on Friday for clues on how policy makers view the U.S and the eurozone economies.
1. Stocks mixed results
European stocks joined a rally across most Asian equities following three-days of losses, though trading volumes were once again depressed.
In Japan, the Nikkei (-0.5%) inched down overnight to cap its fifth consecutive day in the ‘red' amid lingering tensions on the Korean peninsula, though a strong rally in metals-linked shares helped steady the broader market. The Topix added +0.06%.
In South Korea, the Kospi index gained +0.4%, as did Australia's S&P/ASX 200. In Hong Kong, the Hang Seng Index rose +1.1%, outperforming all other equity markets in the region, on strong earning results.
In China, stocks ended higher as a unit of China Unicom surged by the daily limit for a second day, and as financial and materials firms also experienced strong gains. The blue-chip CSI300 index rose +0.3%, while the Shanghai Composite Index gained +0.1%.
In Europe, indices trade higher across the board, rebounding from the weakness seen in the past few sessions. Indexes are been led by mining names following a continued increase in commodity prices (copper trades at a three year-high, while zinc trades atop of its 10-year high).
U.S stocks are set to open in the ‘black' (+0.2%).
Indices: Stoxx600 +0.5% at 374.6, FTSE +0.7% at 7368, DAX +0.6% at 12139, CAC-40 +0.4% at 5108, IBEX-35 +0.3% at 10386, FTSE MIB +0.1% at 21775, SMI +0.6% at 8936, S&P 500 Futures +0.2%
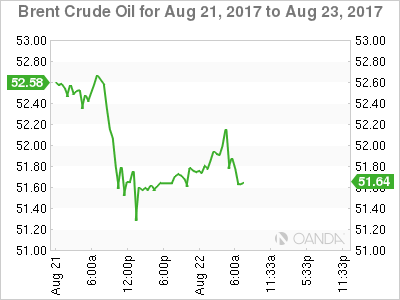
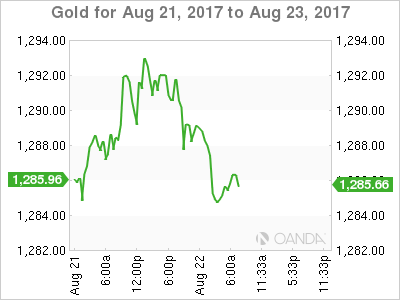
2. Oil prices rise on signs of tightening market, gold lower
Oil prices are better bid ahead of the U.S open, lifted by indications that supply is gradually tightening stateside.
Brent crude oil is up +40c at +$52.06 a barrel, while U.S light crude +35c higher at +$47.72.
U.S crude oil inventories have been falling consistently in recent weeks and if the downtrend in oil inventories is maintained this week supports the bullish case for higher crude prices.
Note: U.S commercial crude inventories have fallen by -13% from its March peaks, to +466.5m barrels.
U.S. crude production has broken through +9.5m bpd, it's highest since July 2015, but it's expected to slowdown as U.S energy firms cut the number of rigs drilling for new oil.
The weekly rollout of U.S inventory numbers starts later today. This will give investors a chance to see if the recent downward trend in U.S stocks is continuing.
Note: American Petroleum Institute (API) will publish statistics on crude inventories and refinery operations for last week at 4:30 pm EDT. Tomorrow, it's the turn of the U.S government's EIA at 10:30 am EDT.
U.S crude inventories are expected to have fallen for an eighth consecutive week and drop by -3.4m barrels.
Gold prices have slipped overnight (down -0.4% at +$1,285.48 an ounce), pressured by a stronger dollar. Investors continue to focus on North Korea tensions and remain cautious ahead of Jackson Hole later this week. The ‘yellow' metal ended yesterday's session up +0.5%.
3. Yield little changed ahead of Symposium
In the absence of major economic data, bonds have been strongly influenced by market sentiment in recent sessions, a pattern that is expected to hold for much of this week until the Jackson Hole conference on Friday, which kicks off with a speech from Fed Chairwoman Janet Yellen on financial stability. A key question is whether Yellen will suggest the need for tighter monetary policy to address high asset prices.
Treasuries continue their recent close correlation with stocks, edging a tad lower overnight as global stocks rally. The 10-year yield was recently at +2.185%.
Yields on German Bunds (+0.41%) and U.K Gilts (+1.085%) have been on a downtrend since July and are not expected to move much this week, at least until ECB's Draghi's appearance at the Fed's symposium.
Note: Bund yields fell from their 18-month high in July (+0.60%) after comments from ECB's Draghi were seen paving the way for a scaling back of the ECB's massive monetary stimulus in the months ahead.
While a trimming of expectations for a tighter ECB policy have helped push down yields across the euro zone, investors are now seem reluctant to go any further without fresh policy cues. With market speculation mounting about when the ECB will signal an exit from its ultra-loose monetary policy, Draghi's speech Friday remains a key focus for markets.
4. Dollar gets the green light for now
In a light volume session overnight the ‘mighty' USD is a tad firmer ahead of the U.S open with the markets focus looking ahead to the Fed's Janet Yellen speech at the end of the week. Investors are looking for insights into the outlook for U.S monetary policy.
Note: Fed Chair Yellen's speech could increase market expectations that the Fed would raise interest rates in December.
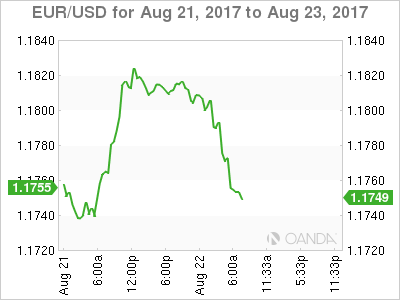
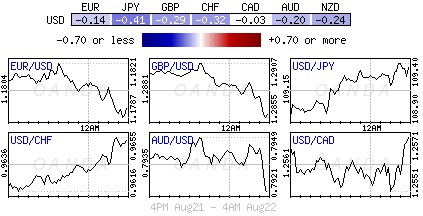
Europe's ‘single' unit, the EUR (€1.1754), remains within striking distance of this years high print of €1.1870. Last week's ECB minutes noted that concerns were expressed about the risk of the EUR “overshooting” in the future. Expect investors to keep their positions relatively tight ahead of Draghi's speech Friday.
GBP/USD (£1.2835) is a tad softer as dealers assess uncertainties about how long it will take for the UK to forge post-Brexit trade agreements with the E.U. USD/JPY (¥109.29) is little changed.
5. German ZEW survey mixed
Data this morning showed that German economic sentiment fell markedly this month, but the general outlook for Europe's largest economy remains “stable” and relatively solid, according to the ZEW think tank.
The ZEW Indicator of Economic Sentiment for Germany fell by -7.5 points in August 2017 and now stands at 10.0.
Note: The indicator remains significantly below the long-term average of 23.8. The assessment of the current economic situation in Germany increased slightly by +0.3 m/m to 86.7 points.
Many expect the German economy to maintain its solid performance in H2. The Bundesbank said Monday that “the strong economic upturn in the German economy is expected to continue in the third quarter, with industrial output probably continuing to play an important role, thanks to a substantial expansion in exports.”
Note: Official data last week showed that the German economy grew by +0.6% in quarterly terms, or +2.5% in annualized terms, in Q2, following an annualized growth of +2.9% in Q1.
Technical Outlook: USDTRY – Final Push Towards Mid-June Low At 3.4743 Seen On Break Of 200SMA
The pair bounced back above 3.5000 handle following recovery of the greenback on Tuesday, after downside attempts repeatedly failed to clear 200SMA support at 3.4928.
Bearish acceleration on Monday that eventually broke and close below 3.5150 support (Fibo 76.4% of 3.4743/3.6467 rally) which contained downside attempts since mid-July, generated bearish signal.
Final break below 200SMA would open way towards key med-term support at 3.4743 (14 June low).
Upside attempts were so far limited and unable to sustain break above 3.5000, however stronger upticks should be contained by converged falling 10/20SMA’s (3.5214/44).
Res: 3.5039, 3.5120, 3.5214, 3.5244
Sup: 3.4928, 3.4904, 3.4874, 3.4743
Technical Outlook: USDCAD – Falling Hourly Cloud Weighs On Recovery
The pair bounced after hitting fresh marginally lower three-week low at 1.2546 on Tuesday, driven by greenback's recovery.
Downside action was repeatedly contained by Fibo 61.8% of 1.2413/1.2778 support at 1.2552 and the pair may extend consolidation while the latter holds.
Mild upside action was seen so far, with initial barriers at 1.2607/09 (Monday's high/20SMA) staying intact for now, as weak tone still dominates on near-term studies and hourly cloud (spanned between 1.2602/23) weighing on near-term action.
Stronger upside could be expected on sustained break above hourly cloud, otherwise the current action could be seen as consolidation before bear-leg from 1.2778 (15 Aug lower top) resumes.
Outcome from this week's key event, Jackson Hole Symposium would generate firmer direction signals.
Res: 1.2609, 1.2623, 1.2635, 1.2660
Sup: 1.2546, 1.2500, 1.2450, 1.2413
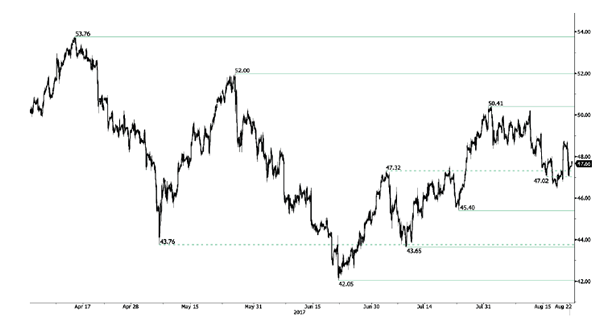
CRUDE OIL Holding Below The 200-DMA And Above 50-DMA
Crude oil is trading mixed. Hourly support is given at a distance at 45.40 (24/07/2017 low). Strong resistance can be found at 50.41 (31/07/2017). Expected to show short-term sideways move.
In the long-term, crude oil has recovered after its sharp decline last year. However, we consider that further weakness are very likely. Strong support lies at 35.24 (05/04/2016) while resistance can now be found at 55.24 (03/01/2017 high).
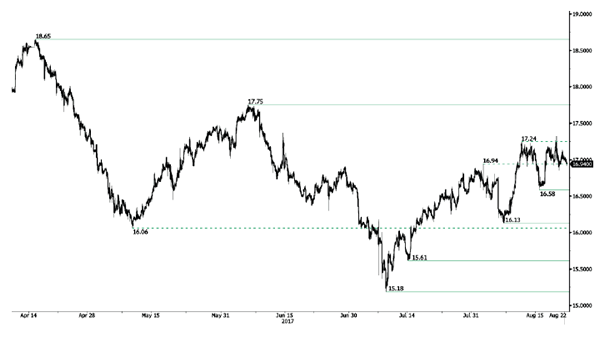
SILVER Volatility Is Fading
Silver's bullish pressures are on. Hourly resistance given at 17.24 (10/08/2017 high) has been broken while support can be found at 16.58 (15/08/2017 high). The commodity lies in a short-term uptrend channel. Expected to show another leg higher.
In the long-term, the death cross indicates that further downsides are very likely. Resistance is located at 25.11 (28/08/2013 high). Strong support can be found at 11.75 (20/04/2009).
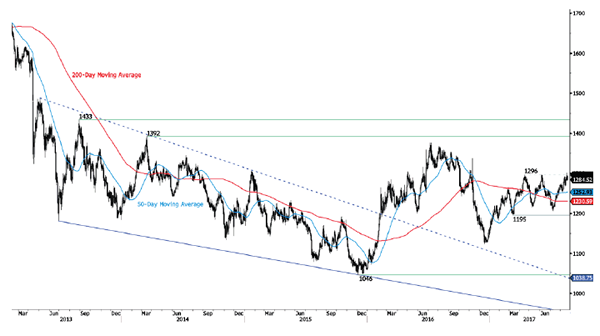
GOLD Consolidating Below 1300
Gold has broken strong resistance given at 1296 (06/06/2017 high). Hourly support is given at 1251 (08/08/2017 low). Stronger support lies at 1204 (10/07/2017 high). Expected to show continued consolidation below $1300.
In the long-term, the technical structure suggests that there is a growing upside momentum. A break of 1392 (17/03/2014) is necessary ton confirm it, A major support can be found at 1045 (05/02/2010 low).
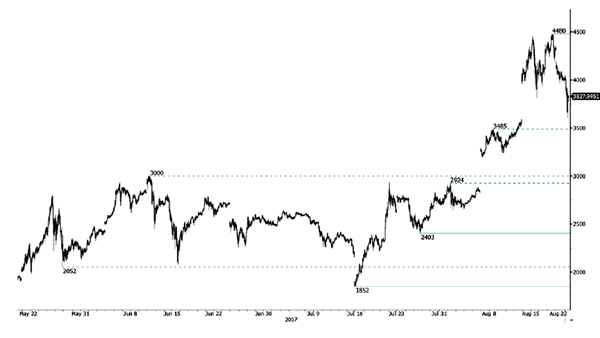
BITCOIN Strong Bearish Retracement
Bitcoin is pausing after the massive surge over the past few days. Resistance is at all-time high at 4480 (17/08/2017 high). Hourly support lies very far at 2403 (26/07/2017 low). The road is wide open for another bullish move.
In the long-term, the digital currency has had an exponential growth. There are decent likelihood that the asset will consolidate above $1500. Long-term support is given at $1464 (04/05/2017 low).
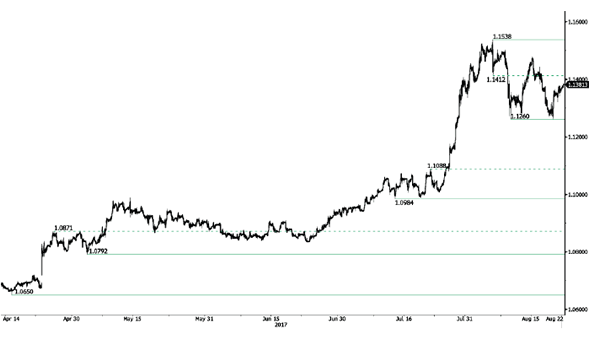
EUR/CHF Consolidating Around 1.1300
EUR/CHF's volatility is important. Hourly support is located at 1.1260 (04/08/2017 low). Expected to show further consolidation.
In the longer term, the technical structure has reversed. Strong resistance at 1.1200 (04/02/2015 high) has been broken. Yet,the ECB's QE programme is likely to cause persistent selling pressures on the euro, which should weigh on EUR/CHF. Supports can be found at 1.0184 (28/01/2015 low) and 1.0082 (27/01/2015 low).