Sample Category Title
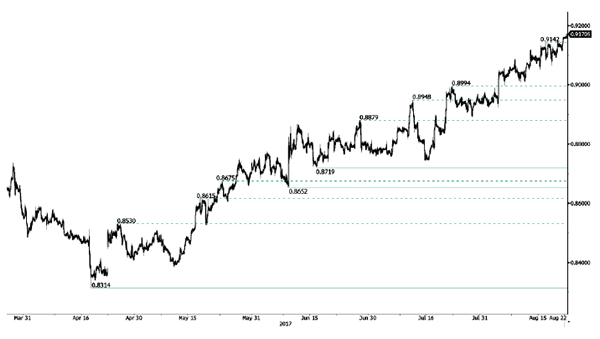
EUR/GBP Continued Increase
EUR/GBP is trading around its highest levels of the year. Hourly resistance lies at 0.9415 (07/10/2017 high). Hourly support is given at a distance at 0.8742 (16/06/2017 low). Downside risks are nonetheless important.
In the long-term, the pair has largely recovered from recent lows in 2015. The technical structure suggests a growing upside momentum. The pair is trading above from its 200 DMA. Strong resistance can be found at 0.9500 psychological level.
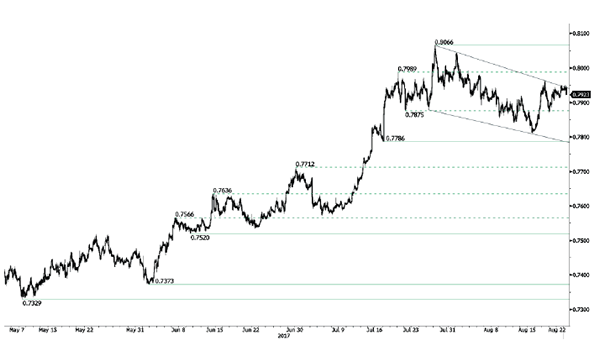
AUD/USD Monitoring Downtrend Channel
AUD/USD's short-term technical structure is reversing. Hourly support can be found at 0.7786 (18/07/2017 low). Hourly resistance is given at 0.8066 (27/07/2017 high). Expected to show continued growth.
In the long-term, we are waiting for further signs that the current downtrend is ending. Key supports stand at 0.6009 (31/10/2008 low) . A break of the key resistance at 0.8295 (15/01/2015 high) is needed to invalidate our long-term bearish view.
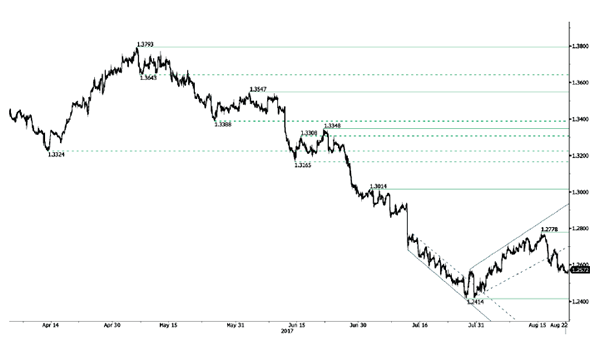
USD/CAD Weakening
USD/CAD is having some weakness. Hourly support is given at a distance at 1.2414 (27/07/2017 low). Expected to show continued short-term bearish move.
In the longer term, the pair has broken longterm support that can be found at 1.2461 (16/03/2015 low) before bouncing back. Strong resistance is given at 1.4690 (22/01/2016 high). The pair should head further lower.
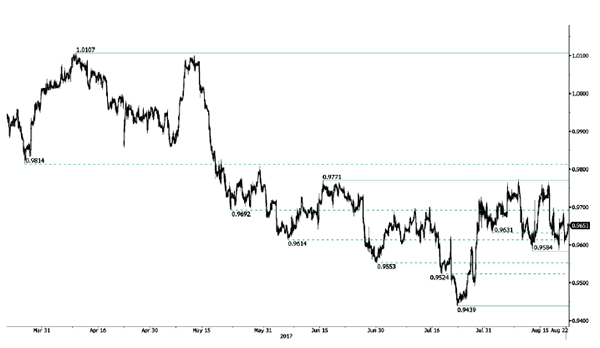
USD/CHF Sideways Price Action
USD/CHF is pushing lower. Resistance is given at 0.9771 (15/06/2017 high). Hourly support lies at at 0.9584 (08/11/2017 low). Expected to to push even lower.
In the long-term, the pair is still trading in range since 2011 despite some turmoil when the SNB unpegged the CHF. Key support can be found 0.8986 (30/01/2015 low). The technical structure favours nonetheless a long term bullish bias since the unpeg in January 2015
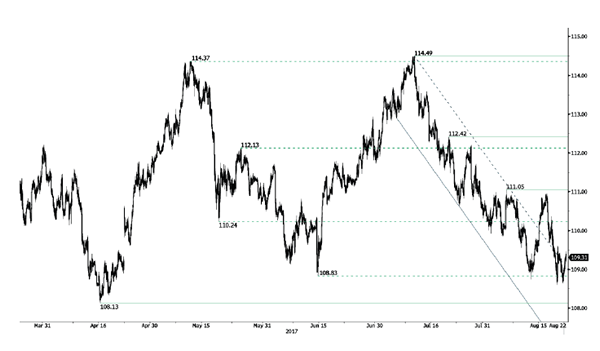
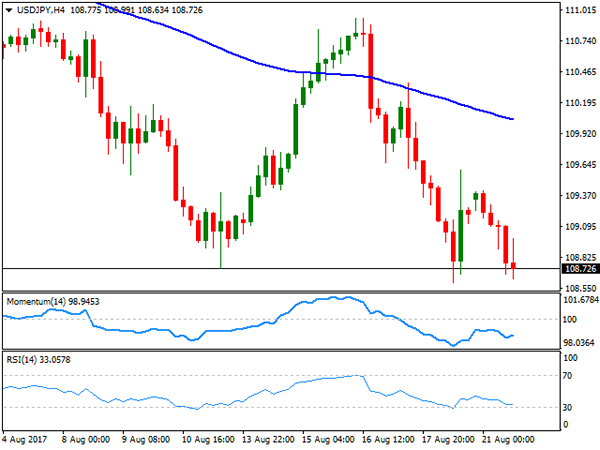
USD/JPY Continued Bearish Pressures
USD/JPY's bearish pressures are on despite ongoing consolidation. The pair is heading back towards former support at 108.83 (17/04/2017 low). Expected to show another leg lower.
We favor a long-term bearish bias. Support is now given at 96.57 (10/08/2013 low). A gradual rise towards the major resistance at 135.15 (01/02/2002 high) seems absolutely unlikely. Expected to decline further support at 93.79 (13/06/2013 low).
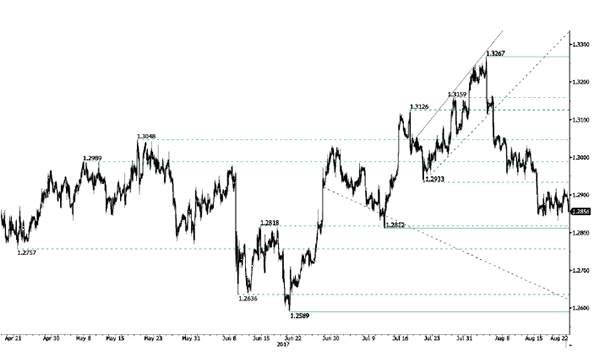
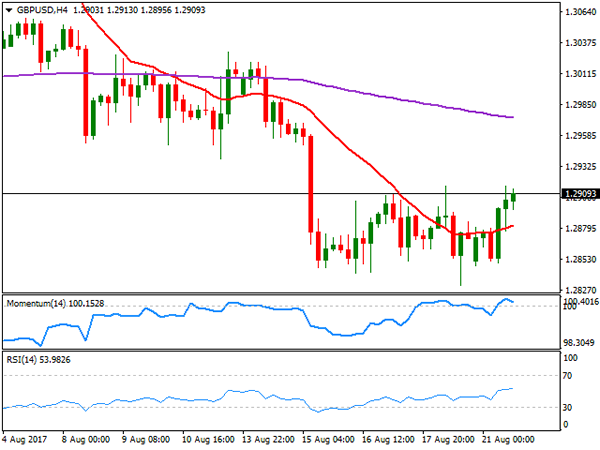
GBP/USD Monitoring Strong Support
GBP/USD is edging lower. Hourly resistance is given at 1.2917 (18/08/2017 high). Hourly support can be found at 1.2812 (12/07/2017 low). Expected to show continued bearish pressures.
The long-term technical pattern is even more negative since the Brexit vote has paved the way for further decline. Long-term support given at 1.0520 (01/03/85) represents a decent target. Long-term resistance is given at 1.5018 (24/06/2015) and would indicate a long-term reversal in the negative trend. Yet, it is very unlikely at the moment.
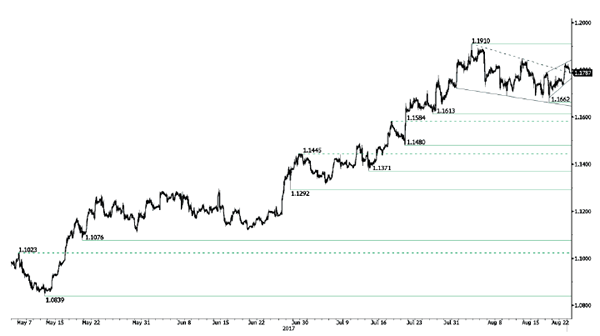
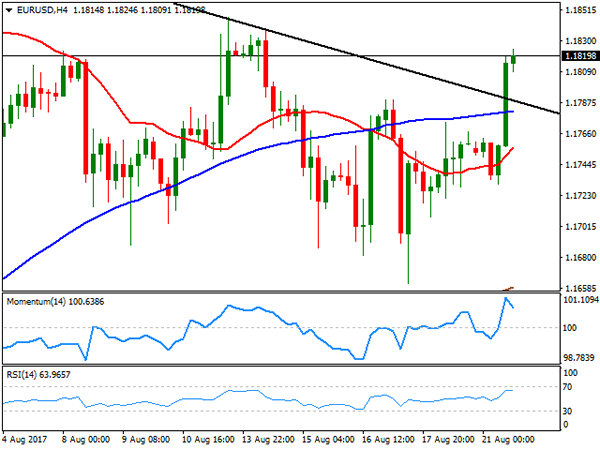
EUR/USD Riding Very Short-Term Uptrend Channel
EUR/USD short-term bullish pressures are on. Hourly resistance can be found at 1.1910 (02/08/2017 high) while hourly support ies at 1.1613 (26/07/2017 low). Expected to show further very short-term buying pressures.
In the longer term, the momentum is now turning largely positive. We favour a continued bullish bias. Key resistance holding at 1.1871 (24/08/2015 high) has been broken while strong support lies at 1.0341 (03/01/2017 low).
Risk Appetite Gradually Returning But Sentiment Is Fragile
- Geopolitical tensions could reignite at any moment;
- USD rallies ahead of Yellen appearance at Jackson Hole;
- EUR lower as traders anticipate dovish Draghi speech on Friday.
Risk appetite is gradually returning to the markets again on Tuesday, although sentiment is likely to remain very fragile given the events of the past couple of weeks.
Geopolitical risk may have subsided for now, it still feels like we're always on the cusp of an escalation between the US and North Korea, especially in a week in which military exercises are being carried out in the South. While the exercises were planned a long time ago between the US and South Korea, the antagonising nature of them could provoke a response from North Korea which would could easily trigger another run to safety.
The US dollar is recovering once again from the political drama in the US last week. The greenback has understandably shown itself to be vulnerable to the political situation in the US and last week's events did nothing to help the currency. A quieter start to the week is providing some support for the dollar today but it continues to languish not far from its recent lows, with the potential for the situation to deteriorate rapidly once again still high.
Today's moves in the dollar may also be a reflection of expectations for this Friday's Jackson Hole appearance by Federal Reserve Chair Janet Yellen. The event is seen as the ideal platform for the Fed Chair to prepare the markets for a balance sheet reduction announcement in September while also providing an update on the central bank's position on interest rates. A number of policy makers have voiced concern about inflation in recent months, casting doubt on whether another rate hike this year will happen. Should the dollar continue to make gains in the coming days, it may suggest that traders are anticipating a more hawkish Yellen on Friday.
ECB President Mario Draghi is expected to keep his cards very close to his chest when he speaks at the event. Draghi will be keen to avoid any further mishaps, having unintentionally misled traders last month which was later corrected by other ECB officials. With the euro already trading at high levels – noted by the ECB in the recent minutes – Draghi may deliver as dovish a message as is possible while leaving the door open to tapering in the coming months. This expectation may be weighing on the euro today, along with the disappointing ZEW economic sentiment number from Germany, which worryingly fell for a third consecutive month to a 10-month low.
Another quiet day on the economic calendar lies ahead, with Canadian retail sales the only notable release.
Trade Idea: GBP/USD – Sell at 1.2910
GBP/USD – 1.2838
Original strategy :
Sell at 1.2980, Target: 1.2815, Stop: 1.3040
Position: -
Target: -
Stop: -
New strategy :
Sell at 1.2910, Target: 1.2710, Stop: 1.2970
Position: -
Target: -
Stop:-
As cable fallen again after faltering below resistance at 1.2918, suggesting the selloff from 1.3269 top is still in progress and bearishness remains for this move to bring at least a retracement of early upmove to 1.2812 support, then 1.2770-75, below there would extend weakness to 1.2750, however, near term oversold condition should prevent sharp fall below previous support at 1.2706, risk from there has increased for a rebound later.
In view of this, would not chase this fall here and would be prudent to sell cable on recovery as said resistance at 1.2918 should limit upside, bring another decline. Above 1.2970-80 would defer and risk a stronger rebound to 1.3000 and possibly test of resistance at 1.3032, however, only break of latter level would abort and signal the fall from 1.3269 has ended instead, bring a stronger rebound to 1.3059 and possibly towards 1.3100 but previous support at 1.3112 (now resistance) should remain intact.
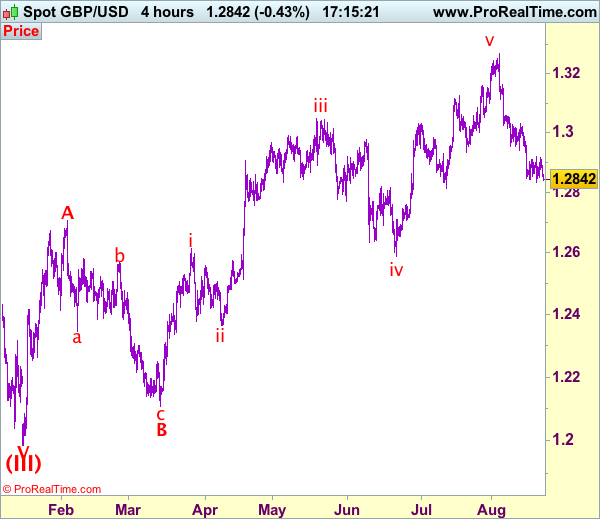
Our preferred count on the daily chart is that cable's rebound from 1.3500 (wave (A) trough) is unfolding as a wave (B) with A ended at 1.7043, followed by triangle wave B and wave C as well as wave (B) has ended at 1.7192, the subsequent selloff is the larger degree wave (C) which is still unfolding with minor wave (III) of larger degree wave 3 ended at 1.1986, hence wave (IV) correction is in progress which could either be a triangle wave (IV) of a complex formation but upside should be limited to 1.3500 and price should falter well below 1.4000, bring another decline in wave (V) of 3 for weakness to 1.1500, then 1.1200.
Foreign Exchange Market Commentary: EUR/USD, USD/JPY, GBP/USD, GOLD, WTI CRUDE, DJIA, FTSE100, DAX
EUR/USD
The EUR/USD pair surged pass 1.1800 this Monday, settling around 1.1820, its highest in five days, as speculative interest resumed dollar's selling. The pair traded uneventfully during the first half of the day, helped by a scarce macroeconomic calendar, but headlines coming from the US keep feeding risk aversion, sending US equities and bond yields sharply lower with Wall Street's opening, resulting in the greenback falling against all of its major rivals. Furthermore, the only piece of fundamental news coming from the US disappointed, as the Chicago Fed National Activity index for July, came in at -0.5%, below the previous 0.9% and the expected -0.4%. This Tuesday, attention will center on the German ZEW sentiment survey for August, expected below July's readings.
The pair has broken above a descendant trend line coming from this year high of 1.0909 set early August, currently around 1.1780, also a former static resistance, now a key support, as bulls will likely prevail as long as the price remains above it. In the 4 hours chart, the pair has surpassed all of its moving averages, with the 20 SMA gaining upward traction, but still below the 100 SMA. Technical indicators in the mentioned time frame have eased partially from near overbought readings, but given that the price remains near its highs, chances remain towards the upside. August 11th daily high at 1.1846 is the immediate resistance, with a break above it favoring additional gains up to the mentioned 1.1909 yearly high and beyond.
Support levels: 1.1780 1.1745 1.1715
Resistance levels: 1.1846 1.1880 1.1910
USD/JPY
The USD/JPY pair settled at 108.70, not far from this month low of 108.59, neither from the yearly one, set last April at 108.12. Yen's daily advance was backed by softer equities worldwide, and a down-tick in US T-yields, as risk aversion prevailed. The US and South Korea started their annual defensive military exercises this Monday, getting an infuriated response from North Korea, which once again menaced with a nuclear attack, not just on Guam, but also on Hawaii and the rest of the US territory. Japan won't release any macroeconomic reading during the upcoming Asian session, which means that sentiment will keep on leading the way, whilst movements will probably remain limited. From a technical point of view, the 4 hours chart supports additional declines ahead, as the price remains well below bearish 100 and 200 SMAs, whilst technical indicators hover within negative territory, although with limited bearish strength. Below 108.59, the low set last week, the pair has room to extend its decline down to 108.12, the mentioned yearly low.
Support levels: 108.55 108.15 107.70
Resistance levels: 109.10 109.50 109.90
GBP/USD
The British Pound benefited from dollar's weakness, with the pair surging up to 1.2915 to end the day slightly below the level. Early Monday, the UK Rightmove House Price index showed that home prices fell 0.9% in August and when compared to the previous month, the largest fall for this year. When compared to a year earlier, prices rose by 3.1%. In the meantime the UK has prepared a proposal to ensure trade in goods and services can continue after the Brexit, ahead of the third round of talks in Brussels next week, but is well-known that the EU won't discuss any trade issue before other issues, including citizens' rights and the Brexit bill, which means that little progress should be expected once again. The pair settled at the upper end of its latest range, but further gains can't be confirmed just yet, as the pair settled above a still flat 20 SMA, while technical indicators remain within neutral territory, with no certain directional strength. An upward acceleration through 1.2930 could see the pair extending up to 1.2965, but it would take a clear break above this last to confirm additional gains ahead, something quite unlikely at the time being.
Support levels: 1.2875 1.2830 1.2795
Resistance levels: 1.2930 1.2965 1.3000
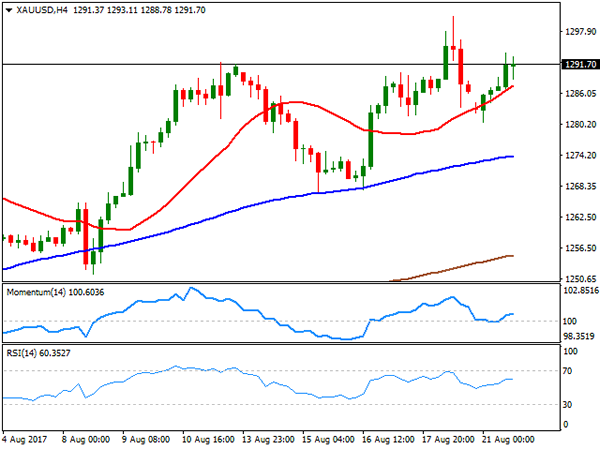
GOLD
Spot gold regained its positive momentum and settled at $1,291.60 a troy ounce, as demand for safe-haven assets returned on mounting geopolitical tensions between North Korea and the US, and persistent uncertainty about Washington's agenda. US Treasury Secretary Steven Mnuchin and Senate Majority Leader Mitch McConnell made a joint appearance at CNBC in the US afternoon, trying to pour some cold water on the latest, talking about looking forward to working alongside with the Congress on the tax reform and on rising the debt limit. Gold, however, retains its bullish stance according to the daily chart, as the price is well above a bullish 20 DMA that stands far above the larger ones, whilst technical indicators resumed their advances within positive territory. Shorter term, and according to the 4 hours chart, the price managed to hold above a modestly bullish 20 SMA that attracted selling interest on intraday declines, while technical indicators lost upward momentum within positive territory, rather reflecting the limited volume at the end of the day than suggesting upward exhaustion.
Support levels: 1,281.65 1,273.95 1,261.20
Resistance levels: 1,292.10 1,300.90 1,309.25
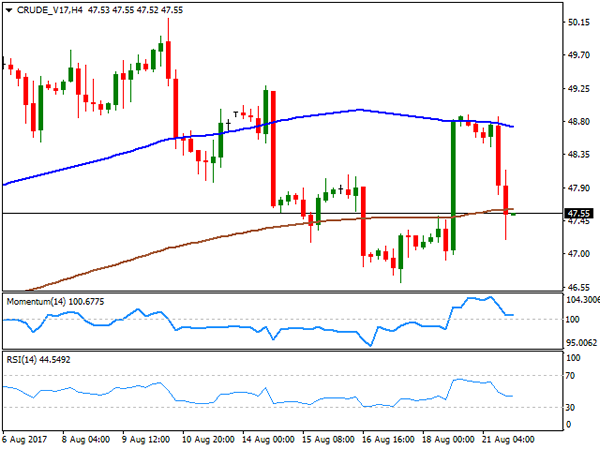
WTI CRUDE OIL
Crude oil prices edged sharply lower on Monday, weighed by estimates showing that the OPEC's compliance to the output cut agreement fell to its lowest this year, and stood around 75% in July according to the international Energy Agency's latest monthly report. The cartel is holding a meeting with non-OPEC producers in Vienna to discuss compliance levels. West Texas Intermediate crude futures ended the day around $47.54 a barrel, after trading as high as 48.86 at the beginning of the day. The daily chart shows that the benchmark settled right above its 100 DMA, whilst technical indicators retreated from their mid-lines, now heading lower within bearish territory, supporting a new leg lower ahead particularly on a break below the daily low of 47.20. Shorter term, and according to the 4 hours chart, the technical picture is neutral-to-bearish, as WTI settled below its 100 and 200 SMAs, while the Momentum indicator turned flat around its 100 level and the RSI within bearish territory, now at 44.
Support levels: 47.20 46.60 45.90
Resistance levels: 48.10 48.80 49.50
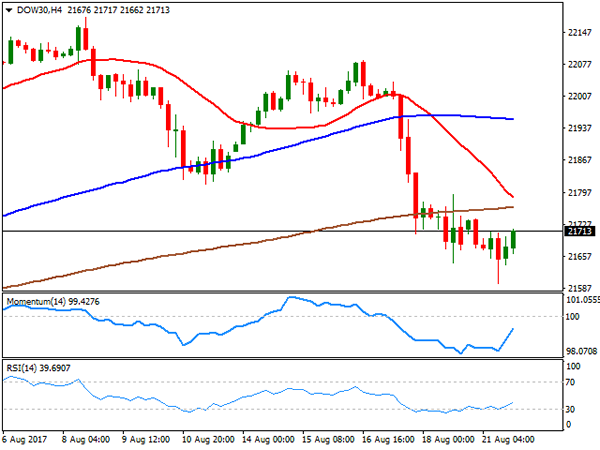
DJIA
US indexes closed mixed after a soft start to the day, but not far from their daily openings, as political uncertainty within the US kept risk aversion as the main market motor. The Nasdaq Composite closed in the red at 6,213.13, down by 3 points, while the DJIA managed to add 29 points, to end at 21,703.75 and the S&P added 0.12%, to 2,428.37. Within the Dow, Nike was the worst performer, ending the day 2.38% lower, followed by Goldman Sachs that shed 0.70%. Home Depot on the other hand led advancers, gaining 1.19%, followed by Cisco Systems that gained 1.07%. The daily chart for the Dow shows that the index posted an intraday low of 21,597, its lowest in almost a month, holding well below its 20 DMA, despite the late recovery and with technical indicators maintaining their bearish slopes near oversold readings, in line with further slides ahead. In the shorter term, and according to the 4 hours chart, technical indicators have recovered from oversold levels, but remain within bearish territory, as the index remains below all of its moving averages, and with the 20 SMA aiming to cross below the 200 SMA, this last around 21,765, offering a strong dynamic resistance.
Support levels: 21,642 21,603 21,566
Resistance levels: 21,765 21,792 21,840
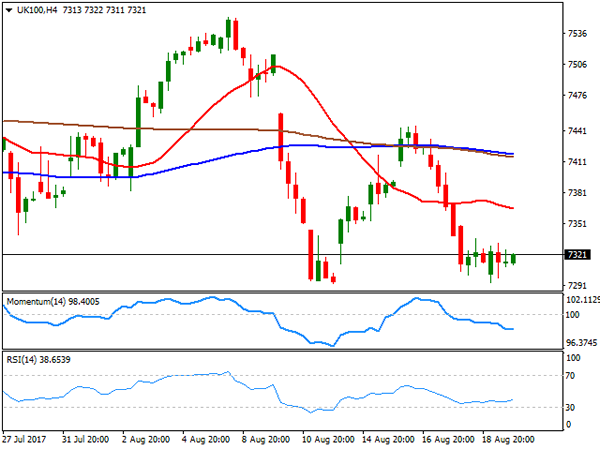
FTSE100
The FTSE 100 closed the day at 7,318.88, down by 5 points or 0.07%, as risk aversion dominated equities across all Europe. A sharp decline in financial-related equities was offset by an advance in mining-related ones, backed by an advance in gold prices. Insurer Provident Financial was the worst performer, down 5.78% followed by the pharmaceutical giant Shire that shed 4.02% after its chief financial officer quit. On the winning side, Micro Focus led advancers with a 3.17% gain, followed by Pearson that added 2.31%. The London benchmark maintains the negative tone seen on previous updates, as in the daily chart, it held at the lower end of last week's range, and well below its moving averages, whilst technical indicators keep heading south within negative territory. In the 4 hours chart, the index also presents a bearish stance, holding well below all of its moving averages, and with the RSI indicator hovering around 38 while the Momentum indicator heads marginally lower well below its mid-line.
Support levels: 7,293 7,257 7,218
Resistance levels: 7,337 7,369 7,401
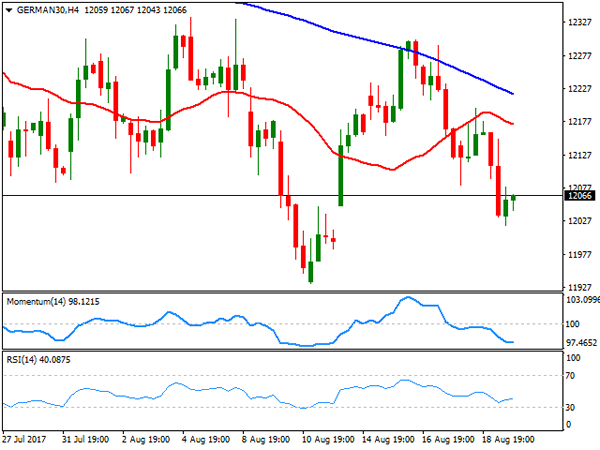
DAX
The German DAX closed the day at 12,065.99, down 98 points or 0.82%, as European indexes were weighed by financial and banks' shares and following Wall Street's Friday sour tone, also hit by arising geopolitical tensions between the US and North Korea. Within the DAX, only Deutsche Lufthansa closed with gains, up 1.01, while leading decliners was ThyssenKrupp, down 2.99%, followed by Deutsche Bank that shed 2.48%. The index is bearish according to the daily chart, as it was again rejected by a bearish 20 SMA, whilst technical indicators failed to enter positive territory, and turned south, now presenting an increasing bearish momentum. In the 4 hours chart, the index is well below all of its moving averages that present bearish slopes, whilst technical indicators stabilized near oversold readings, also favoring a new leg lower for this Tuesday.
Support levels: 12,020 11,985 11,939
Resistance levels: 12,091 12,126 12,263