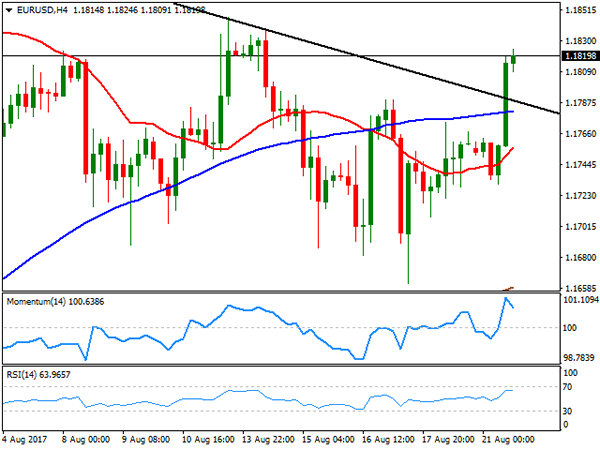
EUR/USD
The EUR/USD pair surged pass 1.1800 this Monday, settling around 1.1820, its highest in five days, as speculative interest resumed dollar’s selling. The pair traded uneventfully during the first half of the day, helped by a scarce macroeconomic calendar, but headlines coming from the US keep feeding risk aversion, sending US equities and bond yields sharply lower with Wall Street’s opening, resulting in the greenback falling against all of its major rivals. Furthermore, the only piece of fundamental news coming from the US disappointed, as the Chicago Fed National Activity index for July, came in at -0.5%, below the previous 0.9% and the expected -0.4%. This Tuesday, attention will center on the German ZEW sentiment survey for August, expected below July’s readings.
The pair has broken above a descendant trend line coming from this year high of 1.0909 set early August, currently around 1.1780, also a former static resistance, now a key support, as bulls will likely prevail as long as the price remains above it. In the 4 hours chart, the pair has surpassed all of its moving averages, with the 20 SMA gaining upward traction, but still below the 100 SMA. Technical indicators in the mentioned time frame have eased partially from near overbought readings, but given that the price remains near its highs, chances remain towards the upside. August 11th daily high at 1.1846 is the immediate resistance, with a break above it favoring additional gains up to the mentioned 1.1909 yearly high and beyond.
Support levels: 1.1780 1.1745 1.1715
Resistance levels: 1.1846 1.1880 1.1910
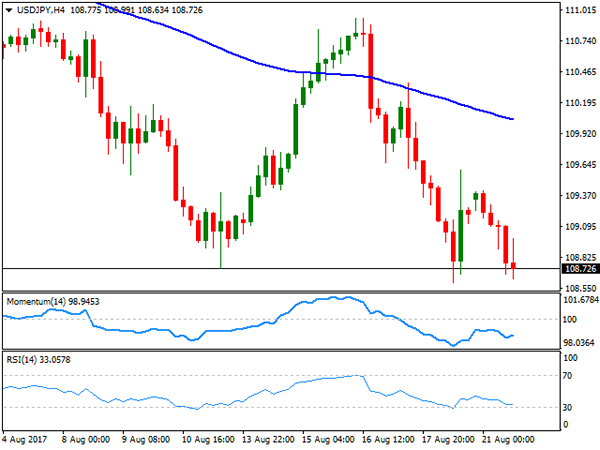
USD/JPY
The USD/JPY pair settled at 108.70, not far from this month low of 108.59, neither from the yearly one, set last April at 108.12. Yen’s daily advance was backed by softer equities worldwide, and a down-tick in US T-yields, as risk aversion prevailed. The US and South Korea started their annual defensive military exercises this Monday, getting an infuriated response from North Korea, which once again menaced with a nuclear attack, not just on Guam, but also on Hawaii and the rest of the US territory. Japan won’t release any macroeconomic reading during the upcoming Asian session, which means that sentiment will keep on leading the way, whilst movements will probably remain limited. From a technical point of view, the 4 hours chart supports additional declines ahead, as the price remains well below bearish 100 and 200 SMAs, whilst technical indicators hover within negative territory, although with limited bearish strength. Below 108.59, the low set last week, the pair has room to extend its decline down to 108.12, the mentioned yearly low.
Support levels: 108.55 108.15 107.70
Resistance levels: 109.10 109.50 109.90
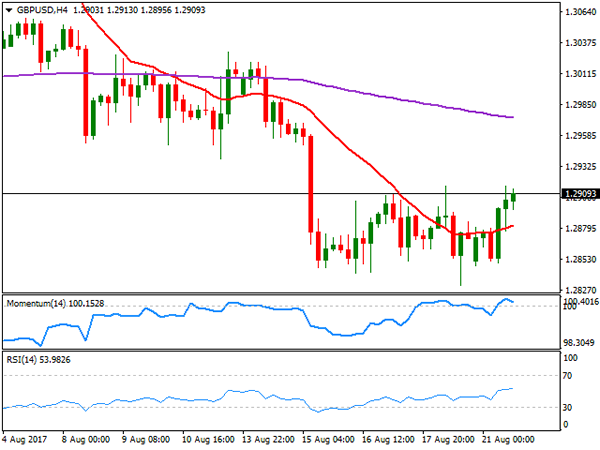
GBP/USD
The British Pound benefited from dollar’s weakness, with the pair surging up to 1.2915 to end the day slightly below the level. Early Monday, the UK Rightmove House Price index showed that home prices fell 0.9% in August and when compared to the previous month, the largest fall for this year. When compared to a year earlier, prices rose by 3.1%. In the meantime the UK has prepared a proposal to ensure trade in goods and services can continue after the Brexit, ahead of the third round of talks in Brussels next week, but is well-known that the EU won’t discuss any trade issue before other issues, including citizens’ rights and the Brexit bill, which means that little progress should be expected once again. The pair settled at the upper end of its latest range, but further gains can’t be confirmed just yet, as the pair settled above a still flat 20 SMA, while technical indicators remain within neutral territory, with no certain directional strength. An upward acceleration through 1.2930 could see the pair extending up to 1.2965, but it would take a clear break above this last to confirm additional gains ahead, something quite unlikely at the time being.
Support levels: 1.2875 1.2830 1.2795
Resistance levels: 1.2930 1.2965 1.3000
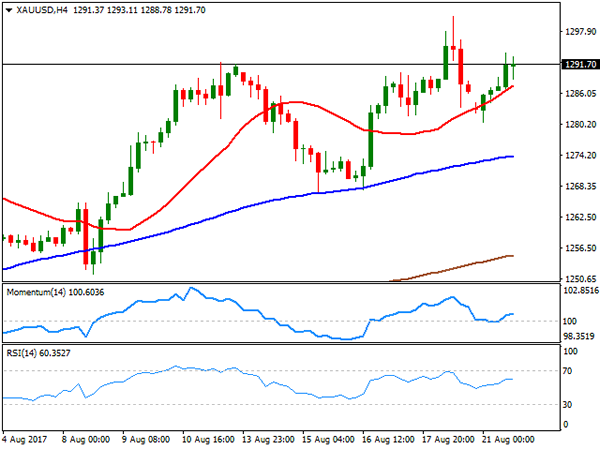
GOLD
Spot gold regained its positive momentum and settled at $1,291.60 a troy ounce, as demand for safe-haven assets returned on mounting geopolitical tensions between North Korea and the US, and persistent uncertainty about Washington’s agenda. US Treasury Secretary Steven Mnuchin and Senate Majority Leader Mitch McConnell made a joint appearance at CNBC in the US afternoon, trying to pour some cold water on the latest, talking about looking forward to working alongside with the Congress on the tax reform and on rising the debt limit. Gold, however, retains its bullish stance according to the daily chart, as the price is well above a bullish 20 DMA that stands far above the larger ones, whilst technical indicators resumed their advances within positive territory. Shorter term, and according to the 4 hours chart, the price managed to hold above a modestly bullish 20 SMA that attracted selling interest on intraday declines, while technical indicators lost upward momentum within positive territory, rather reflecting the limited volume at the end of the day than suggesting upward exhaustion.
Support levels: 1,281.65 1,273.95 1,261.20
Resistance levels: 1,292.10 1,300.90 1,309.25
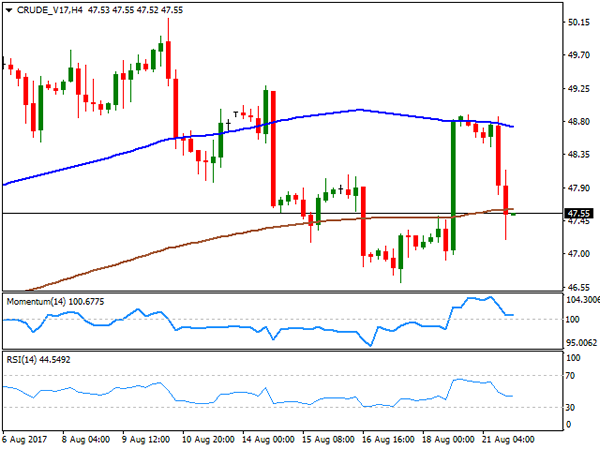
WTI CRUDE OIL
Crude oil prices edged sharply lower on Monday, weighed by estimates showing that the OPEC’s compliance to the output cut agreement fell to its lowest this year, and stood around 75% in July according to the international Energy Agency’s latest monthly report. The cartel is holding a meeting with non-OPEC producers in Vienna to discuss compliance levels. West Texas Intermediate crude futures ended the day around $47.54 a barrel, after trading as high as 48.86 at the beginning of the day. The daily chart shows that the benchmark settled right above its 100 DMA, whilst technical indicators retreated from their mid-lines, now heading lower within bearish territory, supporting a new leg lower ahead particularly on a break below the daily low of 47.20. Shorter term, and according to the 4 hours chart, the technical picture is neutral-to-bearish, as WTI settled below its 100 and 200 SMAs, while the Momentum indicator turned flat around its 100 level and the RSI within bearish territory, now at 44.
Support levels: 47.20 46.60 45.90
Resistance levels: 48.10 48.80 49.50
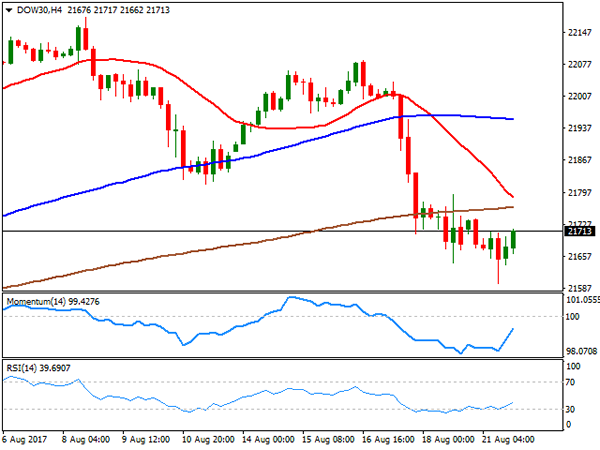
DJIA
US indexes closed mixed after a soft start to the day, but not far from their daily openings, as political uncertainty within the US kept risk aversion as the main market motor. The Nasdaq Composite closed in the red at 6,213.13, down by 3 points, while the DJIA managed to add 29 points, to end at 21,703.75 and the S&P added 0.12%, to 2,428.37. Within the Dow, Nike was the worst performer, ending the day 2.38% lower, followed by Goldman Sachs that shed 0.70%. Home Depot on the other hand led advancers, gaining 1.19%, followed by Cisco Systems that gained 1.07%. The daily chart for the Dow shows that the index posted an intraday low of 21,597, its lowest in almost a month, holding well below its 20 DMA, despite the late recovery and with technical indicators maintaining their bearish slopes near oversold readings, in line with further slides ahead. In the shorter term, and according to the 4 hours chart, technical indicators have recovered from oversold levels, but remain within bearish territory, as the index remains below all of its moving averages, and with the 20 SMA aiming to cross below the 200 SMA, this last around 21,765, offering a strong dynamic resistance.
Support levels: 21,642 21,603 21,566
Resistance levels: 21,765 21,792 21,840
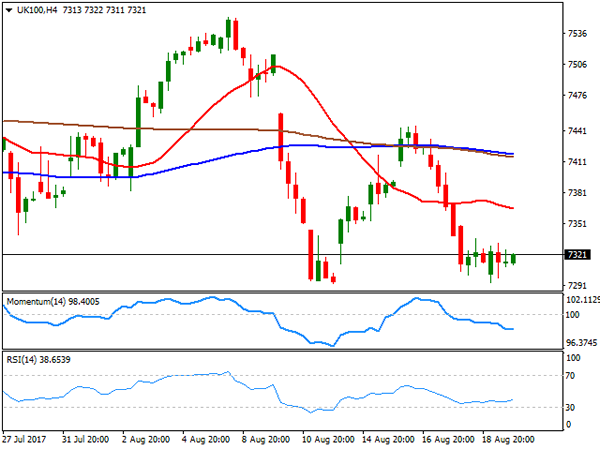
FTSE100
The FTSE 100 closed the day at 7,318.88, down by 5 points or 0.07%, as risk aversion dominated equities across all Europe. A sharp decline in financial-related equities was offset by an advance in mining-related ones, backed by an advance in gold prices. Insurer Provident Financial was the worst performer, down 5.78% followed by the pharmaceutical giant Shire that shed 4.02% after its chief financial officer quit. On the winning side, Micro Focus led advancers with a 3.17% gain, followed by Pearson that added 2.31%. The London benchmark maintains the negative tone seen on previous updates, as in the daily chart, it held at the lower end of last week’s range, and well below its moving averages, whilst technical indicators keep heading south within negative territory. In the 4 hours chart, the index also presents a bearish stance, holding well below all of its moving averages, and with the RSI indicator hovering around 38 while the Momentum indicator heads marginally lower well below its mid-line.
Support levels: 7,293 7,257 7,218
Resistance levels: 7,337 7,369 7,401
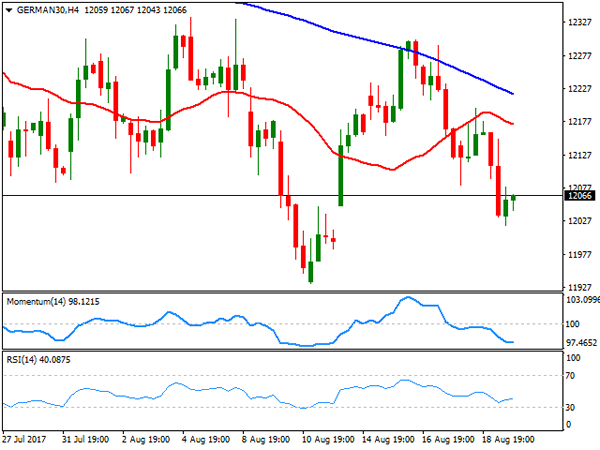
DAX
The German DAX closed the day at 12,065.99, down 98 points or 0.82%, as European indexes were weighed by financial and banks’ shares and following Wall Street’s Friday sour tone, also hit by arising geopolitical tensions between the US and North Korea. Within the DAX, only Deutsche Lufthansa closed with gains, up 1.01, while leading decliners was ThyssenKrupp, down 2.99%, followed by Deutsche Bank that shed 2.48%. The index is bearish according to the daily chart, as it was again rejected by a bearish 20 SMA, whilst technical indicators failed to enter positive territory, and turned south, now presenting an increasing bearish momentum. In the 4 hours chart, the index is well below all of its moving averages that present bearish slopes, whilst technical indicators stabilized near oversold readings, also favoring a new leg lower for this Tuesday.
Support levels: 12,020 11,985 11,939
Resistance levels: 12,091 12,126 12,263