Sample Category Title
EUR/JPY Daily Outlook
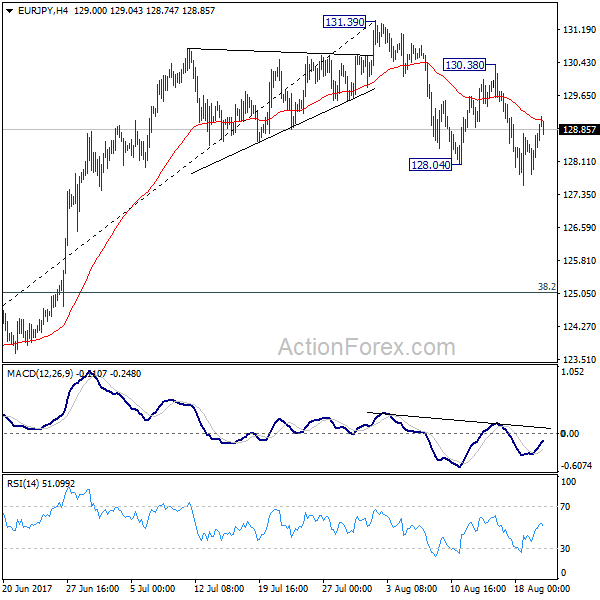
Daily Pivots: (S1) 128.11; (P) 128.44; (R1) 129.06; More...
No change in EUR/JPY's outlook as fall from 131.39 is still in progress. Such decline is seen as correcting whole rise from 141.84 with break of channel support. Deeper decline would be seen to 38.2% retracement of 114.84 to 131.39 at 125.05 before completion. On the upside, break of 130.38 resistance is needed to confirm completion of the pull back. Otherwise, deeper decline is expected even in case of recovery.
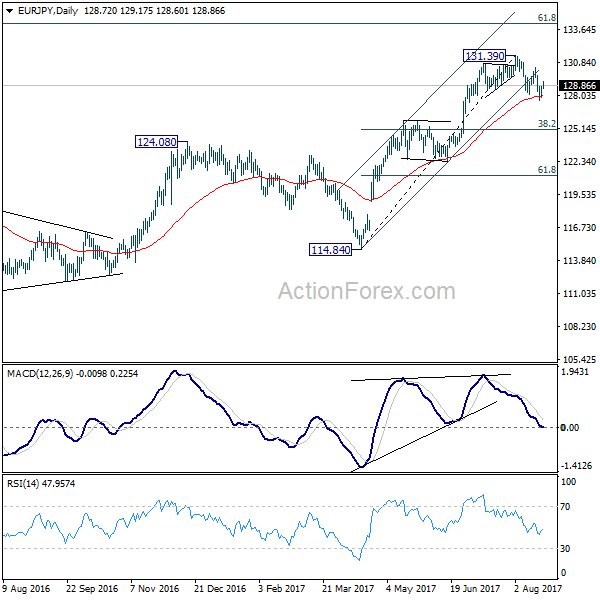
In the bigger picture, the down trend from 149.76 (2014 high) is completed at 109.03 (2016 low). Current rally from 109.03 should be at the same degree as the fall from 149.76 to 109.03. Further rise is expected to 61.8% retracement of 149.76 to 109.03 at 134.20. Sustained break there will pave the way to key long term resistance zone at 141.04/149.76. Medium term outlook will remain bullish as long as 124.08 resistance turned support holds. However, firm break of 124.08 will argue that rise from 109.03 is completed and turn outlook bearish.
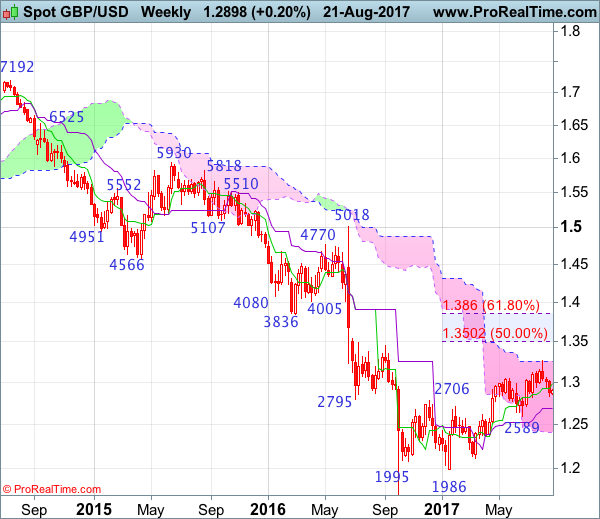
GBP/USD Candlesticks and Ichimoku Analysis
Weekly
• Last Candlesticks pattern: Long white candlestick
• Time of formation: 16 Jan 2017
• Trend bias: Down
Daily
• Last Candlesticks pattern: Long white candlestick
• Time of formation: 18 Apr 2017
• Trend bias: Near term up
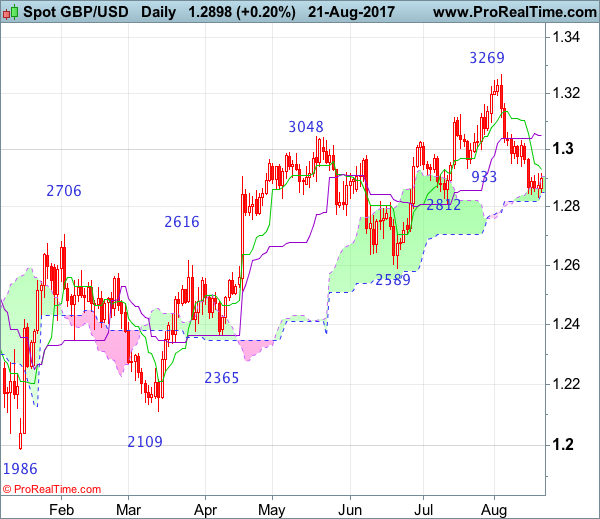
GBP/USD – 1.2857
Cable has remained under pressure after recent selloff below indicated support at 1.2933, adding credence to our view that a temporary top has been formed earlier at 1.3269 and further consolidation below this level would take place with mild downside bias for at least a strong retracement of recent upmove to support at 1.2812, then 1.2775-80 (38.2% Fibonacci retracement of 1.1986-1.3269), however, near term oversold condition should prevent sharp fall below 1.2700 and reckon 1.2620-30 (50% Fibonacci retracement) would hold from here and price should stay above previous chart support at 1.2589.
On the upside, whilst initial recovery to 1.2932-33 (current level of the Tenkan-Sen and previous support turned resistance) cannot be ruled out, reckon upside would be limited to 1.2970-80 and resistance at 1.3032 should remain intact, bring another decline later. A daily close above said resistance at 1.3032 would would defer and suggest first leg of decline from 1.3269 has ended instead, risk a stronger rebound to 1.3100 and then 1.3150 but still reckon upside would be limited to 1.3200, bring another leg of corrective decline later. A daily close above 1.3200 would risk another test of said resistance at 1.3269 but break there is needed to confirm recent upmove has resumed and extend gain to 1.3300-10, having said that, loss of upward momentum should prevent sharp move beyond resistance at 1.3425 and price should falter well below 1.3500-05 (50% Fibonacci retracement of 1.5018-1.1986).
Recommendation: Sell at 1.3050 for 1.2850 with stop above 1.3150.
On the weekly chart, cable’s retreat from 1.3269 (with a shooting star) has kept price under pressure, adding credence to our view that a temporary top is possibly formed there and consolidation with mild downside bias is seen for test of 1.2812 support, break there would extend weakness to 1.2775-80 (38.2% Fibonacci retracement of 1.1986-1.3269), then towards 1.2705-10, however, reckon downside would be limited to the Kijun-Sen (now at 1.2689) and previous support at 1.2589 should hold from here. Looking ahead, only a sustained breach below 1.2589 would signal the entire correction from 1.1986 has ended at 1.3269, bring further decline to 1.2500, then towards support at 1.2365.
On the upside, expect recovery to be limited to 1.2930-40 and 1.2980 should hold, bring another decline. Above 1.3032 would defer and suggest the retreat from 1.3269 has ended, risk a strong rebound to 1.3100 but upside should be capped at resistance at 1.3165, bring another decline. Break of 1.3165 resistance would defer and risk retest of 1.3269 but only break there would shift risk back to upside and extend the erratic rise from 1.1986 low for retracement of early downtrend to 1.3300-10 and 1.3350-60, however, upside should be limited to previous resistance at 1.3425 and reckon 1.3500-05 (50% Fibonacci retracement of 1.5018-1.1986) would hold, price should falter below 1.3670-75, bring another decline in Q4.
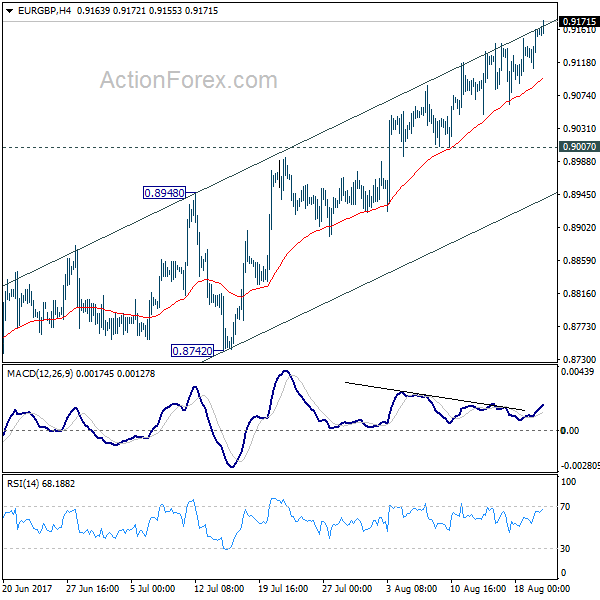
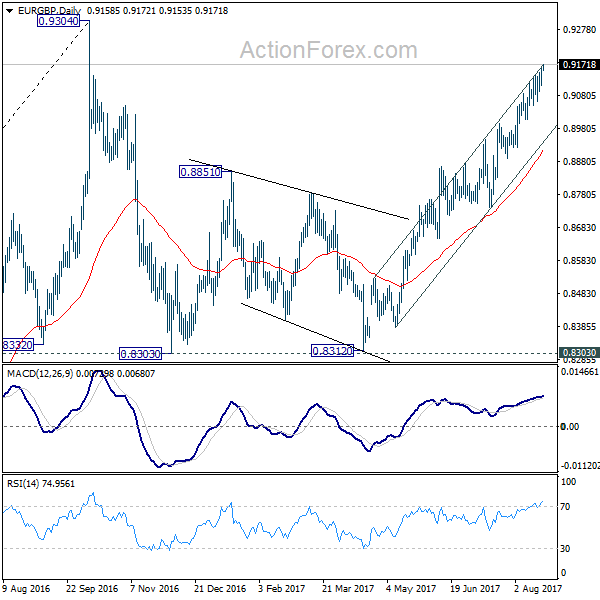
EUR/GBP Daily Outlook
Daily Pivots: (S1) 0.9126; (P) 0.9144; (R1) 0.9176; More
No change in EUR/GBP's outlook and current rise is in progress for 0.9304 high. At this point, there is no clear sign of up trend resumption yet. Hence, we'll be cautious on strong resistance from 0.9304 to limit upside and bring another fall. On the downside, break of 0.9007 support will indicate short term topping. Intraday bias will then be turned back to the downside for 0.8742/8948 support zone.
In the bigger picture, price actions from 0.9304 are viewed as a medium term corrective pattern. It's uncertain whether it is finished yet. But in case of another fall, we'd expect strong support from 0.8116 cluster support (50% retracement of 0.6935 to 0.9304 at 0.8120) to contain downside and bring rebound. Whole up trend from 0.6935 is expected to resume after consolidation from 0.9304 completes.
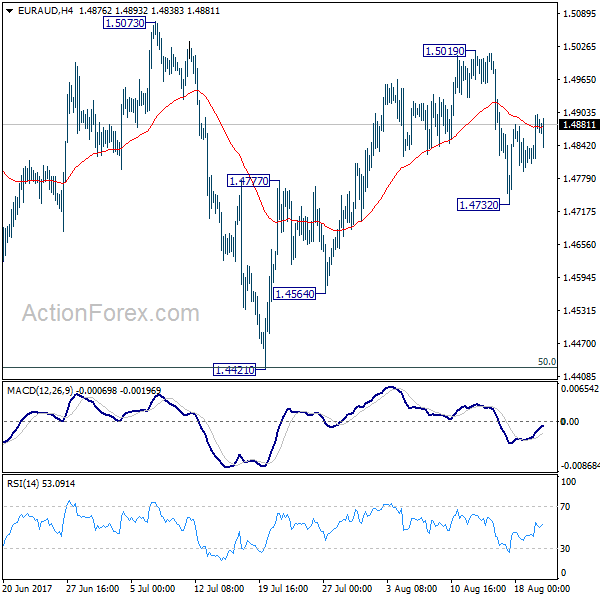
EUR/AUD Daily Outlook
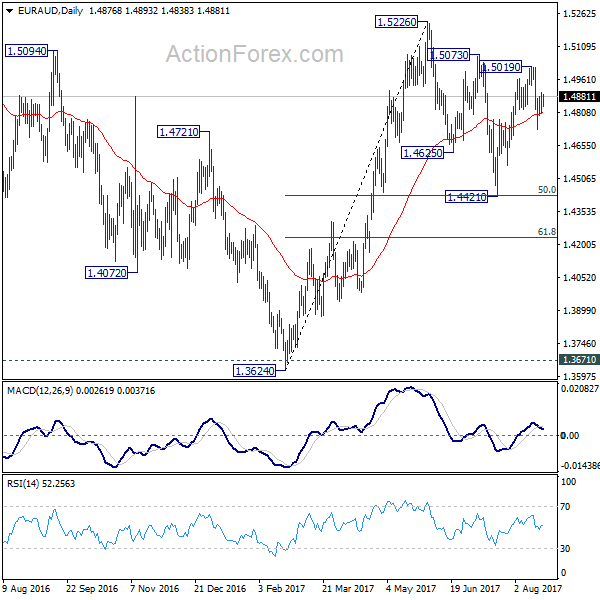
Daily Pivots: (S1) 1.4824; (P) 1.4862; (R1) 1.4915; More...
Intraday bias in EUR/AUD remains neutral for the moment. Consolidation pattern from 1.5226 is possibly still in progress. Below 1.4732 will bring another fall. But we'd expect 1.4421 cluster support (50% retracement of 1.3624 to 1.5226 at 1.4427) to hold and bring rebound. On the upside, above 1.5019 will target a test on 1.5226 high instead.
In the bigger picture, we're holding on to the view that corrective decline from 1.6587 medium term has completed at 1.3624. Rise from 1.3624 is expected to extend to retest 1.6587. The corrective structure of the fall from 1.5226 is affirming this view. Above 1.5226 will target a test on 1.6587 key resistance. However, break of 1.4421 will dampen our view and would drag EUR/AUD lower to retest key support zone around 1.3624.
Technical Outlook: Cable – Fresh Weakness Pressures Daily Cloud Base
Cable was lower in Asian session after daily cloud top capped upside attempts and fresh strength of the US dollar increased pressure on Sterling. Fresh weakness is eyeing key supports at 1.2851/48 (daily cloud base/Fibo 61.8% of 1.2588/1.3268 rally), break of which is expected to generate stronger bearish signal for resumption of broader downtrend from 1.3268 (03 Aug peak) which has been paused for 1.2917/1.2831 consolidation in recent days.
Res: 1.2877, 1.2908, 1.2917, 1.2928
Sup: 1.2850, 1.2831, 1.2811, 1.2749
EUR/CHF Daily Outlook
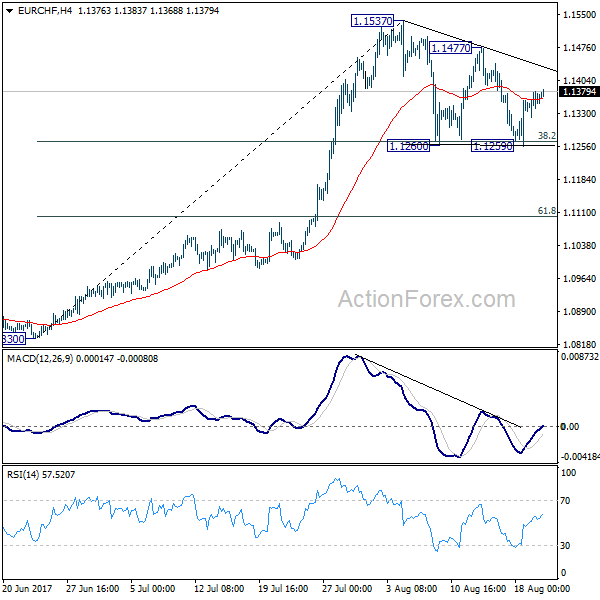
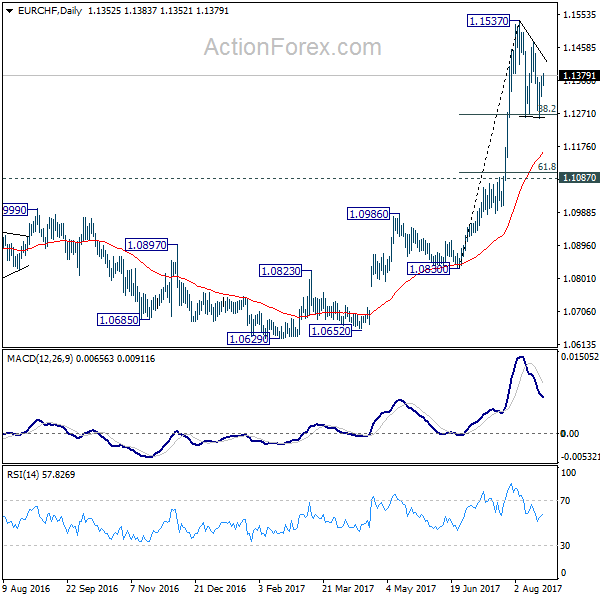
Daily Pivots: (S1) 1.1330; (P) 1.1354; (R1) 1.1387; More...
EUR/CHF is staying in consolidation pattern from 1.1537 and intraday bias remains neutral. On the upside, break of 1.1477 resistance will argue that the consolidation from 1.1537 has completed and larger rise is resuming. However, firm break of 38.2% retracement of 1.0830 to 1.1537 at 1.1267 will extend the correction to 61.8% retracement at 1.1100 before completion.
In the bigger picture, firm break of 1.1198 key resistance confirms resumption of the long term rise from SNB spike low back in 2015. In this case, EUR/CHF would eventually head back to prior SNB imposed floor at 1.2000. For now, this will be the favored case as long as 1.1087 resistance turned support holds.
USD/CHF Candlesticks and Ichimoku Analysis
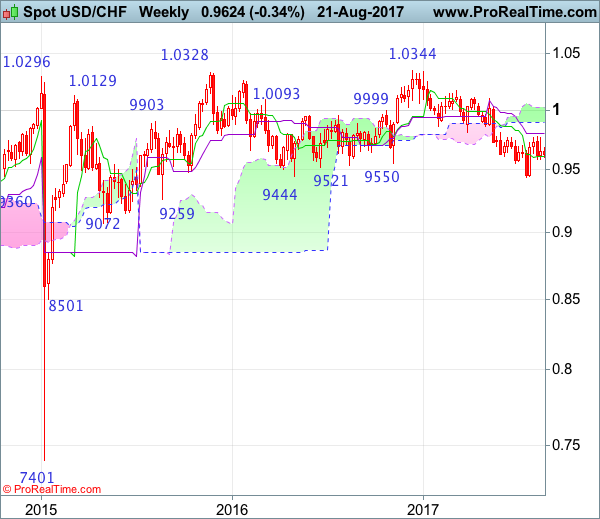
Weekly
• Last Candlesticks pattern: Shooting star
• Time of formation: 7 Mar 2017
• Trend bias: Sideways
Daily
• Last Candlesticks pattern: Morning star
• Time of formation: 9 May 2017
• Trend bias: Near term up
USD/CHF – 0.9650
Despite last week’s initial rise to 0.9766, as the greenback has retreated again after faltering below recent high at 0.9773, suggesting the rise from 0.9438 low is not ready to resume yet and further consolidation would be seen, hence weakness to 0.9583 support cannot be ruled out, however, if our view that low has been formed at 0.9438 is correct, downside should be limited to 0.9540-50 and bring another rebound later. Above 0.9700 would bring another test of 0.9773 but only break there would revive bullishness and extend the rise form 0.9438 low to resistance at 0.9808. Looking ahead, a break above this level is needed to retain bullishness and encourage for subsequent rise to 0.9845-50 (61.8% Fibonacci retracement of 1.0100-0.9438).
On the downside, whilst initial pullback to 0.9583 cannot be ruled out, reckon downside would be limited to 0.9540-50 and bring another rebound later. Only a daily close below support at 0.9490 would abort and signal the rebound from 0.9438 has ended instead, risk retest of this level, once this support is penetrated, this would indicate recent decline from 1.0344 (2016 high) has resumed and extend weakness to 0.9390-00, then towards 0.9330-40.
Recommendation: Long entered at 0.9600 stopped profit at 0.9640 and would stand aside for this week.

On the weekly chart, dollar’s retreat after faltering below resistance at 0.9773 formed a candlestick with a long upper shadow, suggesting further consolidation below 0.9773 would be seen and although weakness to 0.9583 and possibly 0.9540-50 cannot be ruled out, as long as said support at 0.9438 holds, prospect of another rebound remains, above 0.9773 resistance would add credence to our view that a temporary low is possibly formed at 0.9438 last month, bring retracement of recent selloff to 0.9805-08 (current level of the Kijun-Sen and previous resistance), above there would provide confirmation, bring subsequent gain to 0.9845-50 (61.8% Fibonacci retracement of 1.0100-0.9438) and possibly test of the lower Kumo (now at 0.9894) but price should falter below psychological resistance at 1.0000, bring another decline later.
On the downside, expect pullback to be limited to 0.9583 and 0.9540-50 should attract buying interest, bring another rise later. Only a drop below support at 0.9490 would abort and suggest the rebound from 0.9438 has ended, bring retest of this level later. Once this recent low is penetrated, this would signal the decline from 1.0344 (2016 high) is still in progress and may extend weakness to 0.9350, then towards 0.9290-00, however, loss of near term downward momentum should prevent sharp fall below 0.9250 and reckon 0.9200-10 would hold from here, risk from there has increased for a rebound later.
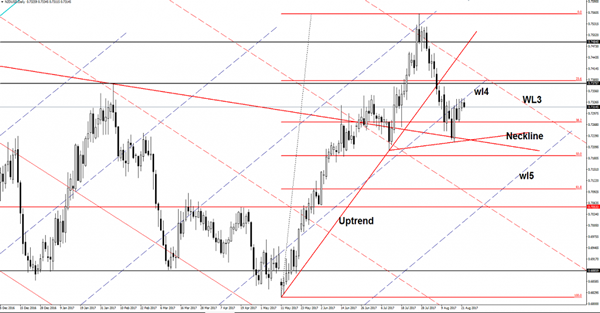
NZD/USD Head And Shoulders?
Price drops right now after the retest of the fourth warning line (wl4) of the former ascending pitchfork. Technically is expected to drop on the short term, at least till will hit the 38.2% retracement level. NZD/USD is developing a Head and Shoulders pattern on the Daily chart, will be confirmed after a valid breakdown below the Neckline (red line).
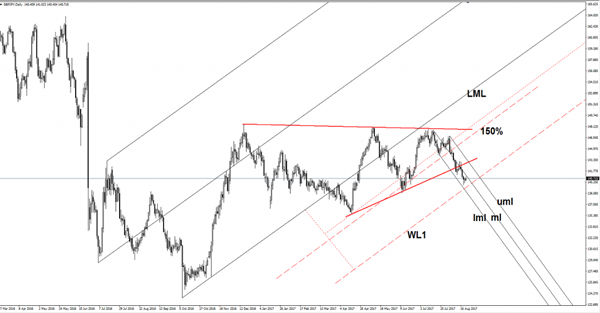
GBP/JPY Downside Paused
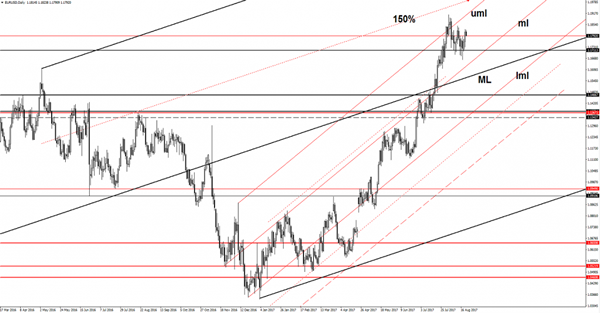
Price increased a little and is trying to retest the median line (ml) of the minor descending pitchfork. The next downside target remains at the first warning line (WL1) of the major ascending pitchfork. Only a failure to retest this level will signal a rebound towards the 150% Fibonacci line (ascending dotted line). However, a breakdown will confirm a major drop, but is premature to say what will happen because Nikkei has opened with a gap up in the morning and is fighting hard to recover after the yesterday’s massive drop.
EUR/USD Changed Little
The EUR/USD has decreased a little in the morning as the USDX has managed to rebound. The currency pair maintains a bullish perspective on the daily chart, but we may have a minor consolidation before will resume the upside movement. Needs to recapture more directional energy to be able to climb above the 1.1909 previous high.
USD has dragged the pair lower, but this could be only temporary as the dollar index is expected to drop deeper on the short term. The USDX stays above the 93.00 psychological level above the 92.94 previous low, a drop towards the 92.55 swing low is possible if will close below these levels.
The German ZEW Economic Sentiment will be released later and is forecasted to decrease from 17.5 to 14.8 points, while the Euro-zone ZEW Economic Sentiment could decrease from 35.6 to 34.2 points. On the other hand, is to release the HPI and the Richmond Manufacturing Index in the afternoon.
Price decreased a little, but is somehow expected to resume the upside movement. Has found strong support at the 1.1712 downside obstacle and now could move in range before will start another significant move. Only a failure to close above the 1.1909 will signal an exhaustion and a potential reversal on the short term. However, a retest of the median line (ml) will signal a further increase in the upcoming period, the next major upside target will be at the 1.2037 level.