
Sample Category Title
USDCAD Extends Bearish Run, Falls To 2-Week Low
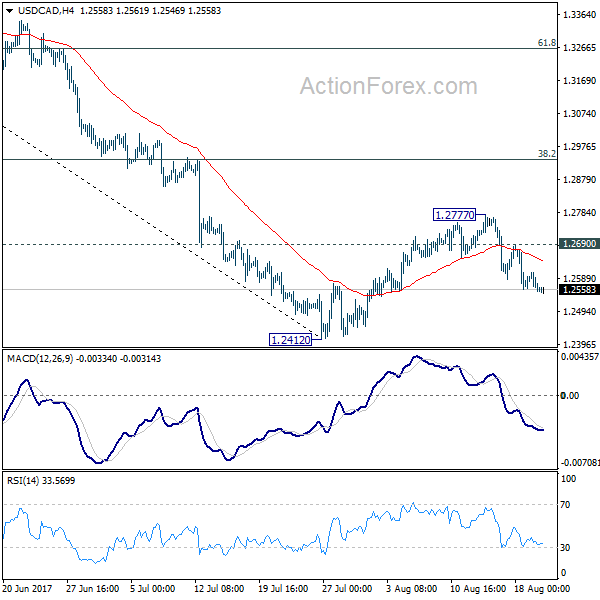
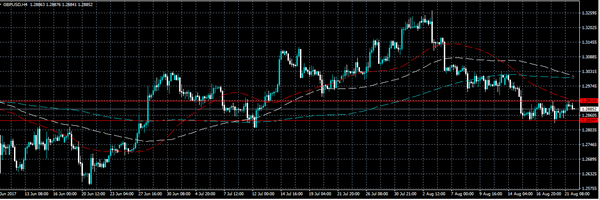
USDCAD is showing little sign of ending the current bearish run that began on August 15, with the pair hitting a 2-week low of 1.2546 earlier today. This low is just below the 61.8% Fibonacci retracement level of the July-August uptrend from 1.2413 to 1.2777.
Technical indicators remain in bearish area with the MACD deep below zero and still declining. However, the stochastics are in oversold territory and the %D line is attempting to cross above the %K line, suggesting a possible easing of the downside momentum.
Should we see an upside push, resistance will likely come from the 50% Fibonacci retracement level of 1.2595, followed by the 38.2% Fibonacci level at 1.2638. Further up, the 200- and 50-period moving averages (currently at 1.2655 and 1.2668, respectively) could stand in the way of prices reaching the 23.6% Fibonacci level at 1.2690.
If the pair fails to hold above the 61.8% Fibonacci support level of 1.2552, further losses would lead the way towards the 78.6% Fibonacci level of 1.2491. A break below this mark would clear the way to July’s 2-year trough of 1.2413. A breach of this low would signal a resumption of the longer-run downtrend that began in May and reinforce the bearish outlook in the medium term.
GBPUSD Risk Remains To The Downside, Neutral Phase In Near-Term
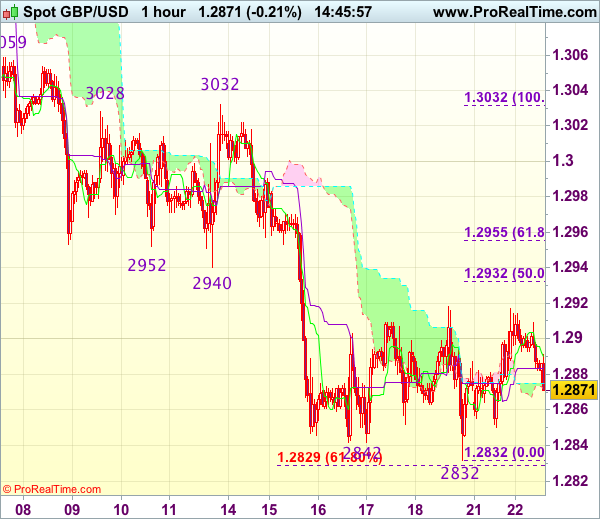
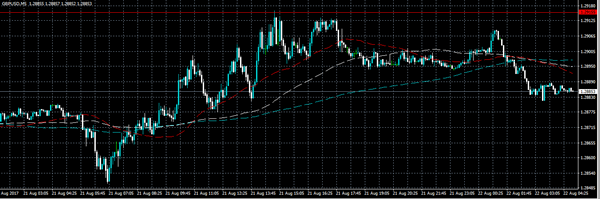
GBPUSD has been trading sideways since breaking below its 50-day moving average last week. The shift to a more neutral stance follows a prior range that was capped at the key 1.3000 level after a decline from the multi-month high of 1.3267 reached on August 3.
The pair has been trading between two important Fibonacci retracement levels of the rise from 1.2588 to 1.3267. The 50% Fibonacci at 1.2927 is capping the top of the range while the 61.8% Fibonacci is providing support at 1.2845.
Only a break of 1.2927 (50% Fibonacci) and a rise above the 50-day MA would ease downside pressure to target 1.3000. This is a strong resistance level and a break of this would shift the focus back to the upside for a re-test of 1.3267.
The near-term bias is expected to remain neutral with further range trading as RSI is moving sideways. But since the indicator is below 50 in bearish territory and MACD is falling, another leg lower cannot be ruled out yet. A break below the 5-week low touched last Friday at 1.2831 would increase downside momentum with scope to test the key 1.2800 level ahead of 1.2720. From here the 200-day MA and 1.2588 low come into view as potential targets.
The overall risk remains to the downside and the bearish move from 1.3267 is still intact.
Dollar Firms Up In Humdrum Market, Oil Rises On Tightening US Supply
In an uneventful trading during the Asian session due to the absence of any economic data releases, the dollar edged up. The dollar index, which measures the greenback's value against a basket of six major currencies inched up 0.12% to last trade at 93.21. Oil prices rose amid indications that supply is tightening.
Looking at reactions in the forex market, the dollar strengthened against most majors. Euro/dollar fell just below the $1.18 mark to last trade at $1.1795. The pound weakened and was trading at $1.2872 ahead of the European open. The greenback strengthened against the yen with the pair trading at 109.29 yen, erasing all of its yesterday's losses. This signals that geopolitical anxiety has temporarily eased and market participants are now fully focused on the events in the second part of the week.
European Central Bank President Mario Draghi is due to speak on Wednesday in Germany and will join Federal Reserve Chair Janet Yellen in the Fed's conference starting on Thursday. While many news reports have warned the markets that the two central bankers will likely not reveal anything new about their respective monetary policy outlooks, traders will still be focused on their speeches for any potential clues.
In a relatively quiet trading week, some of the key data releases that are expected later in the day include the German ZEW economic sentiment index, CBI industrial orders for the UK and monthly core retail sales in Canada. The Vice-President of ECB's Vitor Constancio is due to speak at 12:00 GMT.
Economists are expecting the German ZEW economic sentiment index to show a slowdown in Germany's economy. The index gauges the six-month economic outlook and its August forecasts stand at 15, down from 17.5 recorded in July. Current conditions also look to have cooled down as the estimates predict a reading of 85.5, below the prior's months reading of 86.4. Any surprise to the upside could be supportive for the euro.
Oil prices gained during Asian trading on signs that supply is tightening, especially in the US. These indications will be put to test in the late US session when the American Petroleum Institute publishes statistics on crude inventories and refinery operations for the week of August 14. Should the report show a fall in inventories, oil prices could find support for a further boost. WTI was last trading at $47.64 a barrel and Brent was at $51.96.
Gold weakened during today's first session of the day to last trade at $1,285.26 an ounce.
AUD/USD Daily Outlook
Daily Pivots: (S1) 0.7917; (P) 0.7934; (R1) 0.7956; More...
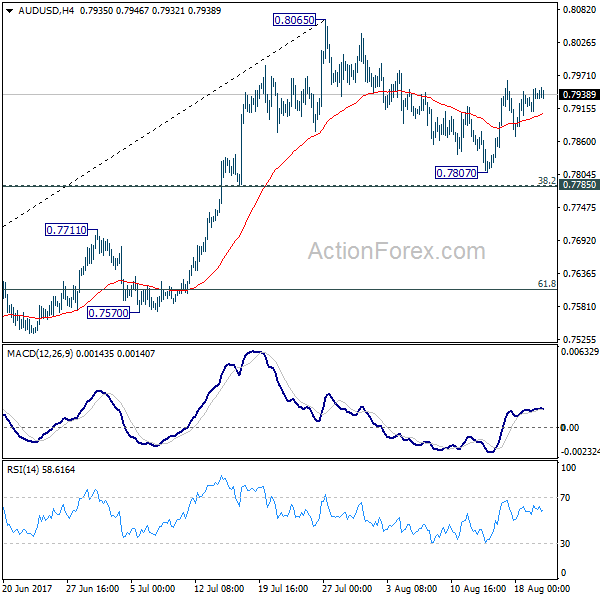
Intraday bias in AUD/USD remains mildly on the upside for retesting 0.8065. The pull back from there should have completed at 0.7807 already. Firm break of 0.8065 will resume the medium term rise and target 100% projection of 0.6826 to 0.7833 from 0.7328 at 0.8335. In case of another fall, we'd continue to expect strong support from 0.7785 cluster support (38.2% retracement of 0.7328 to 0.8065 at 0.7783) to contain downside and bring rebound.
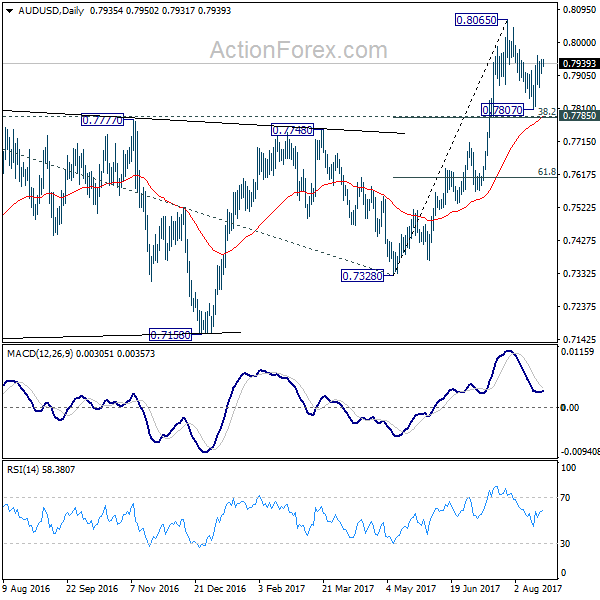
In the bigger picture, rise from 0.6826 medium term bottom is still in progress. At this point, there is no confirmation of trend reversal yet and we'll continue to treat such rebound as a corrective pattern. But in any case, break of 55 month EMA (now at 0.8097) will target 38.2% retracement of 1.1079 to 0.6826 at 0.8451. Break of 0.7328 support is needed to confirm completion of the rebound. Otherwise, further rise is now in favor.
US Dollar Downsides Limited By 0.9600 Vs Swiss Franc
Key Highlights
- The US Dollar is trading in a major range with resistance near 0.9765 and support at 0.9600 against the Swiss Franc.
- There is a crucial bullish trend line with support at 0.9600 forming on the 4-hours chart of USD/CHF.
- Swiss Trade Balance for July 2017 posted a trade surplus of 3511M, better than the last 2,880M.
- Today, the Housing Price Index for July 2017 will be released, which is forecasted to increase by 0.4% (MoM).
USD/CHF Technical Analysis
The US Dollar seems to be trading in a major range with us d and support at 0.9600 against the Swiss Franc. The USD/CHF pair downsides are limited and supported by 0.9600.
Looking at the 4-hours chart, there is a crucial bullish trend line forming with support at 0.9600. The pair recently tested the trend line at 0.9601 and retreated higher.
On the upside, the most important resistance is near 0.9675, which is near the 100 simple moving average (H4). It also represents the 50% Fib retracement level of the last decline from the 0.9765 high to 0.9586 low.
The pair was already rejected once from 0.9675 and there are chances of USD/CHF retesting it in the near term. In a broader perspective, the pair remains in a long-term range of 0.9765-0.9600. Having said that, downsides are limited by 0.9600, and possibilities of USD/CHF trading higher are high.
Swiss Trade Balance
Today in Switzerland, the Trade Balance report for July 2017 was released by the Federal Customs Administration. The market was looking for a trade surplus of 2,880M compared with the last surplus 2764M.
The actual result was better, as there was a trade surplus of 3511M. Exports of goods and services in July 2017 were 18347M, less than the last revised 18799M. Imports of goods and services in July 2017 were 14836M, less than the last revised 16035M.
The result was mostly neutral, and could weigh on the Swiss Franc. The USD/CHF might trade towards 0.9675 where buyers will be tested. The H4 RSI needs to clear the 50 level to gain momentum and set the pace for USD/CHF towards 0.9675.
On the downside, the 0.9620 and 0.9600 are important support levels.
USD/CAD Daily Outlook
Daily Pivots: (S1) 1.2538; (P) 1.2572; (R1) 1.2591; More....
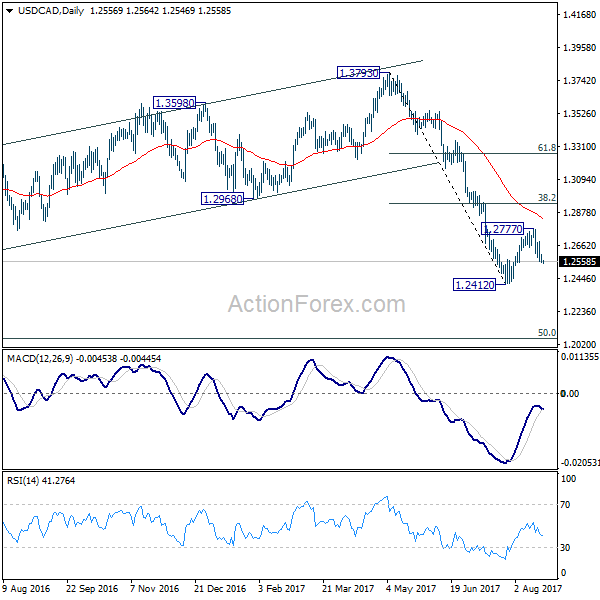
Intraday bias in USD/CAD remains on the downside as fall from 1.2777 is in progress for retesting 1.2412 low. Break there will resume the larger decline and target next long term fibonacci level at 1.2048. On the upside, above 1.2690 will extend the correction from 1.2412 with another rise. But we'd expect upside to be limited by 38.2% retracement of 1.3793 to 1.2412 at 1.2940 to bring fall resumption eventually.
In the bigger picture, price actions from 1.4689 medium term top are seen as a correction pattern. Such corrective fall is still expected to extend to 50% retracement of 0.9406 to 1.4869 at 1.2048. At this point, we'd look for strong support from there to contain downside and bring rebound. Nonetheless, on the upside, sustained break of 1.2968, 38.2% retracement of 1.3793 to 1.2412 at 1.2940 will be the first sign of completion of the correction and will turn focus back to 1.3793 key resistance.
Trade Idea : GBP/USD – Stand aside
GBP/USD - 1.2868
Most recent candlesticks pattern : N/A
Trend : Near term down
Tenkan-Sen level : 1.2887
Kijun-Sen level : 1.2884
Ichimoku cloud top : 1.2875
Ichimoku cloud bottom : 1.2872
New strategy :
Stand aside
Position : -
Target : -
Stop : -
As cable has retreated after faltering below resistance at 1.2918, retest of last week’s low at 1.2832 cannot be ruled out, however, break there is needed to revive bearishness and signal recent decline has resumed and extend weakness to 1.2800 and possibly towards 1.2770 but near term oversold condition should limit downside to 1.2750, bring another rebound later.
On the upside, above 1.2900 would bring another test of 1.2918, then 1.2932-33 (50% Fibonacci retracement of 1.3032-1.2832 and previous support) but above there is needed to signal a temporary low has possibly been formed, bring a stronger rebound to 1.2955-60 (61.8% Fibonacci retracement) and later towards 1.2990-00. As near term outlook is mixed, would be prudent to stand aside in the meantime.
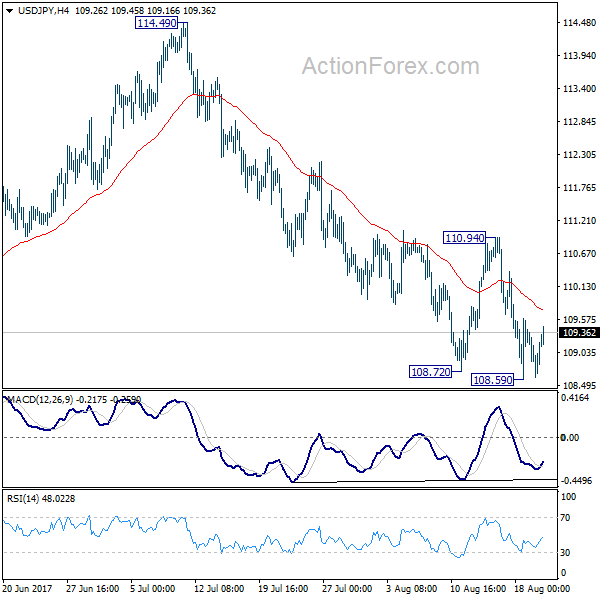
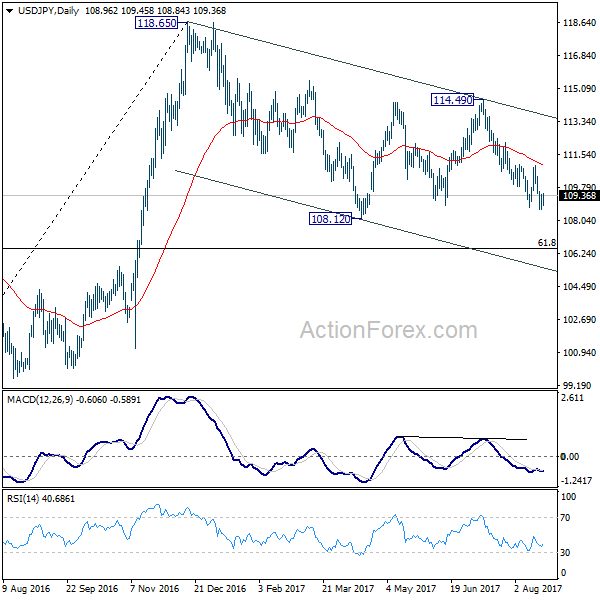
USD/JPY Daily Outlook
Daily Pivots: (S1) 108.59; (P) 109.00; (R1) 109.38; More...
Intraday bias in USD/JPY is turned neutral with another temporary low formed at 108.59. But overall, outlook stays bearish as long as 110.94 resistance holds. Below 108.59 will target a test on 108.12 low. Whole corrective decline from 118.65 is possibly resuming and break of 108.12 will target 61.8% retracement of 98.97 to 118.65 at 106.48.
In the bigger picture, the corrective structure of the fall from 118.65 suggests that rise from 98.97 is not completed yet. Break of 118.65 will target a test on 125.85 high. At this point, it's uncertain whether rise from 98.97 is resuming the long term up trend from 75.56, or it's a leg in the consolidation from 125.85. Hence, we'll be cautious on topping as it approaches 125.85. If fall from 118.65 extends lower, downside should be contained by 61.8% retracement of 98.97 to 118.65 at 106.48 and bring rebound.
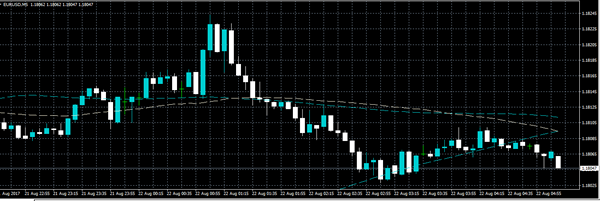
EURUSD Bullish Above 1.1790
The EURUSD pair has softened towards the 1.1800 level, after moving to 1.1828 during the U.S session on Monday. The euro remains technically bullish whilst trading above the downward slopping channel-top, found at 1.1790.
During the European session, we see the release of the German and eurozone ZEW sentiment survey's, and a key speech from European Central Bank Vice-President Vitor Constancio.
The EURUSD pair remains bullish on all-time frames, with price action now trading firmly above the 200-week moving average, found at the key 1.1783 level.
To the upside, key technical resistance is found at 1.1815, and the current weekly price high, at 1.1828. The weekly swing high adds further resistance, at 1.1847, with longer-term resistance at the crucial 1.1900 level.
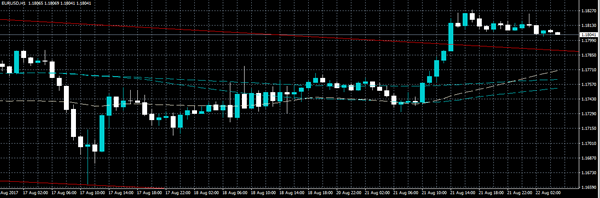
To the downside, critical intraday EURUSD support is found at the 1.1790 level. The 200-hour moving average comes in at 1.1770, with the 50-hour moving average adding further support, at 1.1755.
GBPUSD Bearish Below 1.2915
The GBPUSD pair has softened below the 1.2900 level, as British pound buyers struggled to maintain bullish trading momentum above the key 1.2915 resistance level.
So far sterling has fallen towards the trendline support, at 1.2880, after finding intraday resistance from the pairs weekly pivot point, at 1.2910.
Going forward, the GBPUSD pair is likely to remain range-bound between the 1.2830 to 1.2915 trading band, until a clear trading catalyst emerges.
Key technical support is found at the GBPUSD daily pivot point, at 1.2887, the current weekly low offers further support, at 1.2850, whilst 1.2830 acts as critical support.
To the upside, the 1.2900 level is strong intraday resistance, while the 1.2915 level acts as key break-out resistance. Once above the 1.2915 level, the 1.2932 and 1.2950 levels come into focus.