Sample Category Title
Markets To Remain On Edge After Volatile Week
Global equity markets are coming off a rough week, as political tensions in Washington triggered a fresh bout of risk aversion. Declining risk appetite drove investors into the safety of precious metals, with gold prices briefly climbing above $1,300.00 a troy ounce. A dearth of economic data on Monday will keep investors focused on politics ahead of a highly active week in the market.
In terms of data releases, the UK Office for National Statistics will report on UK public sector net borrowing at 08:30 GMT. The monthly indicator tracks the amount of new debt held by the various levels of the British government.
Later in the day, the Deutsche Bundesbank will release the Buba monthly report, which provides a detailed account of the domestic economy.
In the North American session, the Federal Reserve Bank of Chicago will release the National Activity Index at 12:30 GMT. The monthly report gauges overall economic activity in the US economy.
North of the border, Statistics Canada will report on wholesale sales for the month of June.
In currencies, the US dollar was little changed against a basket of world peers on Monday. The dollar index (DXY) spiked to more than three-week highs last Tuesday before losing momentum in the latter half of the week. The greenback could face heavy price action later in the week as markets await the annual Jackson Hole Symposium, which is organized by the Federal Reserve Bank of Kansas City.
EUR/USD
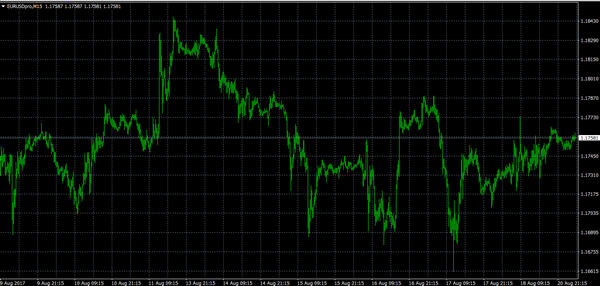
The EUR/USD is consolidating in the mid-1.17 range. Prices recovered on Friday after losing ground during the previous session. The pair will take cues from political developments in Washington over the coming days. The EUR/USD immediate support is located at 1.1712, although analysts warn that this is a weak line. A breach of this level would expose 1.1616 as the next target. On the opposite side of the spectrum, immediate resistance is located at 1.1876.
GBP/USD
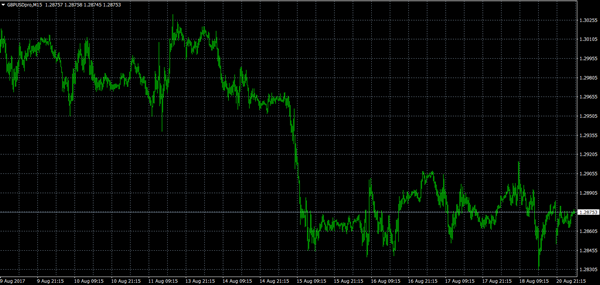
The British pound succumbed to bearish pressure last week, with the cable falling further below yearly highs. The GBP/USD exchange rate consolidated near five-week lows after prices failed to hold $1.2900. Cable was last seen trading at 1.2877, where it was little changed compared with the previous close. The 1.2840 area is a vital short-term support. A break below that level could expose cable to heavier losses. Bullish traders should look for a move north of 1.2900 to confirm the positive signal.
GOLD
Gold prices swung higher last week, overtaking the critical $1,300.00 level. The rally was short-lived, with prices falling back down toward $1,290.00. Traders looking to enter gold should monitor the stock market for risk sentiment. Volatility in equities will likely push investors into the safety of precious metals.
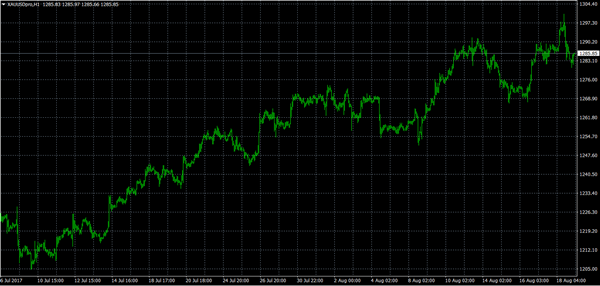
Technical Outlook: Spot Gold – Easing From $1300 Peak May Extend To Bull-Channel Support At $1272
Spot Gold regained traction on Monday and bounced to $1289 in Europe after opening with dap-lower and hit session low at $1280, where ascending 10SMA contained.
Gold price was significantly lower after Friday's strong rally that cracked psychological $1300 barrier and subsequent quick pullback.
Overall bulls remain intact, however risk of further easing towards $1272 (bull-channel support / rising 20SMA) exists, as failure to close above dented key barriers at $1292/96 and Friday's red daily candle with very long upper shadow weigh on near-term action.
Existing downside risk will be sidelined on regain of $1292 (11 Aug high) while extension above $1296 (06 June high) is needed to open way for retest of $1300 barrier and bullish resumption on firm break higher.
Res: 1289, 1292, 1296, 1300
Sup: 1280, 1276, 1272, 1267
UK’s Unrealistic Customs Proposal Might Delay Brexit Negotiations
Brexit negotiations return to the driver's seat as the third round of talks in phase one (withdrawal terms) is set to begin int he week of August 28. Last week, the government, facing criticisms of its lacking preparation, released the policy papers on future customs arrangements, and Northern Ireland and the border with Ireland. The UK's positions, in particular the customs arrangements, triggered criticisms and are expected to delay the completion of the first phase negotiation, limiting the time for the second phase (trade issues). British pound has remained under pressure recently, with GBPUSD hovering around a one-month low and EURGBP firming around the highest levels in 10 months.
Customs Union
At a 'future partnership paper titled Future Customs Arrangements, the UK signaled it intends to remain part of the EU's customs union during the transition period after March 2019. It also proposed two options for future relations with the single market. Generally speaking, customs union is a form of economic integration between two or more countries, in which member-states trade with no barriers, but they adopt a common set of trade restrictions with non-members. The degree of integration under customs union is merely higher than free trade agreements, way less than economic union, e.g. EU.
Two Options for Future UK-EU Customs Relations
The UK outlined two options for future trade relations with the EU, basing on the aims of seeking 'the freest and most frictionless trade possible in goods between the UK and the EU' and, at the same time, forging 'new trade relationships with our partners in Europe and around the world'. The first is a highly streamlined customs arrangement, under which the UK would manage a new border with 'as few additional requirements on EU trade as possible'. Under the arrangement, the UK would "simplify' processes, there will 'remain an increase in administration compared with being inside the customs union'. The second option is a new customs partnership, under which the UK aligns its approach to the customs border to an extent that there is no need for a UK-EU customs border. This arrangement requires a 'robust enforcement mechanism that ensures goods which had not complied with EU trade policy stayed in the UK'. Indeed, UK's Brexit Secretary David Davis indicated last week proposed for a 'shortish' transition period for a deal allowing the transit of goods across borders to continue under a temporary customs union.
In our opinion, the ultimate goal of the proposals is for the UK benefit from trading with the single market barrier-free, while minimizing its responsibilities. For instance, all member-states of a customs union have to adopt the same barriers to countries outside the union. However, in the new customs partnership option, the UK seeks to impose no customs border between the UK and EU single market, while at the same time allows the UK to engage in trade deals with other countries. There is not precedence of arrangement like this as the EU has never shared a frictionless customs border with any other country outside the European Union and customs union. For instance, under the Turkey-EU customs union, customs declarations and border checks are required to comply with rules of origin. Meanwhile, the UK's proposal is contradictory to the principals of the EU single market, which believes certain rules such as acceptance of EU law are facilitators of 'frictionless trade'. The highly streamlined customs arrangement appears more practical but also more expensive in terms of implementation as a new border would be set.
Undoubtedly, the EU has poured cold water on the proposals, noting that it would only address UK's preference on future relations 'once we have made sufficient progress on the terms of the orderly withdrawal. An agreement on a future relationship between the EU and the U.K. can only be finalized once the UK has become a third country'. Indeed, the EU has previously criticized the UK of 'cherry-picking' and affirmed that 'frictionless trade' is not possible outside the Single Market and Customs Union'.
We are concerned that UK's insistence of a hard but smooth Brexit would hardly be achievable and is prone to delaying the first phase negotiation. So far, both parties have not agreed on the 'divorce bill' – a critical topic in phase one negotiations, making it difficult to move on to the next phase (trade, transitional arrangement). Given the hardened stance in the EU, UK's proposals on trade and future customs relations (these topics are supposed to be discussed on phase two) on this stage are not helping break the current negotiation deadlock.
EUR/USD Elliott Wave Analysis
EUR/USD – 1.1740
EUR/USD: Wave (c) of 2 ended at 1.3993 and wave 3 of III has commenced for weakness to 1.0411 (1.236 of wave 1), then 1.0000.
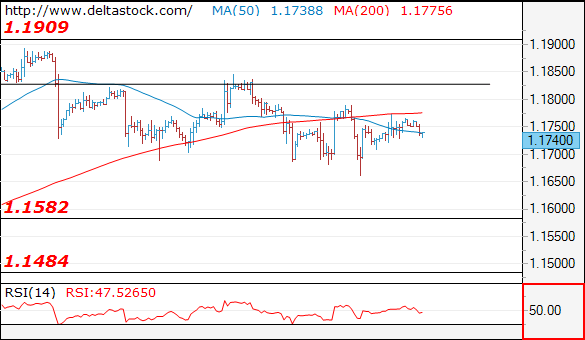
The single currency retreated after meeting resistance at 1.1847 earlier this month, retaining our view that minor consolidation below recent high at 1.1910 would be seen and risk of another corrective fall to 1.1662 is likely, however, reckon 1.1590-00 would limit downside and bring another rebound later, above said resistance at 1.1847 would signal the pullback from 1.1910 has ended, bring retest of this level. Once this recent high is penetrated, this would confirm medium term rise from 1.0340 (wave 3 trough) has resumed and extend gain to 1.1950, then 1.2000-10, break there would encourage for further gain in wave 4 to 1.2100 but price should falter well below 1.2220-30, bring retreat later.
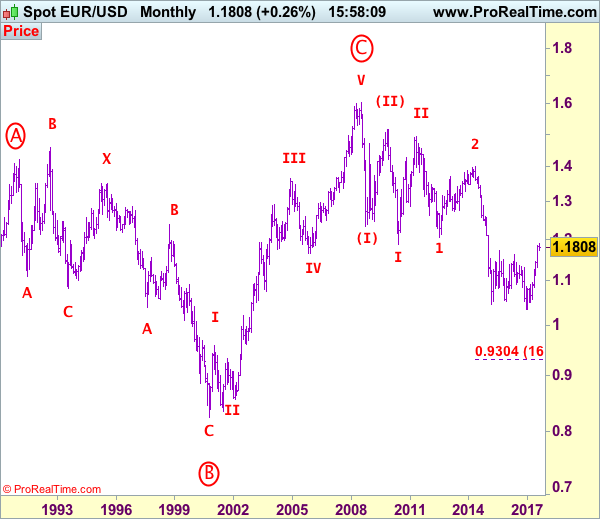
Our preferred count on the daily chart remains that a wave (II) from 1.2329 ended at 1.5145 with A-leg ended at 1.4720, followed by wave B at 1.2457, the wave C from there was also a 3 legged move and is labeled as (a): 1.3739, (b): 1.2885, the wave iii of the 5-waver (c) from 1.2885 has ended at 1.4339 and wave iv is a triangle ended at 1.3878 and wave v formed a top at 1.5145. The decline from there is a 5-waver (C) with minor wave (i) of I of (C) ended at 1.4218 with wave (ii) ended at 1.4580, wave (iii) ended at 1.3267 and wave (iv) ended at 1.3692 and wave (v) ended at 1.1876, this is also the low of wave I of (C) and wave II ended at 1.4940, hence wave III is now in progress with a diagonal wave 1 ended at 1.2042, the breach of previous support at 1.1876 (wave I trough) adds credence to our view that the wave 2 has ended at 1.3993, wave 3 has commenced for further weakness to 1.0411, then towards 1.0000.
On the downside, whilst another corrective fall to 1.1662 is likely, reckon downside would be limited to support at 1.1613 and renewed buying interest should emerge around previous resistance at 1.1583 and price should stay well above support at 1.1479, bring another upmove later. A drop below said support at 1.1479 would signal a temporary top is formed, bring correction of recent upmove to 1.1400, then 1.1370 but support at 1.1312 should remain intact.
Recommendation: Buy at 1.1600 for 1.1800 with stop below 1.1500
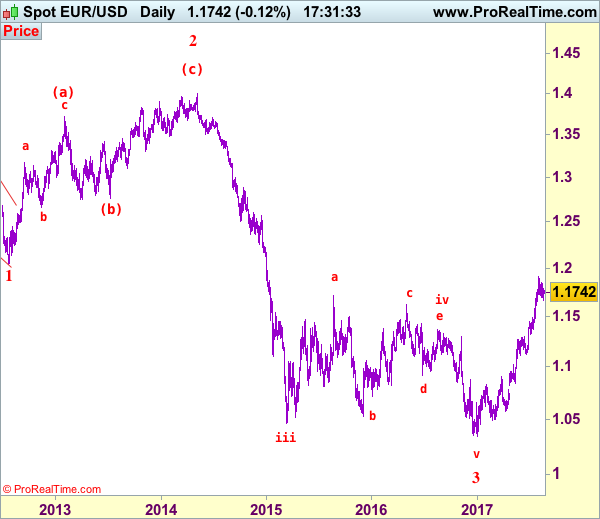
Euro's long-term uptrend started from 0.8228 (26 Oct 2000) with an impulsive structure. The rise from 0.8228 to 0.9593 (5 Jan 2001) is labeled as wave I, the retreat to 0.8352 (6 Jul 2001) is wave II and the rally to 1.3670 (31 Dec 2004) is wave III. Wave IV from there ended at 1.1640 (15 Nov 2005), the subsequent upmove to 1.6040 (July 15, 2008) is treated as wave V, the major selloff from the record high of 1.6040 to 1.2329 (October 27, 2008) signals a reversal has taken place with (I) leg ended at 1.2329 and once (II) ended at 1.5145, wave (III) itself is an extended move with I: 1.1876 and complex wave II ended at 1.4902, wave III has commenced with wave 1 and 2 ended at 1.2042 and 1.3993 respectively, wave 3 of III is now unfolding for weakness towards parity.
USD/JPY Elliott Wave Analysis
USD/JPY - 109.06
USD/JPY – Wave V of larger degree circle V has possibly ended at 75.31 and major correction has commenced and already met indicated target at 125.00.
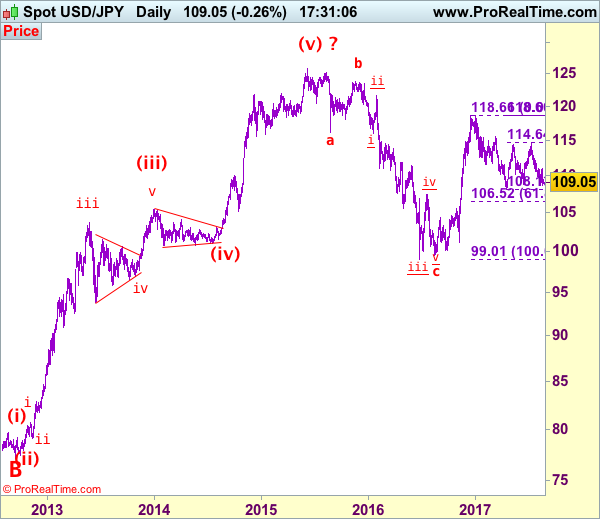
As the greenback has remained under pressure after recent anticipated selloff from 114.50, adding credence to our view that early rebound from 108.13 (this year’s low) has ended at 114.50 and retest of this level would be seen, however, break there is needed to retain bearishness and confirm early fall from 118.66 top has resumed and extend decline to 107.50, then 107.00 but reckon 106.50-55 (61.8% Fibonacci retracement of 99.01-118.66) would hold from here.
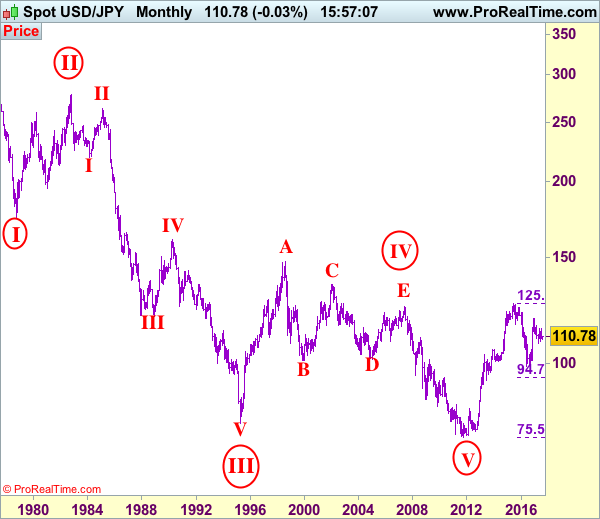
Our preferred count is that, triangle wave IV (with circle) ended at 101.45 and the circle wave V brought dollar down to the record low of 75.31 in 2011 and the subsequent rebound signal major correction has commenced with A leg ended at 84.19, followed by wave B at 77.14 and impulsive wave C is now unfolding (indicated upside target at 125.00 had been met) for gain towards 127.00 level. In the event dollar drops below support at 99.01, this would confirm medium term decline from 125.86 top (2015 high) has resumed for subsequent weakness to 98.00 and possibly 97.00.
Under this count, this wave C is unfolding as impulsive waves with (1) (2), 1 2 ended at 80.67, 79.07, 82.84 and 81.69 respectively, hence the extended wave 3 has ended at 103.74 and wave 4 correction of recent upmove should bring weakness to 92.57, then towards 90.88 but psychological support at 90.00 should limit downside and bring another rally later in wave 5, indicated target at 125.00 had been met and gain to 127.00 cannot be ruled out but reckon price would falter below 130.00.
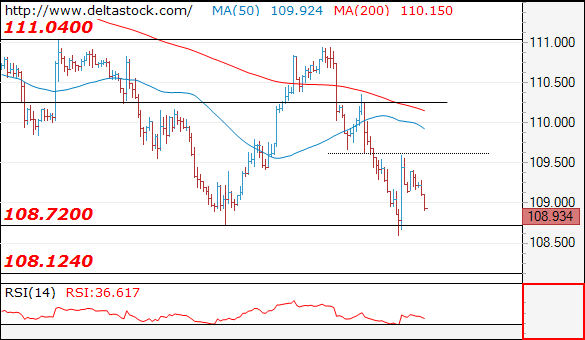
On the upside, whilst initial recovery to 110.20-30 cannot be ruled out, reckon upside would be limited to resistance at 111.05 and bring another decline. Only a daily close above resistance at 112.20 would defer and signal the first leg of decline from 114.50 has ended instead, bring a strong rebound to 112.85-90 but resistance at 113.58 should cap upside, bring another selloff later.
Recommendation: Sell again at 111.00 for 109.00 with stop above 112.00.
On the monthly chart, we have changed our preferred count that an impulsive wave is unfolding with major wave III with circle ended at 79.75, then followed by wave IV with circle and is labeled as a triangle with A: 147.64 (11 August, 1998), B: 101.25, C: 135.20, D: 101.67 and E leg ended at 124.14 to end the wave IV with circle. Hence, wave V with circle commenced from there and hit a record low of 75.31, however, the subsequent strong rebound signals this circle wave V has possibly ended there, hence gain to (indicated upside target at 122.00 and 125.00 had been met), the retreat from 125.86 suggests wave A of major correction has ended there and wave B correction back to 99.00, then 95.00 would be seen, however, reckon downside would be limited to 90.00, bring another rebound in wave C next year.
USD Takes A Breather Ahead Of Jackson Hole Symposium
Jackson Hole in focus
Over the past few days, market participants have shoved aside their worries about monetary policy to focus on political developments in the US, more specifically the resignation of several of its advisors. Rumours that Gary Cohn may follow the pack triggered a wave of panic among investors. Equities took a hit with the S&P 500 ending in negative territory for the second week in a row, down 2.08% overall. The tech-heavy Nasdaq closed below the neutral threshold for the fourth week in a row, down 2.7% since July 24th.
Nevertheless, the annual high mass of central bankers in Jackson Hole will likely draw investors’ attention away from Trump’s political troubles. As usual, the US and EU central banks will be the biggest player at the table. However, this year is quite different as both of them made clear they are willing to move further toward tightening. The Fed has been delaying the announcement of the starting date of its balance sheet run-off for several months, while the ECB has been reluctant to give further information regarding tapering. Moreover, both institutions are facing growing unease as inflation levels have decelerated in the USA and the euro zone. The market is therefore eager to get clarity on this specific topic. The central bank policy forum on Thursday will be the key event of the week with Janet Yellen as main guest.
The US dollar has been trading mostly sideways on Monday even though it rose 0.15% against the single currency, 0.25% against the Swissie and 0.14% against the Aussie. Only the Japanese yen was able to extend gains, rising 0.10%. We expect appetite for the USD to remain weak ahead of Yellen’s speech, especially against the backdrop strong divergence among Fed members and lacklustre inflation data.
SNB: Domestic sight deposits decline
Today has been released the Swiss domestic sight deposits which has declined to CHF 470.3billion from CHF 476.3 billion while the EURCHF is pushing higher and is now consolidating around 1.1350CHF for one single euro note. We start seeing the sight deposits growth slowing down. The FX reserves has largely increased in July as the CHF was weakening. We consider that for the time being the SNB does not need to intervene as much as it intervened in the past.
The CHF appreciation is providing the Swiss central bank with some relief. Yet, we consider that the CHF is still significantly overvalued. The main driver is still the single currency and in September, the ECB meeting will be key. There are room for disappointment as markets expect the European central bank to start further tightening by reducing the asset purchase program. On the contrary we believe that the European institution will show further cautiousness and that downside pressures on the EURCHF pair are likely.
On top of that the Greek issue is not sustainable. Fitch upgraded this weekend the debt rating to B- from CCC with a positive outlook. This contributes to drive in the short-run the euro higher as markets will price in the possibility of further upgrade. We recall that the charge of the Greek debt is not sustainable in the long run and will send money flowing back in Switzerland. Any appreciation of the EURCHF should pave the way for reloading short euro positions.
Forex Technical Analysis: EUR/USD, USD/JPY, GBP/USD
EUR/USD
Current level - 1.1740
My outlook remains bearish on the senior frames, for a slide towards 1.1580. Crucial on the upside is 1.1850 resistance.
| Resistance | Support | ||
| intraday | intraweek | intraday | intraweek |
| 1.1780 | 1.1909 | 1.1660 | 1.1580 |
| 1.1850 | 1.2000 | 1.1580 | 1.1480 |
USD/JPY
Current level - 108.93
The slide through 108.70 low signals, that the downtrend hes been renewed, towards 108.10, en route to 107.00 area. There is still and intraday risk of a bounce towards 109.60 and even 110.30 minor hurdles.
| Resistance | Support | ||
| intraday | intraweek | intraday | intraweek |
| 109.60 | 111.00 | 108.80 | 108.10 |
| 110.30 | 112.20 | 108.10 | 107.00 |
GBP/USD
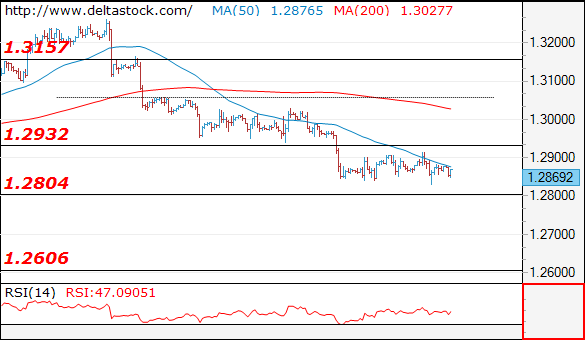
Current level - 1.2869
The overall outlook remains bearish, for a break through 1.2800 area, towards 1.2600 zone. Key resistance lies at 1.2930.
| Resistance | Support | ||
| intraday | intraweek | intraday | intraweek |
| 1.2930 | 1.3260 | 1.2804 | 1.2804 |
| 1.3050 | 1.3500 | 1.2705 | 1.2606 |
US Futures Subdued | Investors Keep Their Focus On Geopolitics And Jackson Hole
Investors focus on Jackson Hole meeting
North Korea could esclate tensions again
US futures are trading lower following investor sentiment over in Europe which is somewhat subdued and it has some negative skew. The reason is very simple, both the US and South Korea have their military exercises scheduled for this week and it could prompt some reaction from North Korea which is going to aggravate the entire situation once again.
The resignation of Steve Bannon, the chief strategist of Donald Trump, did provide some comfort for the market on Friday. Gary Cohn, the chief economist, is the most powerful person in the White House now, and there was some uncertainty about him leaving the office prior to this which would have been a big blow for the president. However, with Steve Bannon no longer in the office, it is more than likely that Gary Cohen will finally be able to get some work done.
Traders have their hopes pinned on the upcoming Jackson Hole meeting. They are expecting new information from the ECB president and the Federal Reserve chairwoman. This increases the chances of disappointment because so far one thing is clear, which is that the Fed is not going to be excessively hawkish and the European Central Bank is highly likely to stay reticent during the event.
The surprise announcement during this event matters the most. We know that the Fed's discussion is more likely to be focused on the financial stability. Draghi has already made his position very clear that he is not revealing any new details which would impact their decision.
The British pound could feel more punishment as the Brexit negotiations will take the spotlights. The government will release its new papers on Brexit. Investors seek clarity when it comes to Brexit and the politicians are covering this with sand and are keeping things in the dark. The period of transition is very important and the government has failed to establish anything meaningful on it.
Trade Idea: GBP/USD – Sell at 1.2980
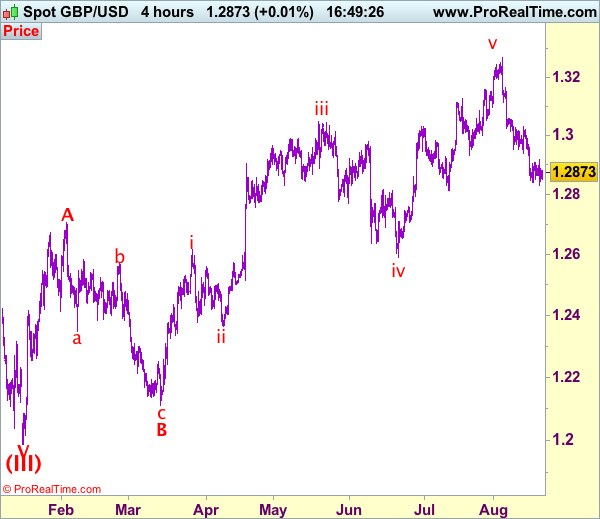
GBP/USD – 1.2872
Original strategy :
Sell at 1.2980, Target: 1.2815, Stop: 1.3040
Position: -
Target: -
Stop: -
New strategy :
Sell at 1.2980, Target: 1.2815, Stop: 1.3040
Position: -
Target: -
Stop:-
As cable recovered after finding support at 1.2832 on Friday, retaining our view that consolidation would be seen and corrective bounce to 1.2920 is likely, however, reckon upside would be limited to 1.2980-90 and bring another decline, below said support at 1.2832 would add credence to our view that the selloff from 1.3269 top is still in progress and bearishness remains for this move to bring correction of early upmove, hence further weakness to 1.2812 support would be seen but near term oversold condition should prevent sharp fall below 1.2800 and reckon 1.2740-50 would hold on first testing, bring rebound later.
In view of this, would not chase this fall here and would be prudent to sell cable on recovery as 1.2980-90 should limit upside, above resistance at 1.3032 would defer and suggest low is formed, risk a stronger rebound to 1.3059 and possibly towards 1.3100 but previous support at 1.3112 (now resistance) should remain intact, bring another decline.
Our preferred count on the daily chart is that cable's rebound from 1.3500 (wave (A) trough) is unfolding as a wave (B) with A ended at 1.7043, followed by triangle wave B and wave C as well as wave (B) has ended at 1.7192, the subsequent selloff is the larger degree wave (C) which is still unfolding with minor wave (III) of larger degree wave 3 ended at 1.1986, hence wave (IV) correction is in progress which could either be a triangle wave (IV) of a complex formation but upside should be limited to 1.3500 and price should falter well below 1.4000, bring another decline in wave (V) of 3 for weakness to 1.1500, then 1.1200.
EURAUD Looking Bearish Below The Ichimoku Cloud
EURAUD had started a strong rally on July 27. However, this uptrend later faded and turned negative after the pair recorded a triple top recently, turning the bias to bearish.
In the near-term, the picture is bearish to neutral according to the RSI. The indicator is below the 50 neutral-perceived level but it has been moving sideways over the last couple of trading days.
Turning to the Ichimoku analysis, the pair has crossed below the cloud – this is a bearish signal. Additionally, the price violated the 50-period moving average (MA) on the downside, while it is currently testing the 200-period MA as well. Moreover, the fact that the Chikou-span (green line) broke below prices to enter the cloud, and the Tenkan-sen is located below the Kijun-sen, strengthens the bearish structure on the four-hour chart. However, bear in mind that the bullish cross between the 50- and the 200-period MA that was recorded on August 8 remains in place.
Should the price head down, an immediate support could be provided by the 2-½ week low of 1.4735 reached on August 17. A further movement to the downside could find support at the psychological level of 1.4600 before the pair targets the eleven-week low of 1.4421 (July 20).
Alternatively, if prices rise, a strong resistance might be found around the 1.4900 key point, where the 50-period MA is also roughly located. A break above would turn the attention to the one-month high of 1.1508 (August 14) for additional resistance while steeper increases would shift the focus to the 1.5100 key level.