Sample Category Title
The Market Still Believes in the Yen
Despite all the talking of the Japanese currency and its losing the status of "safe haven", the demand for the Yen rises when the market is unstable.
The Japanese Yen has strengthened significantly against the USD recently. On Friday, the USD/JPY pair was trading at 109.04. By now, the instrument has broken the support level at 109.40, which was considered very significant from the point of view of further sales. The next key support level is at 108.73.
This week, Japan hasn't published much important statistics. There was an interesting report on the Industrial Production in June, which expanded by 2.2% m/m, although the market has expected a smaller number. Also, Japan published a preliminary report on the GDP in the second quarter, which showed the expansion of the economy by 1.0% q/q. In the previous quarter, the indicator added just 0.3% q/q. However, the USD/JPY pair barely responded to these numbers.
On the whole, the USD/JPY pair will remain rather volatile over the next several weeks. Investors' sentiments depend directly on the attitude to the USD: the more reasons to avoid risks they have, the more affection they hold for the Yen.
Some time ago, there were speculations on the market that the Yen was no longer considered as a "safe haven" asset. Arguments were different, from the fact that the Japanese currency was too volatile to the BoJ's approach to the monetary policy. As a matter of fact, the market itself denies these rumors: when the USD gets weaker due to some reasons and investors get rid of unnecessary risks, the demand for the Yen increases automatically. It can be easily seen on any daily chart.
The BoJ's fiscal approach is sure to raise a lot of questions. The most important of them lies in lack of understanding how the regulator and the Japanese government are going to deal with the national debt, which is growing at an exponential rate. However, since the moment the QE program was introduced, there hasn't been any official opinions about it. One can only guess: some part of the debt will be refinanced, but the sums are enormous and have to be covered somehow.
At year-end 2016, the foreign debt of Japan was $2,719,000 million, which is 46% of the country's GDP. At the top 10 of the world's major debtors, Japan is far from the worst and doing better than the USA, The United Kingdom, and Germany. Anyway, as long as the BoJ's QE program is working, the national debt will remain intact.
EUR/USD Candlesticks and Ichimoku Analysis
Weekly
• Last Candlesticks pattern: Shooting star
• Time of formation: 31 Jul 2017
• Trend bias: Near term up
Daily
• Last Candlesticks pattern: Shooting star
• Time of formation: 2 Aug 2017
• Trend bias: Up
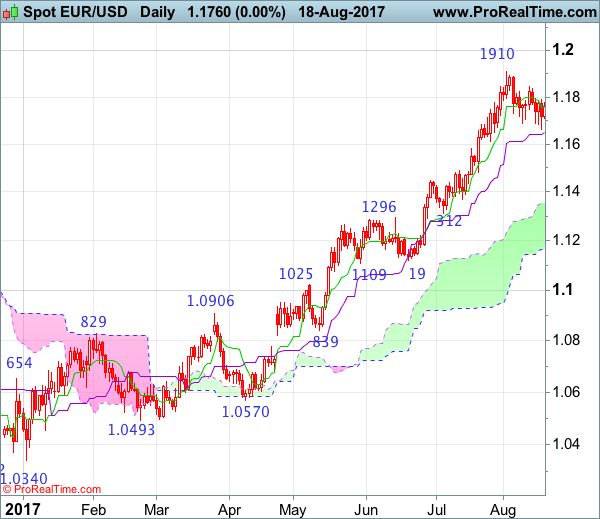
EUR/USD – 1.1800
The single currency continued trading in relatively narrow range since running into resistance at 1.1910 earlier this month, retaining our view that further consolidation below this level would be seen and near term downside risk remains for another corrective fall, below support at 1.1662 would bring retracement of recent rise to 1.1590-00, however, reckon 1.1540-45 would contain correction and bring another rise later. Above 1.1790 would bring test of resistance at 1.1847 but break there is needed to confirm the pullback from 1.1910 has ended, bring retest of this level later. Looking ahead, only break there would confirm recent upmove from 1.0340 low has resumed and extend headway to 1.1950, then psychological level at 1.2000, having said that, loss of upward momentum should prevent sharp move beyond 1.2165.
On the downside, expect pullback to be limited to 1.1590-00 and bring another rise. Below 1.1540-45 would defer and risk test of 1.1490 (previous resistance turned support), a daily close below there would signal a temporary top is formed instead, bring retracement of recent rally to 1.1435, then 1.1390-00, however, still reckon downside would be limited to 1.1350 and price should stay above support at 1.1312.
Recommendation: Buy at 1.1590 for 1.1790 with stop below 1.1490.
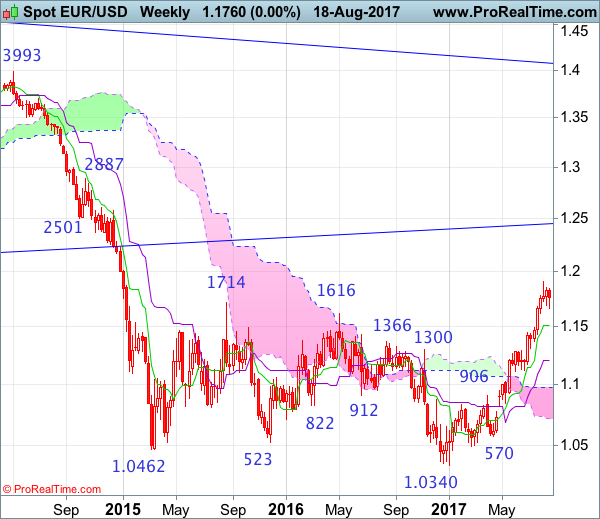
On the weekly chart, although the single currency recovered after finding support at 1.1662 late last week and a candlestick with a long lower shadow was formed, as long as resistance at 1.1847 holds, risk of another corrective fall to 1.1613 support cannot be ruled out but break there is needed to suggest a temporary top is formed, bring retracement of recent upmove to the Tenkan-Sen (now at 1.1541) and later towards 1.1435, having said that ,downside should be limited to 1.1370 and support at 1.1312 should remain intact, bring rebound later.
On the upside, expect recovery to be limited to 1.0790-00 and resistance at 1.1847 should hold, bring further consolidation. A weekly close above 1.1847 would signal the pullback from 1.1910 has ended, bring retest of this recent higher break there would confirm the major rise from 1.0340 low has resumed and may extend gain to 1.1950, then 1.1200, however, weakening of near term upward momentum would prevent sharp move beyond 1.2160-70 and reckon 1.2220-30 would hold, price should falter below 1.2300-10, bring another retreat later.
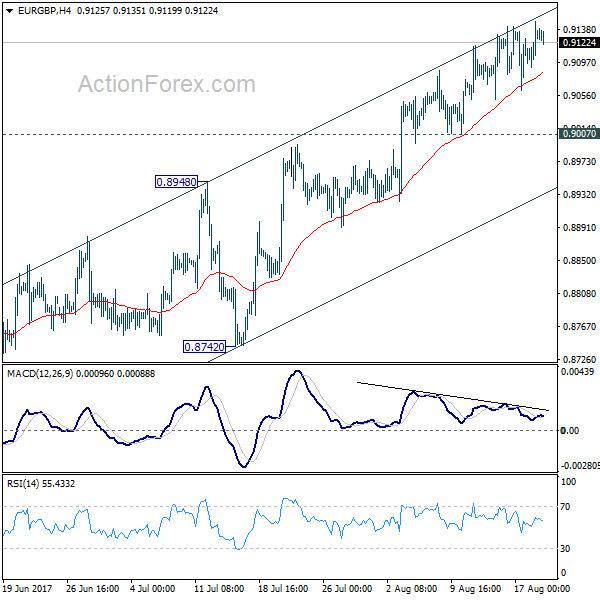
EUR/GBP Daily Outlook
Daily Pivots: (S1) 0.9098; (P) 0.9123; (R1) 0.9157; More
With 0.9007 support intact, further rise is expected in EUR/GBP for 0.9304 high. At this point, there is no clear sign of up trend resumption yet. Hence, we'll be cautious on strong resistance from 0.9304 to limit upside and bring another fall. On the downside, considering bearish divergence condition in 4 hour MACD, break of 0.9007 support will indicate short term topping. Intraday bias will then be turned back to the downside for 0.8742/8948 support zone.
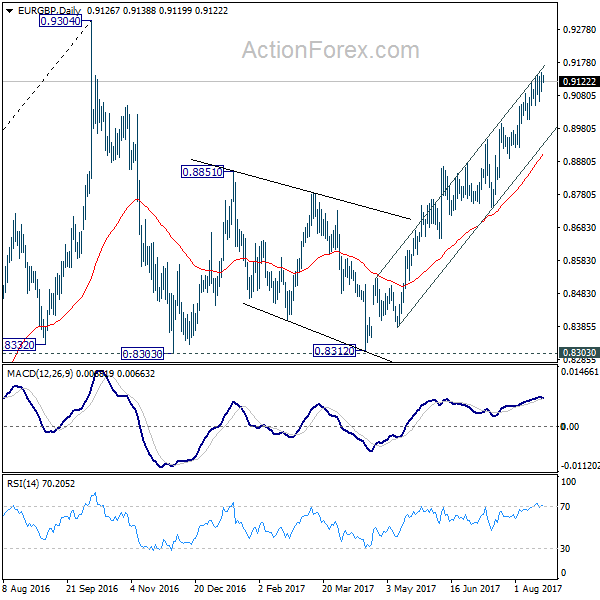
In the bigger picture, price actions from 0.9304 are viewed as a medium term corrective pattern. It's uncertain whether it is finished yet. But in case of another fall, we'd expect strong support from 0.8116 cluster support (50% retracement of 0.6935 to 0.9304 at 0.8120) to contain downside and bring rebound. Whole up trend from 0.6935 is expected to resume after consolidation from 0.9304 completes.
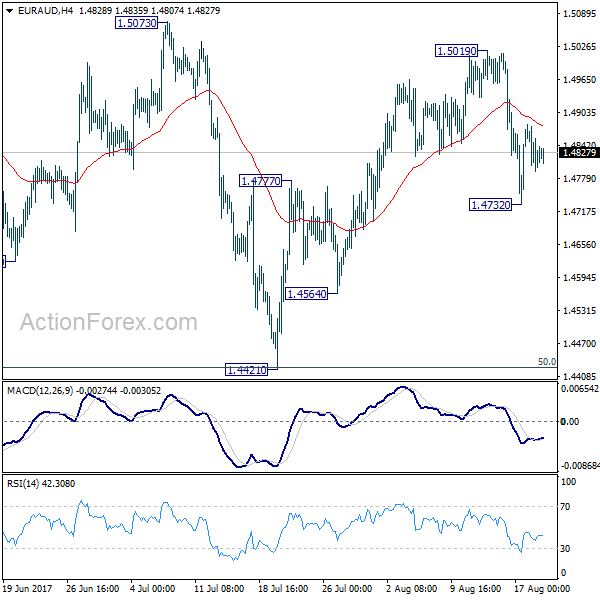
EUR/AUD Daily Outlook
Daily Pivots: (S1) 1.4788; (P) 1.4834; (R1) 1.4874; More...
Intraday bias in EUR/AUD remains neutral for the moment. Consolidation pattern from 1.5226 is possibly still in progress. Below 1.4732 will bring another fall. But we'd expect 1.4421 cluster support (50% retracement of 1.3624 to 1.5226 at 1.4427) to hold and bring rebound. On the upside, above 1.5019 will target a test on 1.5226 high instead.
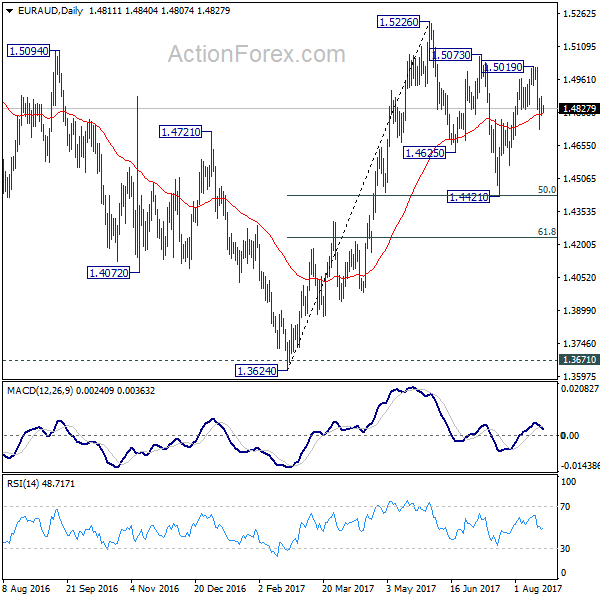
In the bigger picture, we're holding on to the view that corrective decline from 1.6587 medium term has completed at 1.3624. Rise from 1.3624 is expected to extend to retest 1.6587. The corrective structure of the fall from 1.5226 is affirming this view. Above 1.5226 will target a test on 1.6587 key resistance. However, break of 1.4421 will dampen our view and would drag EUR/AUD lower to retest key support zone around 1.3624.
USD/CAD: CPI Y/Y
The USD/CAD fell significantly in the wake of reports on Friday showing that the yearly growth of consumer inflation in Canada rose as much as anticipated in July. As the 5 minute chart shows, after the release the Canadian Dollar appreciated against the Greenback by 42 base points to start trading far below the 1.2612 mark until Monday morning.
Statistics Canada reported that its Consumer Price Index gained 1.2% on an annual basis, while being flat month-over-month in July, with both readings matching analysts' forecasts. The Canadian economic growth is likely to gain momentum in the upcoming quarter, with inflation capable of reaching the Bank of Canada's 2% target, which would prompt the central bank to deliver one more rate hike this fall.
Daily Technical Analysis: USD/CAD Potential Break Of The Trend Line For Downtrend Continuation
The USD/CAD made another bearish swing during previous week as the Canadian CPI data was better than the previous reading. The CPI is the most important inflation-related release due to its earliness and broad scope. At this point the pair is having a retracement due to the bullish divergence formed at bottom. If the pair retraces to POC 1.2635-1.2652 (ATR high, EMA89, D H4, W H3, 61.8, historical sellers) we could see a rejection towards 1.2615 and 1.2588. But if the pair doesn;t retrace to POC we could see a trend line break. Break below 1.2588 should spur a continuation towards 1.2540 and 1.2520.
W L3 - Weekly Camarilla Pivot (Weekly Interim Support)
W H3 - Weekly Camarilla Pivot (Weekly Interim Resistance)
W H4 - Weekly Camarilla Pivot (Strong Weekly Resistance)
D H4 - Daily Camarilla Pivot (Very Strong Daily Resistance)
D L3 – Daily Camarilla Pivot (Daily Support)
D L4 – Daily H4 Camarilla (Very Strong Daily Support)
POC - Point Of Confluence (The zone where we expect price to react aka entry zone)
Euro Facing Strong Offers Near 1.1780 Vs US Dollar
Key Highlights
- The Euro stayed above the 1.1650 support against the US Dollar, but failed near 1.1770-1.1780.
- There are two important bearish trend lines with resistance near 1.1770 and 1.1780 forming on the 4-hours chart of EUR/USD.
- Greece current account for June 2017 posted a trade surplus of €0.842B, better than the last €-0.582B.
- Today, the Chicago Fed National Activity Index (CFNAI) for July 2017 will be released, which is forecasted to decline from 0.13 to 0.10.
EUR/USD Technical Analysis
The Euro remained elevated this past week above 1.1650 against the US Dollar. However, buyers are finding it hard to take EUR/USD above a major resistance near 1.1770-1.1780.
Looking at the 4-hours chart, there are two important bearish trend lines forming with resistance near 1.1770 and 1.1780. The 100 simple moving average (H4) and the 61.8% Fib retracement level of the last decline from the 1.1847 high to 1.1662 low are also around 1.1780.
As long as there is no close above the 100 SMA (H4) and 1.1780, the pair might struggle in the near term. A proper break could easily take the pair above 1.1800 towards 1.1850.
On the downside, there are two key supports at 1.1680 and 1.1660. These might continue to hold losses in EUR/USD below 1.1650.
To sum up, the pair is trading below a major support at 1.1650 and crucial resistance at 1.1780. Eventually, it may break either support or resistance for the next move.
Greece Current Account
Recently in the Euro Zone, Greece’s current account report for June 2017 was released by the Bank of Greece. The market was looking for a minor trade surplus compared with the same month a year ago.
The actual result was in line with the forecast, as there was a trade surplus of €0.842B, better than the last €-0.582B.
The report pointed out that:
A year-on-year rise of €137 million in the deficit of the balance of goods was mostly attributable to an increase in the deficit of the non-oil balance of goods. It should be noted that non-oil exports of goods rose by 15.3% and oil exports by 17.5% at constant prices.
Overall, the EUR/USD pair may decline a few pips in the short term, but 1.1660 support might prevent losses.
Washington Drama Continues To Weigh On Markets, Investors Await Jackson Hole
In the absence of any significant economic data releases during today’s Asian trading, the political drama surrounding President Trump continued to take central stage. The President fired his chief strategist Steve Bannon on Friday and in that way continued the string of staff shake up in the White House. The key event of this week will be the meeting of central bankers in Jackson Hole towards the end of the week.
Late on Friday, markets got another news out of Washington DC that President Trump fired his far-right chief strategist Steve Bannon and in that way ousted most of his closest allies since taking the office. While some investors saw this as a hope that Trump would become more moderate in his views without the advice of Mr. Bannon that was considered a far-right ideologist, many saw it as a potential hurdle for the President. Market participants are fearful that Mr. Bannon could potentially bring more harm as he would divide the White House by publicly going against those Trump advisors that he considers “globalists”. Mr. Bannon is considering starting a television network that would give him a strong propaganda tool.
Investors will be busy digesting a number of economic data releases from tomorrow, but the spotlight will be the central bankers’ meeting in Jackson Hole that is due to start on Thursday night. Market participants will be mostly interested in speeches by Janet Yellen and Mario Draghi that are due on Friday.
Looking at the reaction in the forex market, the dollar weakened against the yen to last trade at 109.11 yen. The dollar index held onto its early session gains as other major currencies weakened against the greenback. The index was trading at 93.54, up 0.10%, ahead of the European open.
The euro/dollar pair was trading at 1.1738 ahead of the European open, down 0.20%. The pound was also weaker against the greenback with the pair last trading at 1.2854. The aussie fell 0.10% against its US counterpart (last traded at $0.7918) and the kiwi was lower at $0.7308.
The oil-linked loonie weakened in the wake of falling oil prices. Dollar/loonie exchanged hands at 1.2600 ahead of the Asian close.
Oil prices fell during Asian trading, following Friday’s spike amid a tightening rig count. Prices rose around 3.5% after US Baker Hughes data showed a bigger than expected decline in new rig counts. However, prices were pressured today on rising US output despite the slowdown in the drilling activity. Brent was last trading at $52.67 a barrel while WTI was at $48.46.
Gold prices rose to trade at $1,287.48 an ounce ahead of European trading.
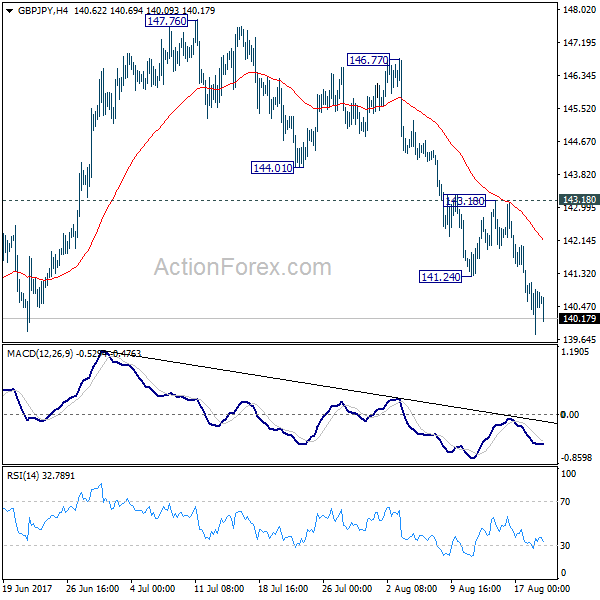
GBP/JPY Daily Outlook
Daily Pivots: (S1) 139.87; (P) 140.47; (R1) 141.17; More
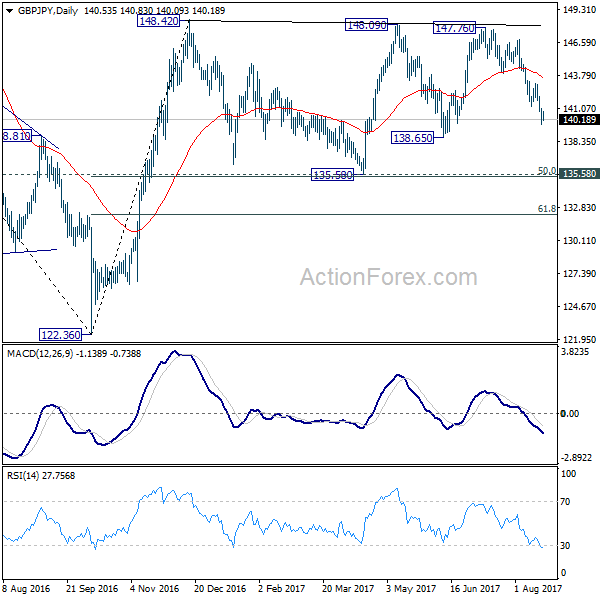
Intraday bias in GBP/JPY remains on the downside as fall from 147.76 is still in progress for 138.65 support first. Break there will extend the decline to 135.58 key support level. At this point, price actions from 148.42 are seen as a sideway consolidation pattern. Hence, we'll expect strong support from 135.58 to contain downside and bring rebound. Nonetheless, break of 143.18 resistance is needed to indicate short term bottoming first. Otherwise, near term outlook will remain bearish in case of recovery.
In the bigger picture, the sideway pattern from 148.42 is extending with another leg. We'd expect strong support from 135.58 and 50% retracement of 122.36 to 148.42 at 135.39 to contain downside. Medium term rise from 122.36 is still expected to resume later. And break of 38.2% retracement of 196.85 to 122.36 at 150.43 will carry long term bullish implications. However, firm break of 135.58/39 will dampen the bullish view and turn focus back to 122.36 low.
EUR/JPY Daily Outlook
Daily Pivots: (S1) 127.71; (P) 128.25; (R1) 128.93; More...
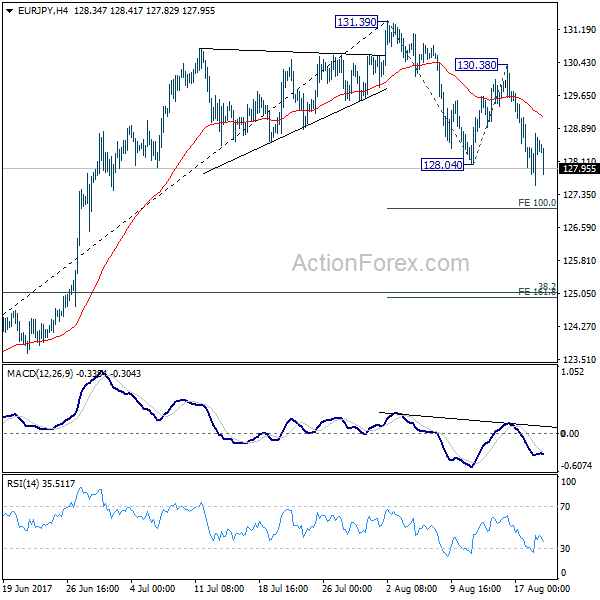
Intraday bias in EUR/JPY remains on the downside for the moment. Current correction from 131.39 correcting whole rise from 141.84 with break of channel support. Deeper decline would be seen to 38.2% retracement of 114.84 to 131.39 at 125.05 before completion. On the upside, break of 130.38 resistance is needed to confirm completion of the pull back. Otherwise, deeper decline is expected even in case of recovery.
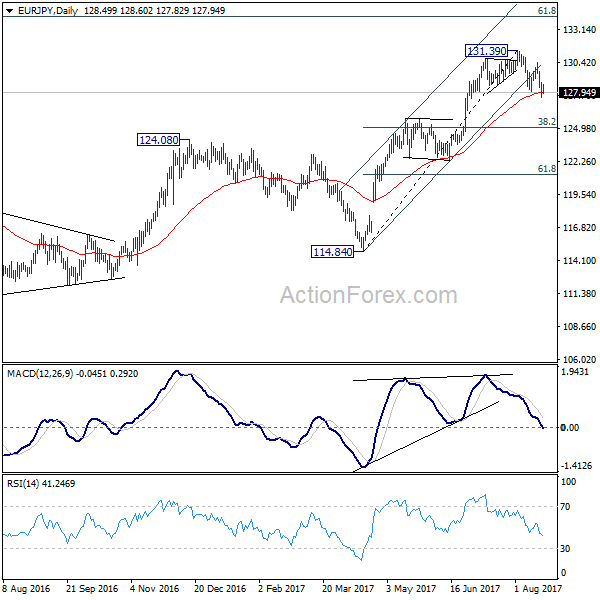
In the bigger picture, the down trend from 149.76 (2014 high) is completed at 109.03 (2016 low). Current rally from 109.03 should be at the same degree as the fall from 149.76 to 109.03. Further rise is expected to 61.8% retracement of 149.76 to 109.03 at 134.20. Sustained break there will pave the way to key long term resistance zone at 141.04/149.76. Medium term outlook will remain bullish as long as 124.08 resistance turned support holds. However, firm break of 124.08 will argue that rise from 109.03 is completed and turn outlook bearish.