
Sample Category Title
Crude Makes A Comeback As Gold KO’Ed At 1300
Crude oil soars nearly 4% on Friday as Saudi Arabia puts the boot in, while gold marks a bearish outside reversal after hitting 1300.
Oil
Oil prices rocketed higher on Friday as Brent and WTI climbed nearly four percent in the New York session. Despite huge inventory drawdown data during the week, oil had continued to fall, and Friday's price action resembled a comeback that Mohammed Ali would have been proud of. The rally was to some extent, driven by short covering in a thin market after heavy selling all week. But the primary driver appears to the news that Saudi Arabia's crude exports have fallen to a three year low of 6.9 million barrels a day.
Along with cutting exports to the United States, the Saudi's appear to be following their forward guidance to the letter having previously said they would cut exports to 6.6 million barrels a day by the end of August. This further cements our view that Saudi Arabia is the swing producer of last resort globally and their apparent intent has been received by markets positively.
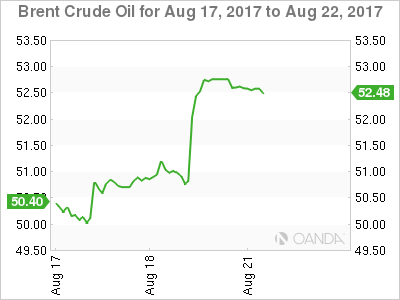
Technically the price action has been very bullish as well with Brent spot smashing through its 200-day moving average and first support at 51.70 to close near its highs at 52.85. The next resistance is the 10th August high at 53.45 and then 54.50.
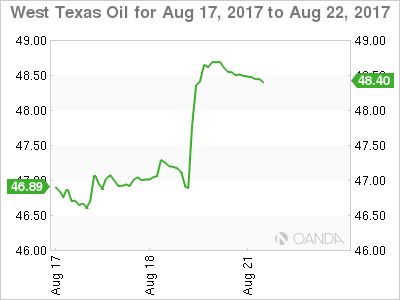
WTI spot trades slightly lower than its Friday close around 48.50 on some post-weekend profit taking having broken up through its 200-day moving average at 47.75 on Friday. It still has more work to do compared to Brent with wood to chop at 49.15 ahead of its 200-day moving average at 49.25 initially. Further resistance is at seen in the 50.00/50.30 zone.
Gold
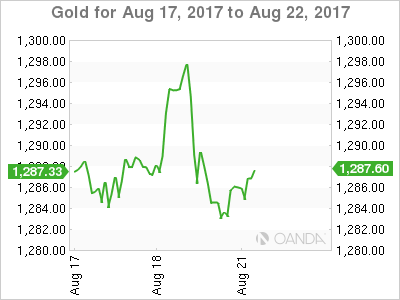
Gold leapt to its 2017 high on Friday, trading up 13 dollars from its open to break the magical 1300.00 level and briefly touch 1301.00. After that, however, the price action was extremely disappointing as it plunged all the way back to finish below its open at 1285.00.
A combination of a weaker dollar, terrorist attacks, and a sell-off in equities certainly helped, but the price action mostly has a stop loss driven short covering look about it. A break of the longer term resistance at 1296.00 triggering stop losses with more seen as options structures at 1300.00 strikes were taken out. The fact that gold did not loiter above 1300.00 speaks volumes as to the drivers of the move higher and the subsequent fall.
Additionally, not weekend risk hedging buying was seen into the New York close. This further reinforces the natural of Friday's rally as if the street has been worried about weekend geopolitics gold would have traded higher into its Friday close.
Unsurprisingly, gold is a couple of dollars lower at 1283.00 this morning with the danger now that more longs will look for the exit on any moves lower. Gold has resistance around 1290.00, but it is the support at 1280.00 initially that traders will be concentrating on more. A break of this level opens further losses to the 1267.00 area.
USD/JPY Daily Outlook
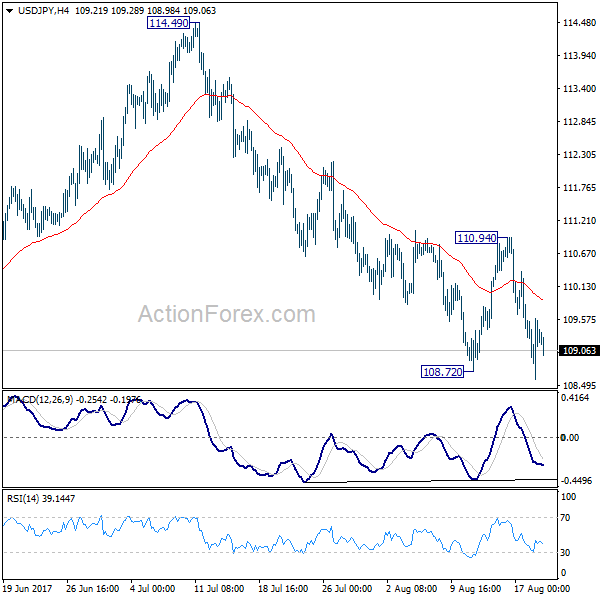
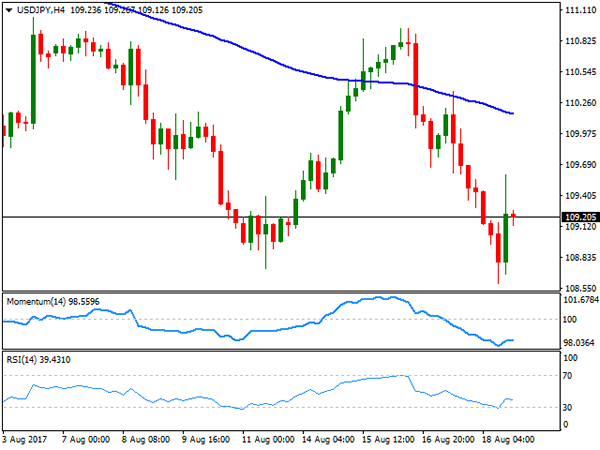
Daily Pivots: (S1) 108.66; (P) 109.13; (R1) 109.65; More...
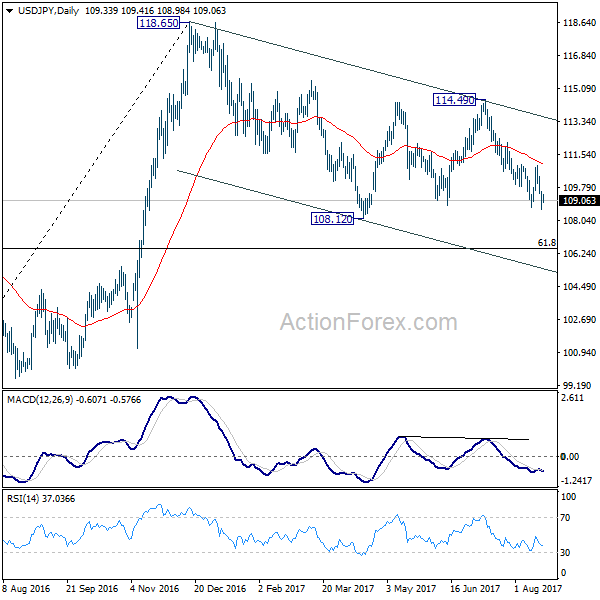
Intraday bias in USD/JPY remains mildly on the downside for the moment as fall from 114.49 is resuming. Such decline would target a test on 108.12 low. Whole corrective decline from 118.65 is possibly resuming and break of 108.12 will target 61.8% retracement of 98.97 to 118.65 at 106.48. On the upside, break of 110.94 is needed to indicate short term bottoming. Otherwise, outlook remains bearish in case of recovery.
In the bigger picture, the corrective structure of the fall from 118.65 suggests that rise from 98.97 is not completed yet. Break of 118.65 will target a test on 125.85 high. At this point, it's uncertain whether rise from 98.97 is resuming the long term up trend from 75.56, or it's a leg in the consolidation from 125.85. Hence, we'll be cautious on topping as it approaches 125.85. If fall from 118.65 extends lower, downside should be contained by 61.8% retracement of 98.97 to 118.65 at 106.48 and bring rebound.
AUD/USD Daily Outlook
Daily Pivots: (S1) 0.7882; (P) 0.7913; (R1) 0.7957; More...
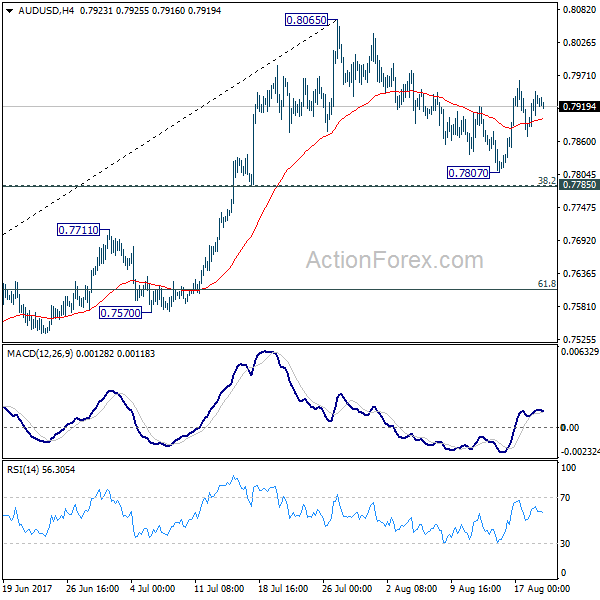
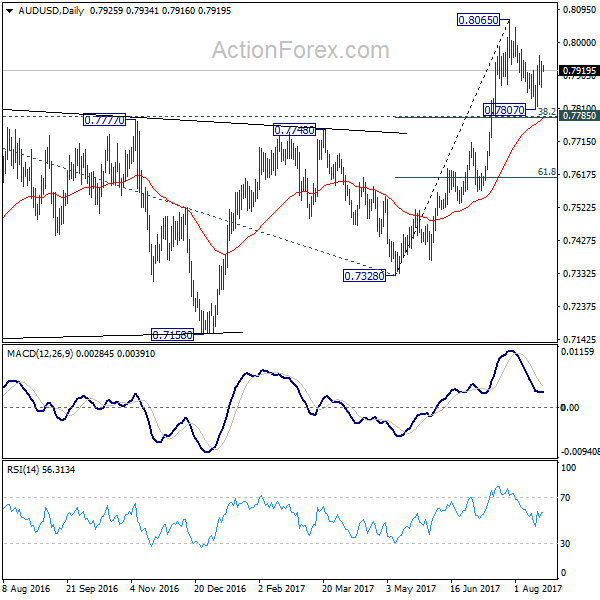
Intraday bias in AUD/USD remains mildly on the upside for retesting 0.8065. The pull back from there should have completed at 0.7807 already. Firm break of 0.8065 will resume the medium term rise and target 100% projection of 0.6826 to 0.7833 from 0.7328 at 0.8335. In case of another fall, we'd continue to expect strong support from 0.7785 cluster support (38.2% retracement of 0.7328 to 0.8065 at 0.7783) to contain downside and bring rebound.
In the bigger picture, rise from 0.6826 medium term bottom is still in progress. At this point, there is no confirmation of trend reversal yet and we'll continue to treat such rebound as a corrective pattern. But in any case, break of 55 month EMA (now at 0.8097) will target 38.2% retracement of 1.1079 to 0.6826 at 0.8451. Break of 0.7328 support is needed to confirm completion of the rebound. Otherwise, further rise is now in favor.
Foreign Exchange Market Commentary: EUR/USD, USD/JPY, GBP/USD, GOLD, WTI CRUDE, DJIA, FTSE100, DAX
EUR/USD
The EUR/USD pair closed the week in the red at 1.1759, after rallying for five consecutive ones, but off the low set on Thursday at 1.1661, following the release of ECB's account of the monetary meeting that took place last July. The document indicated that the ECB is concerned that EUR's strength could delay the timing on reaching their inflation rate of below, but close to 2%. The news came after an early week headline coming from Reuters, indicating that Mario Draghi won't discuss monetary policy in the upcoming Jackson Hole meeting, both pouring cold water on hopes for soon-to-come tapering in the EU. Dollar's gains were limited as the FOMC Minutes, also released this past week, indicated that policymakers are split over what's next for rates, concerned over soft inflation, but still willing to reduce its balance sheet on "an upcoming meeting."
This upcoming week, the release of preliminary Markit August PMIs for Europe and the US will gather most of the market's attention, alongside with the Jackson Hole Symposium, where worldwide policymakers will meet to discuss economic policy. Investors will be looking for clues on tightening, particularly coming from Yellen and Draghi.
Ever since reaching this year's high at 1.0900 late July, the pair has been on retreat mode, but given that the pair has barely eased around 150 pips, it's too early to call for a trend-reversal. The movement remains corrective, mostly due to the absence of dollar's demand, amid softer inflation which reduced chances of a third rate hike for this year. Nevertheless, the corrective movement can extend during the next few days, as in the daily chart, the price has been unable to recover above a horizontal 20 DMA, while a daily descendant trend line coming from the mentioned high stands now around 1.1800. The Momentum indicator in the mentioned chart is losing its bearish strength, but still heading south within negative territory, while the RSI indicator hovers around 55, with no certain directional strength. Shorter term, and according to the 4 hours chart, the pair presents a neutral stance, with technical indicators flat within positive territory and the price trapped between its 20 and 100 SMAs, both directionless. The 1.1820/30 price zone is the key resistance to overcome to open doors for a new leg higher towards the mentioned yearly high.
Support levels: 1.1715 1.1685 1.1650
Resistance levels: 1.1820 1.1860 1.1910
USD/JPY
The USD/JPY pair closed the week unchanged in the 109.20 region, as the positive mood from early week that drove the pair up to 110.02 was quickly reversed after the release of the FOMC Minutes, Trump's advisors woes, and the terror attacks that took place in Europe. Adding to the sour worldwide picture, US political jitters added to yen's strength these last few days, after President Trump lost several advisors in different events. His soft response to a white nationalist attack during the previous weekend put an end to two economic advisory councils, who criticized him for saying that "both sides" were to blame for the Charlottesville incident. Adding fuel to the fire, Trump's chief strategist, Stephen Bannon, left the administration on Friday. Treasury yields trimmed their early week gains to end it flat, with the 10-year note benchmark at 2.19%, a multi-week low. Despite Friday's recovery, the pair maintains its bearish tone, given that in the daily chart, technical indicators resumed their slides after failing to regain positive territory at the beginning of the week, while the price remains well below its 100 and 200 DMAs. Shorter term and according to the 4 hours chart, the pair is well below bearish 100 and 200 SMAs, whilst technical indicators barely corrected oversold conditions before losing their upward strength, also supporting additional declines ahead.
Support levels: 108.80 108.40 107.90
Resistance levels: 109.60 110.00 110.35
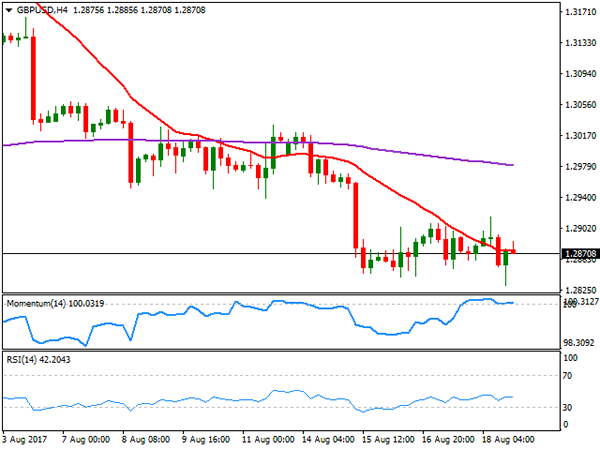
GBP/USD
The GBP/USD pair fell for a third consecutive week to settle at 1.2870 on Friday, although the bearish pressure somehow eased over the last few days, mostly due to self-dollar's weakness. The Pound has been unable to attract buyers ever since BOE's chances of a rate hike fell alongside with inflation expectations. Despite being well above the central bank's 2% target, inflation has been below expected for two consecutive months, taking off the pressure over policymakers. Still, uncertainty surrounding the economic future of the kingdom after the Brexit, undermines demand for Sterling. The pair has been consolidating for three consecutive days, and Friday ended up with a doji, indicating that the BOE's on-hold stance has been fully priced-in, and that the market will now wait for fresher clues to decide what's next. Nevertheless, technical readings keep suggesting further slides ahead as the price settled well below a bearish 20 DMA, whilst technical indicators maintain their bearish slopes, nearing oversold levels. In the 4 hours chart, the technical picture is neutral-to-bearish with the pair stuck around a bearish 20 SMA, the Momentum indicator heading nowhere around its 100 level, and the RSI indicator heading modestly south around 42. The pair bottomed for the week at 1.2831, the immediate short-term support for this Monday.
Support levels: 1.2830 1.2795 1.2760
Resistance levels: 1.2895 1.2930 1.2965
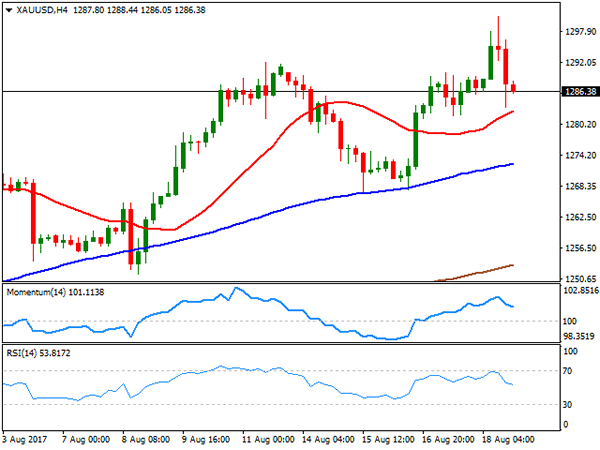
GOLD
Gold prices changed course on Friday, with spot ending the week marginally lower at $1,286.38 a troy ounce after reaching a fresh 2017 high of 1,300.72. The commodity got market's favor during the second half of the past week, amid a dovish tone coming from US policy makers in the form of the FOMC Minutes, and the terror attack that took place in Spain. On Friday, however, equities pared their sell-off, whilst the inability of the commodity to rally pass the psychological threshold of 1,3000 fueled profit taking at the end of the day. From a technical point of view, the daily chart shows that the price remains well above all of its moving averages, with the 20 DMA maintaining a sharp bullish slope far below the current level, while technical indicators remain within positive territory, but losing upward strength and posting lower highs, drawing a bearish divergence that is yet to be confirmed. In the 4 hours chart, the technical picture is quite alike with the price holding above all of its moving averages, whilst technical indicators retreat from overbought levels, with strong bearish slopes, but still above their mid-lines.
Support levels: 1,281.65 1,273.95 1,261.20
Resistance levels: 1,292.10 1,300.90 1,309.25
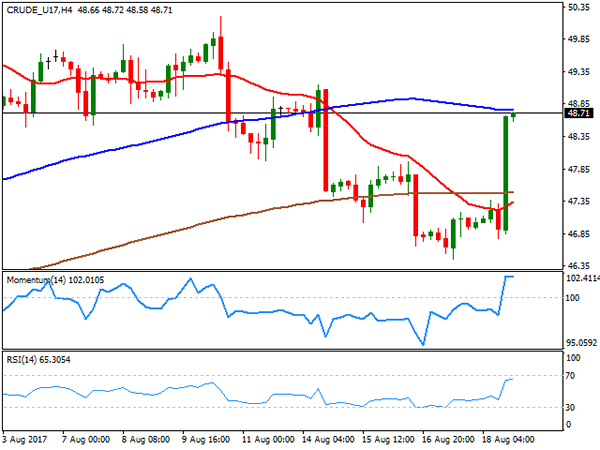
WTI CRUDE OIL
Crude oil prices posted a nice comeback on Friday, with WTI ending the week at $48.71 a barrel, trimming all of its weekly losses amid a string of positive news for the oil market. Following the EIA weekly report that showed a sharp draw-down in US stockpiles, news on Friday revealed that the number of active oil rigs drilling for oil fell by five last week, bringing the total count down to 763, according to Baker Hughes. A broadly weak dollar, also helped WTI that bottomed for the week at 46.45. From a technical point of view, the daily chart shows that the US benchmark settled above its 100 DMA, but below the 20 and 200 DMAs, with the largest having capped July's advance. Technical indicators in the mentioned chart have recovered ground, but the Momentum remains below its 100 level while the RSI aims north around 54, not enough to confirm additional gains ahead at this point. In the 4 hours chart, the commodity closed right below its 100 SMA, the immediate resistance at 48.90, while technical indicators stabilized well above their mid-lines, losing upward strength at the end of the week amid diminishing volumes.
Support levels: 48.15 47.55 46.85
Resistance levels: 48.90 49.60 50.20
DJIA
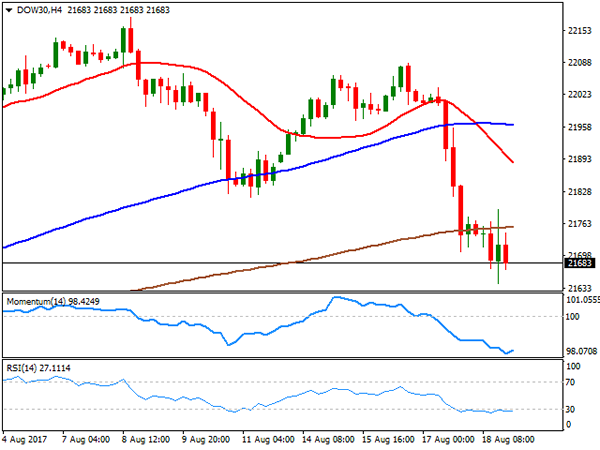
Wall Street closed in the red on Friday, with the Dow and the S&P down for a second consecutive week and the Nasdaq Composite logging its fourth consecutive weekly decline. The Dow Jones Industrial Average lost 76 points, to end at 21.674.51, while the S&P shed 4 points, and ended at 2,425.55. The Nasdaq Composite lost 0.09%, to 6,216.53. Risk aversion led the way lower, amid the terror attack in Spain, alongside with woes in the White House, after several Trump's advisors left the administration this last week. Investors, however, hesitated on how to price-in the latest US political headline, indicating that Trump’s strategist Stephen Bannon departed the White House. Bannon a well-known nationalist, could have been dismissed in an effort to tame warring factions, but it's still another advisor quitting, signaling that internal woes keep interfering with the political agenda. Most members were down within the Dow, with Nike being the worst performer, down 4.37% followed by Cisco System that lost 2.16% Caterpillar was the best performer, adding 0.69%, followed by Chevron and Exxon Mobile, which added around 0.50% each on oil's recovery. Dow's decline is poised to extend according to technical readings in the daily chart, as indicators keep heading south at multi-month lows, whilst the index extended further below its 20 DMA. In the 4 hours chart, technical indicators stabilized within oversold territory, whilst the index stands below all of its moving averages, 200 SMA contained advances by the end of the week, currently acting as dynamic resistance at 21,757.
Support levels: 21,642 21,603 21,566
Resistance levels: 21,710 21,757 21,790
FTSE100
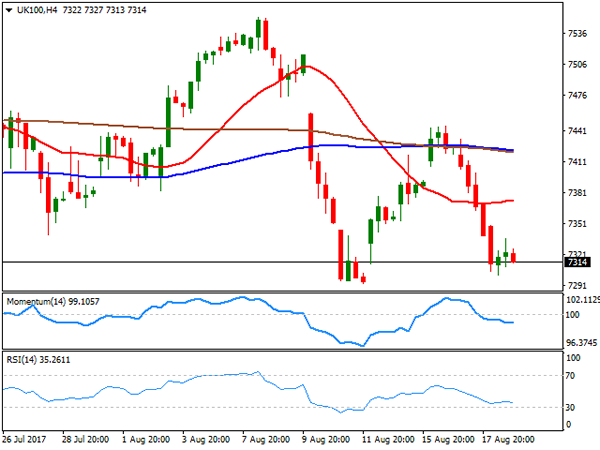
The FTSE 100 fell 63 points or 0.86% on Friday to end the week at 7,323.98, undermined by declines in airlines and travel companies-related equities, following the terror attack in Barcelona from late Thursday. A persistently weak Pound, also hit the Footsie, with only eight members managing to close the day with gains. Randgold Resources was the best performer, up 1.22%, amid a rally in gold prices. Paddy Power Betfair, on the other hand, was the worst performer, ending the day 3.95% lower, followed by Babcock International Group that lost 2.98%. The daily chart shows that the index settled not far above a weekly low of 7,293, also that it failed mid-week to advance beyond a bearish 20 DMA, whilst technical indicators head south within negative territory, all of which maintains the risk towards the downside for the upcoming days. In the shorter term, and according to the 4 hours chart, technical readings also favor a bearish continuation, as the index stands far below all of its moving averages, whilst technical indicators stand well below their mid-lines, although with limited directional strength.
Support levels: 7,293 7,257 7,218
Resistance levels: 7,337 7,369 7,401
DAX
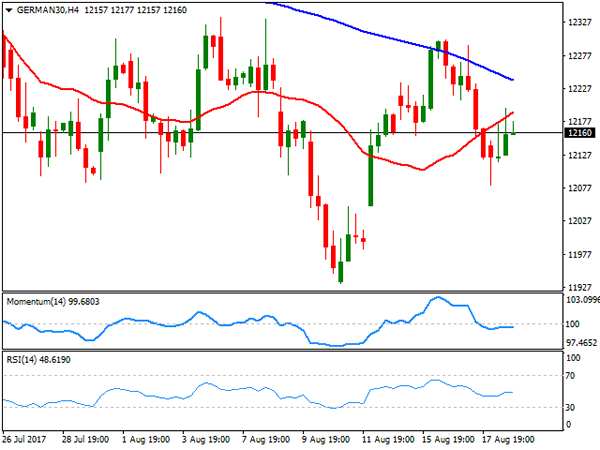
European equities ended in the red, dragged lower by travel-related stocks that plunged after the Barcelona attack, with investors confidence also dented by Trump´s administration woes. The German DAX lost 38 points to end at 12,165.19, with Merck leading decliners, down 1.54%, followed by Fresenius that shed 1.25%. Muenchener was the best performer, adding 1.55%, followed by Commerzbank that gained 1.24%. The daily chart for the benchmark shows that it settled right below a bearish 20 SMA, but also that technical indicators have lost their bearish strength, aiming higher around their mid-lines. Shorter term, however, the risk remains towards the downside, as in the 4 hours chart, the index remains below all of its moving averages, with the 100 and 200 SMAs gaining bearish momentum, whilst technical indicators head nowhere right below their mid-lines. The index bottomed at 12,081 early Friday, with a break below it exposing the 12,000 threshold for early next week.
Support levels: 12,127 12,081 12,034
Resistance levels: 12,126 12,263 12,310
USD/CAD Daily Outlook
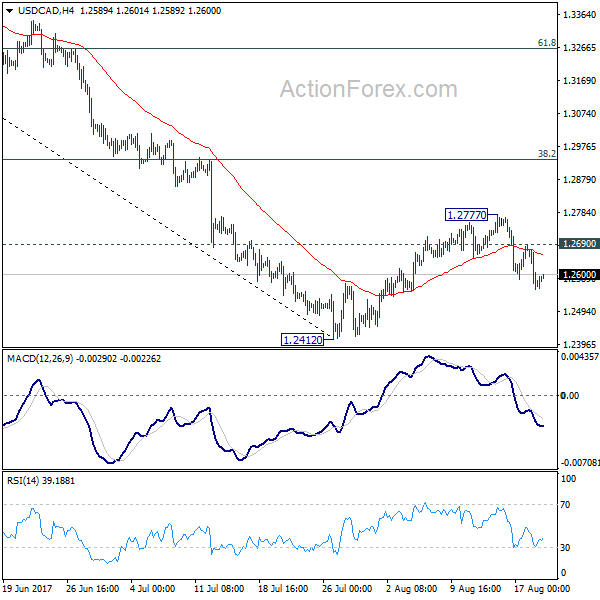
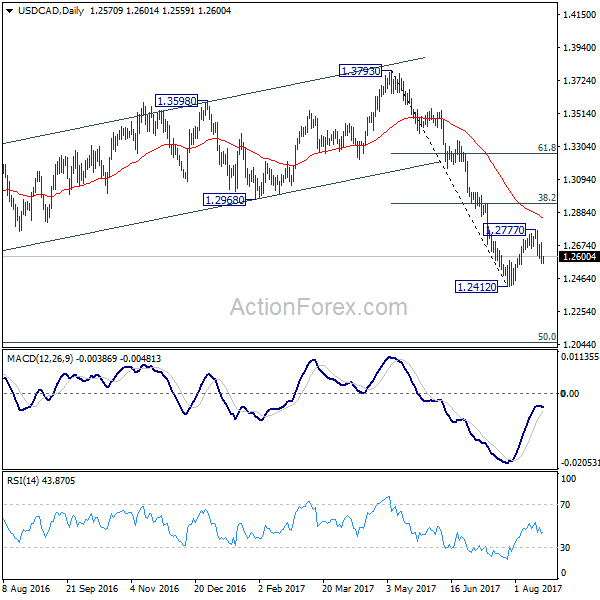
Daily Pivots: (S1) 1.2618; (P) 1.2650; (R1) 1.2714; More....
Intraday bias in USD/CAD remains on the downside for the moment. As noted before, corrective recovery from 1.2412 could have completed at 1.2777 already. Deeper decline would be seen back to 1.2412 low first. Break there will resume the larger decline and target next long term fibonacci level at 1.2048. On the upside, above 1.2690 will extend the correction from 1.2412 with another rise. But we'd expect upside to be limited by 38.2% retracement of 1.3793 to 1.2412 at 1.2940 to bring fall resumption eventually.
In the bigger picture, price actions from 1.4689 medium term top are seen as a correction pattern. Such corrective fall is still expected to extend to 50% retracement of 0.9406 to 1.4869 at 1.2048. At this point, we'd look for strong support from there to contain downside and bring rebound. Nonetheless, on the upside, sustained break of 1.2968, 38.2% retracement of 1.3793 to 1.2412 at 1.2940 will be the first sign of completion of the correction and will turn focus back to 1.3793 key resistance.
Markets Tread Water, Looking through US-South Korea Military Exercise to Jackson Hole
The financial markets started the week relatively quietly. US and South Korea have kicked off the join annual military exercise today. North Korea warned that the drills would worsen the tensions by "throwing fuel on fire". But markets have little reaction to the news so far. Yen is trading mildly higher, possibly because of that, but strength is limited. On the other hand, European majors are broadly softer. The economic calendar is rather light today. UK Rightmove house price index dropped -0.9% mom in August. Japan all industry activity index rose 0.4% mom in June, in line with expectations. Canada wholesale sales is the only other notable featured data. Markets will have one eye on the developments in the White House, and another eye looking forward to Jackson Hole symposium later in the week.
Economists expected Cohn as front-runner to replace Yellen
In US, there are some findings from a survey by the National Association for Business Economics, polled 184 economists from July 18 to August 2. Only 17% expected Fed Chair Janet Yellen would be offered a second term when the current four-year term ends next February. 67% expected that Yellen will be replaced while 16% don't know. Among the contenders, 49% expect White House economic adviser Gary Cohn would be picked for the top Fed job. That's a wide margin from former Fed Governor Kevin Warsh's 9% as second. However, it should be noted that the survey was done way before US President Donald Trump's controversial remarks on the Charlottesville clash between Neo Nazi and counter protestors. Cohn was rumored to quite White House last week but denied.
The same survey showed that the respondents are "quite pessimistic about prospects for 'meaningful, revenue-neutral tax reform' in the near term." The survey showed only 10% chance of such legislation this year and 15% chance in 2018. Meanwhile, over 50% said Trump's tax reform will eventually add less than 1% to real GDP growth over the next decade. A third said that impact would be between 1-2%.
Regarding Fed's unwinding of balance sheet, 41% expect 10 year yield to rise by just 0.5% or less. 25% expect the jump in yield to be 0.75%-1.00%. NABE President Stuart Mackintosh noted that "the overall view of the panel is that the likely interest-rate impact of the Federal Reserve's balance sheet normalization is fairly benign."
UK stepped up pressure on EU on Brexit trade negotiations
In UK, Prime Minister Theresa May's government declared that it's stepping up pressure on EU to move the Brexit negotiation into trade agreements as soon as October. Brexit Secretary David Davis warned in an article in the Sunday Times that "with the clock ticking, it wouldn't be in either of our interests to run aspects of the negotiations twice." And, he argued that "it is simply not possible to reach a near-final agreement on the border issue until we've begun to talk about how our broader future customs arrangements will work." "Furthermore, if we get the comprehensive free trade agreement we're seeking as part of our future partnership, solutions in Northern Ireland are easier to deliver." EU's chief Brexit negotiator Michel Barnier responded by tweeting that the quicker an agreement was found on the breakup topics "the quicker we can discuss customs & future relationship."
UK government started releasing a series of policy documents, covering topics such as Northern Ireland and the customs union, for Brexit negotiations, since last week. A paper titled "Future Customs Arrangements" released last week triggered demand from businesses for a plan to replace customs union, an arrangement that allows movements of goods across the borders of EU member states without tariffs. Without proposing an concrete and feasible alternative, the paper indicated that leaving the EU represents leaving the EU Customs Union, and the government seeks a new arrangement that "facilitates the freest and most frictionless trade possible in goods between the UK and the EU".
The next round of Brexit talks, which start on 29 August.
Jackson Hole as main focus with few top-tier data featured
Looking ahead, the focus of the week is on the Kansas City Fed's Jackson Hole symposium beginning on Thursday evening. Key financial officials of major economies would be speaking. ECB President Mario Draghi is due to speak on Thursday and Fed Chair Janet Yellen on Friday. Yellen's comment on financial stability is expected to set the tone for the US dollar and US Treasuries in the near-term. The FOMC minutes for the July meeting unveiled that some policymakers maintained the stance to hike interest rates further later this year, despite weak inflation. We would look to see if Yellen is in this camp.
Few top-tiered macroeconomic data would be released this week. In the US, the flash Markit manufacturing and services PMIs for August would be released on Wednesday, followed by existing home sales in July on Thursday and the preliminary reading durable goods orders in July on Friday. In the Eurozone, the ZEW survey would be due Tuesday, followed by flash PMI readings for the bloc and individual countries on Wednesday. Wednesday also comes the European Commission's flash consumer confidence index for August. Germany, the Eurozone's biggest economy would release its first composition of GDP growth estimate for 2Q17, as well August's IFO survey, on Friday. The Asia focus is on Japan, where the manufacturing PMI as well as inflation data for August would be released this week.
Here are some highlights for the week ahead:
- Tuesday: Swiss trade balance; UK public sector net borrowing; German ZEW; Canada retail sales; US house price index
- Wednesday: Japan PMI manufacturing; Eurozone PMIs; US PMIs, new home sales
- Thursday: New Zealand trade balance; UK GDP revision; US jobless claims, existing home sales
- Friday: Japan CPI; German GDP final; US durable goods
USD/CAD Daily Outlook
Daily Pivots: (S1) 1.2618; (P) 1.2650; (R1) 1.2714; More....
Intraday bias in USD/CAD remains on the downside for the moment. As noted before, corrective recovery from 1.2412 could have completed at 1.2777 already. Deeper decline would be seen back to 1.2412 low first. Break there will resume the larger decline and target next long term fibonacci level at 1.2048. On the upside, above 1.2690 will extend the correction from 1.2412 with another rise. But we'd expect upside to be limited by 38.2% retracement of 1.3793 to 1.2412 at 1.2940 to bring fall resumption eventually.
In the bigger picture, price actions from 1.4689 medium term top are seen as a correction pattern. Such corrective fall is still expected to extend to 50% retracement of 0.9406 to 1.4869 at 1.2048. At this point, we'd look for strong support from there to contain downside and bring rebound. Nonetheless, on the upside, sustained break of 1.2968, 38.2% retracement of 1.3793 to 1.2412 at 1.2940 will be the first sign of completion of the correction and will turn focus back to 1.3793 key resistance.
Economic Indicators Update
| GMT | Ccy | Events | Actual | Forecast | Previous | Revised |
|---|---|---|---|---|---|---|
| 23:01 | GBP | Rightmove House Prices M/M Aug | -0.90% | 0.10% | ||
| 4:30 | JPY | All Industry Activity Index M/M Jun | 0.40% | 0.40% | -0.90% | -0.80% |
| 12:30 | CAD | Wholesale Sales M/M Jun | -0.20% | 0.90% |
EURUSD In Consolidation Phase Below 1.18, Maintains Overall Bullish Picture
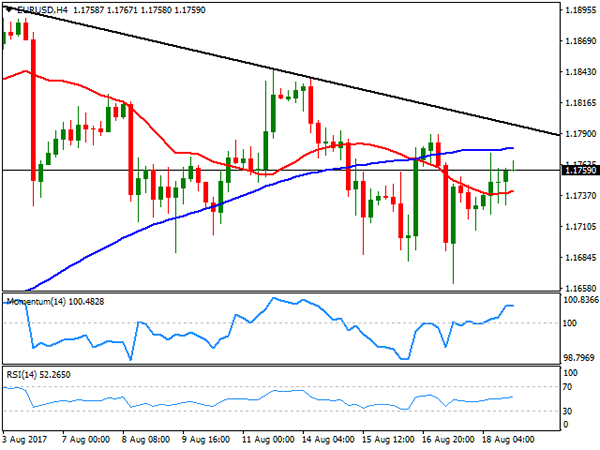
EURUSD has shifted to a neutral bias after a bullish run from the 200-day moving average (MA) in May. The pair reached a high of 1.1909 on August 2 when the market failed to push higher after reaching overbought levels, as RSI rose above 70.
EURUSD has now entered a consolidation phase with immediate resistance at 1.1800. Recent price action shows firm support at 1.1652. This level is the 23.6% Fibonacci retracement of the uptrend from 1.0822 to 1.1909 (April 24 to August 2 rise). A daily close below this level could bring about a fall towards 1.1491 (38.2% Fibonacci) before reaching 1.1364 (50% Fibonacci). A deeper decline would weaken the overall bullish structure on the daily chart.
A break above 1.1800 shifts the focus back to the upside for a re-test of the August 2 peak of 1.1909, opening the way for a move up to the 1.2000 area.
The overall trend structure shows that the bull run is expected to remain intact, with EURUSD rising in an ascending channel. The crossover of the 50-day MA above the 200-day MA on May 23 confirms the bullish outlook. While the momentum indicators (RSI and MACD) are still in bullish territory, they are suggesting fading upside strength and range trading is expected in the near-term.
Market Update – Asian Session: S. Korea And US Start Drills
Asia Summary
Asian equity markets opened mixed with little macro data to push FX in a particular direction and little concern for the departure of Steve Bannon from the Trump administration. Regional equity indices took the que from earnings results, which continue with earnest in Hong Kong, China and Australia. Australia names saw some large double digit moves after results (see equity section), with Fortescue in focus after dividend payout adjustment. Offshore yuan nears a fresh 2017 record high, + 0.07% at 6.6786 (2017 high is currently 6.6579) and yuan overnight HIBOR fell 65bps to 1.42%. Thailand posted a stronger than expected Q2 GDP figure, also a 4-yr high. South Korea and the US prepare for its annual joint military drills, President Moon called for calm after North Korea said the drills would be adding fuel to the fire. USD/KRW fell 0.2% to 1,130.20. Later in the week the annual Jackson Hole conference will take place, where ECB's Draghi may make a case to end QE in 2018.
Key economic data
(KR) SOUTH KOREA JUL PPI M/M: +0.1% V -0.4% PRIOR; Y/Y: 3.0% V 2.8% PRIOR
(NZ) New Zealand Jul Net Migration: 5.8K v 6.3K prior
(UK) AUG RIGHTMOVE HOUSE PRICES M/M: -0.9% V 0.1% PRIOR; Y/Y: 3.1% V 2.8% PRIOR
(TH) THAILAND Q2 GDP Q/Q: 1.3% V 1.0%E; Y/Y: 3.7% V 3.4%E (fastest pace in 4-yrs); Raises 2017 projected GDP to 3.5-4.0% (prior 3.3-3.8%)
Speakers and Press
China/Hong Kong
(HK) Cash withdrawals using China UnionPay cards migrating from Macau to Hong Kong – SCMP
(HK) Hang Seng Indexes discussed lowering the weighting limit for stocks, in 2014, the weighting limit was cut to 10% from 15% - HK Press
(CN) PBoC Vice Gov Yin Yong said financial regulators should step up penalties in relation to regulatory arbitrage – financial press
Korea
(KR) On Sunday, North Korea warned that the upcoming US/South Korea military exercises will be ‘adding fuel to the fire' – US press
Japan
(JP) Bank of Japan (BoJ) Gov Kuroda said the central bank has methods to avoid adverse effects when it normalizes policy; wants to avoid creating confusion by discussing specifics – Japanese Press
Other
(DE) German Finance Ministry Aug Report: Monthly data suggests further economic expansion, indicators suggest industrial sector will continue to grow in Q3
(EU) ECB's Draghi may make a case to end QE in 2018 at Jackson Hole this week due to large fall in EU unemployment, increase in growth and progress to inflation target - financial press
Asian Equity Indices/Futures (00:00ET)
Nikkei -0.4%, Hang Seng +0.5%, Shanghai Composite +0.2%, ASX200 -0.7%, Kospi -0.04%
Equity Futures: S&P500 -0.1%; Nasdaq100 -0.1%, Dax -0.1%, FTSE100 -0.3%
FX ranges/Commodities/Fixed Income (00:00ET)
EUR 1.1764-1.1750; JPY 100.42-109.18; AUD 0.7935-0.7919; NZD 0.7323-0.7305
Dec Gold -0.0% at $1,291/oz; Oct Crude Oil 0.0% at $48.66/brl; Sept Copper +0.0% at $2.95/lb
JGB (JP) Japan MoF said to field additional queries over JGBs from foreigners - Japanese Press
(AU) Australia sells A$800M in 2.75% 2028 bonds; avg yield 2.6998%; bid-to-cover 2.99x
USD/CNY *(CN) PBOC SETS YUAN REFERENCE RATE AT 6.6709 V 6.6744 PRIOR
(CN) China PBOC OMO injects CNY180B v CNY120B in 7 and 14-day reverse reports prior: net drains CNY50B v injects CNY20B prior
(KR) South Korea sells KRW 0.6T in 6-month monetary stabilization bonds; avg yield 1.34% v 1.33% prior
(KR) South Korea sells 20-yr bonds; avg yield 2.38%
Equities notable movers
Hong Kong/China
1193.HK Reports H1 Net HK$2.11B v HK$1.96B y/y, Rev HK$17.7B v HK$15.4B y/y; -9.4%
China Unicom, 762.HK Announces 9.04B shares placed at CNY6.83/shr for CNY61.73B; +8%
Australia
BHP.AU Expected to announce a $0.84/shr, $4.0B dividend this week with FY17 results - UK press
GBT.AU Reports prelim FY17 Op EBITDA A$12.2M v A$20M y/y; Rev A$88.0M v A$108.1M y/y; -23%
VOC.AU Ends takeover talks with KKR and Affinity; Guides FY18 Underlying EBITDA A$370-390M v A$380Me, Rev A$1.9-2.0B v A$1.90Be; -23%
BSL.AU Reports FY17 underlying Net A$650.8M v A$674Me; Rev A$10.63B v A$9.07B y/y; Names Mark Vassella new CEO, Announces A$150M share buyback program; -22%
Taiwan
3673.TW Speculation Apple could add 30% of iPad orders to TPK and General Interface Solution - Taiwanese Press; +0.8%
Geopolitical Risks Continue To Weigh On Monday
- US, South Korean military exercises threaten to flare up tensions this week;
- Jackson Hole Symposium eyed as Yellen and Draghi give their views.
Europe is set for a slightly negative start on Monday, threatening to extend its losing streak to three sessions as political and geopolitical risk continue to weigh on risk appetite.
Geopolitical risk could rear its ugly head again this week as the US and South Korea begin planned military exercises on Monday, just as tensions between the North and these two countries appear to have calmed. Should North Korea respond in kind, then we could see a repeat of the safe haven rush from a couple of weeks ago when the situation previously flared up between the countries.
The political situation in the US is another one to watch, with it taking over the reins last week as reports circulated that Donald Trump was about to lose one of his most important members of staff – Gary Cohn – but instead it was Steve Bannon that made way. While this is seen as far more palatable for investors, it still caps off yet another troubling week for the President.
This week could get off to a slightly slower start - barring any escalation between the US and North Korea or in Washington – with the bulk of this weeks scheduled economic events coming later on. The Jackson Hole Symposium is the obvious event people will be most interested in, with both Federal Reserve Chair Janet Yellen and ECB President Mario Draghi making an appearance.
Both central banks are on the cusp of announcing measures aimed at reducing monetary stimulus in the coming months, the question is whether they will use this platform to prepare the markets for such a move. Reports last week suggested that Draghi is unlikely to take the opportunity given how the markets have misinterpreted previous remarks, an odd decision given the number of times the central bank has claimed its not interested in this. Still, we can expect investors to pay very close attention to what he says and respond accordingly.
Yellen may not be so secretive on the other hand, given how open her colleagues have been when discussing plans to start reducing the Fed’s balance sheet, which currently stands at close to $4.5 trillion. Traders, though, may be more interested in hearing whether the latest inflation data has changed the view within the Fed on raising interest rates again this year, with markets currently unconvinced, to say the least.
US Equities Rebounded Slightly
Market movers today
There are no big market movers today. However, later this week focus will turn to euro area PMI for August and not least the Jackson Hole Symposium hosted by the Kansas City Fed from Thursday-Saturday. ECB President Mario Draghi is set to be among the speakers for the first time in three years. In 2014, he hinted at QE and now the focus is on tapering signals. We expect him to deliver a dovish message and to not give any new communication on the issue of tapering of asset purchases. See Euro Area Research: Draghi returns to Jackson Hole with a dovish message, 18 August 2017. When it comes to the Fed, we do not expect anything dramatic. We look for a repeat of signals that the announcement on balance sheet reduction will come relatively soon (likely September) and that one more rate hike is st ill the base case this year – as signalled by Vice President Bill Dudley last week.
Selected market news
Canadian CPI figures rebounding to 1.2% y/y in July (consensus at 1.2%) on Friday, but remains below the Bank of Canada's (BoC) forecast of 1.3% for Q3 17. More importantly, the BoC's preferred measure for core inflation rises further as t he t rimmed mean and median measures rises. The summer months have shown a significant change in the BoC's rhetoric. As we entered summer, markets were pricing in a 25% probability of a summer cut (among other things on falling inflation). Meanwhile, as summer-end approaches, we have had an actual 25bp hike and the BoC's communication highlight s a strong belief in the output gap being closed soon, i.e. the belief in inflationary pressures rising eventually requires inflation disappointments before the BoC will stop its hiking cycle. Overall, Friday's print makes another hike this autumn very likely.
University of Michigan Consumer Confidence for August came out strong on Friday, increasing to 97.6 from 93.4 in June and beating consensus of 94.0 . This adds to signs showing some re-acceleration into H2 17. The details were also strong with US consumer expectations surging. The inflation expectations for one year were unchanged, while 5-10 year inflation expectations fell slightly from 2.6% to 2.5% over the past month.
US equities rebounded slightly on Friday after the White House announced that Stephen Bannon would be leaving his role as Donald Trump's Chief Strategist, capping a tumultuous period for the Trump Administration. Investors interpret ed Bannon's departure as a removal of a powerful advocate for a protectionist agenda and direct confrontation with China over trade.
UK Prime Minister Theresa May's government is preparing to give more details of its Brexit plans this week. The government plans to publish two papers today and more is expected over the following days.