Sample Category Title
Canadian Existing Home Sales Fell For The Fourth Straight Month In July
For the 24 hours to 23:00 GMT, the USD rose 0.22% against the CAD and closed at 1.2753.
Macroeconomic data showed that Canada’s existing home sales eased 2.1% on a monthly basis in July, dropping for the fourth consecutive month. In the previous month, existing home sales had recorded a fall of 6.7%.
In the Asian session, at GMT0300, the pair is trading at 1.2761, with the USD trading 0.06% higher against the CAD from yesterday’s close.
The pair is expected to find support at 1.2728, and a fall through could take it to the next support level of 1.2695. The pair is expected to find its first resistance at 1.2786, and a rise through could take it to the next resistance level of 1.2811.
The currency pair is showing convergence with its 20 Hr moving average and above its 50 Hr moving average.

Elliott Wave View: Dow Future 3 Waves Pullback
Short term Dow Futures (YM_F) Elliott Wave view suggests that rally from 6/29 low is unfolding as a a double three Elliott wave structure. Up from 6/29 low (21138), Minor wave W ended at 22132 and pullback to 21790 ended Minor wave X. Rally from there is unfolding as an impulse Elliott wave structure. Up from 21790, Subminutte wave i ended at 21884, Subminutte wave ii ended at 21815, Subminutte wave iii ended at 21988, Subminutte wave iv ended at 21946, and Subminutte wave v of (a) ended at 22034. Minutte wave (b) is in progress to correct cycle from 8/11 low in 3, 7, or 11 swing before the Index resumes the rally. We don’t like selling the proposed pullback and expect buyers to appear once Minutte wave (b) pullback is complete in 3, 7, or 11 swing provided pivot at 21787 low stays intact.
Dow Future 1 Hour Elliott Wave Chart
Double Three is the most important pattern in the new Elliott wave theory and probably the most common pattern in the market these days. Double three is also known as a 7 swing structure. It is a very reliable pattern that gives traders good opportunity to trade with a well defined invalidation level and target areas. The image below shows what Elliott Wave Double Three looks like. It has (W), (X), (Y) labels and an internal structure of 3-3-3, which means that all 3 legs has corrective sequences. Each (W) and (Y) is made of 3 waves oscillations & has structure of A, B, C or another W, X, Y of a lesser extent.
Q: What G-7 Economy Had Fastest GDP Growth in Q2? A: Japan
A better-than-expected GDP report for the second quarter extends Japan's longest winning streak in a decade but it does not mean that the BoJ is ready to join other major central banks in dialing back accommodation.
Steady Growth
Japan's economy expanded at an annualized pace of 4.0 percent in the second quarter, and in so doing it extended the number of consecutive quarterly expansions to six - the longest winning streak in more than a decade.
In 2016, when the current winning streak began, the Japanese expansion was largely driven by a heavy reliance on trade. Domestic demand was soft and an inventory drawdown weighed on GDP growth, which left many market-watchers wondering whether the world's third-largest economy could export its way back to prosperity.
Domestic demand picked up substantially in the second quarter as growth was driven by consumer spending as well as business fixed investment spending, both of which posted their largest quarterly increases in years and together boosted the headline GDP growth rate by 4.8 percentage points. A slower pace of drawdown in inventory investment also helped with a small 0.2 percentage point boost to overall growth. Were it not for a 1.3 percentage point drag from net exports, top-line GDP growth might have had a 5-handle.
Going into today's report, our full-year 2017 forecast for GDP growth in Japan was 1.2 percent. This better-than-expected outturn for the second quarter suggests upside risk and will likely prompt us to revise that forecast higher at our next scheduled forecast update in September.
Any Implications for the Bank of Japan?
The Bank of Japan (BoJ) is not quite in synch with world's major foreign central banks at present. The Fed is in a rate tightening cycle, the Bank of Canada raised rates in July with another hike expected this year. The European Central Bank is widely expected to announce plans to dial back its asset purchase program, and the Monetary Policy Committee at the Bank of England has been divided in recent meetings over whether and when to raise rates in the United Kingdom. Despite this backdrop, which can be collectively described as "less accommodative," the Bank of Japan has not budged in terms of it intended course.
At its July meeting, the BoJ made no change to that stance and even lowered its inflation forecast. The June CPI numbers for Japan were unchanged at 0.4 percent while core CPI showed no change over the past year. The August CPI figures will print between now and the September 20-21 meeting of the BoJ, but the Tokyo-CPI report for August, which tends to lead country-wide prices already, came in at just 0.1 percent, year over year. With inflation still well-below target, we do not expect the BoJ to signal any substantive change in its comprehensive package of monetary policy accommodation.
Market Morning Briefing: Sharp Rise In Dollar-Yen Above 109.70
STOCKS
Almost all major indices are trading near support and resistance levels. We would have to wait for a couple of sessions to get confirmation on further direction.
Dax (12177.04, +0.10%) has bounced from immediate weekly support levels of 11940 and while that holds, the index may try to come up towards 12300-12500 in the next couple of weeks.
Dow (21998.99, +0.02%) could be headed towards 21800 while the resistance near 22200 holds. Medium term trade region is possible within the 21800-22200 levels.
Nikkei (19756.77, +0.02%) is trading just above immediate support near 19450. If this holds, we could see a bounce back towards 20000; else a fall below 19450 could take it lower towards 19250 levels in the medium term.
Shanghai (3234.99, -0.50%) is testing near term support on the weekly charts at 3200 and while that holds, a bounce back towards 3300 is possible. Note that in case 3200 breaks on the downside, fresh fall towards 3150 could open up.
The bounce from 9680 levels in Nifty (9794.15, +0.86%) seems to be holding well for now. But while below 9900, we do not negate further chances of a dip towards 9600 or lower. Note the current bounce could take it upto 9850 before another dip is seen.
COMMODITIES
Gold (1279) is struggling to rise above the 1300 regions and only a break above that may open up the higher targets of 1327. Crucial supports are poised at 1258 and 1230 levels. In case the Support at 1230 breaks, there will be a further dip to 1210 and 1188 levels respectively.
Silver (16.66) stands comparatively strong due to the recent strength in copper prices. Immediate resistance poised at 17.10 and 17.50 levels. Only a close below 16.60 could open up 16.05 and 15.80 levels respectively. We might see significant fall in Silver if there will be any short term price correction in Copper towards sub 2.85 levels.
Muted price action has been seen in Copper (2.88). Midterm resistance comes at 3.12 regions and support is at 2.85 levels. We will remain bullish on copper while it is trading above 2.85 regions.But a daily close below 2.85 could open up 2.78 and 2.67 levels respectively.
Brent (51.05) and WTI (47.74) are trading within the ranges of 49.50-53 and 47-50 respectively. We will remain bullish on Brent and WTI, while they are trading above 49 and 47 levels on a weekly closing basis.Today we have U.S crude oil inventory at 8:00 pm with an expectation of -3.0 MB.
FOREX
Good gains overnight by the US Dollar (Dollar Index 93.82) after a stronger than expected US Retail Sales (+0.6%, against expectation of +0.4%) and a comment by Bill Dudley of the New York Fed that he favours one more rate hike. Still, be careful of important Resistance in the 94.00-94.50 region.
The Euro (1.1740) may well dip to 1.1640 over this week or the next. Unless there is a strong bounce from that level, there could be danger of deeper decline towards 1.1540 or lower.
Sharp rise in Dollar-Yen (110.67) above 109.70 which seems to be breaking out of the near-term downtrend that was in place from 114.50 (mid-July). As hinted on Monday, maybe we have to give more time to a sideways trend in Dollar-Yen.
The Euro-Yen (129.86) has done well to remain above the crucial Support at 128. As mentioned earlier, a fresh rise past 130 could rekindle the "Risk-ON" trade.
Need to watch the Pound (1.2863) carefully here as it trades below the 1.29 support mentioned on Monday, but on a trendline Support coming up from the low of 1.2106 (14th March). A bounce from here is possibly more likely than a break of Support.
The Aussie (0.7830) fell to a low of 0.7807 yesterday instead of building on its bounce from 0.7830. We may see a test of 0.7790 on the downside while below 0.7870-90.
Dollar-Rupee quotes at 64.35/40 on the NDF market after Independence Day holiday yesterday and close at 64.1150/1250 on Monday.
INTEREST RATES
The US 10Yr (2.266%) has seen a sharp uptick after the New York Fed's Bill Dudley said he favours one more rate hike. A test of Resistance at 2.30-32% is likely in the near term, which may hold for now.
The German-US 10Yr Spread (-1.831%) has dipped to channel Support near current levels. We need to see if there is a bounce from here or not.
Japanese 10Yr (0.05%) remains in the overall downtrend that is in place from levels just above 1.90%, back in mid-2007. A slow grind down towards 0.03% might be considered.
The UK 10Yr Gilt (1.083%) might have Support near current level. But, we need to see, over the next couple of days, if there is a bounce from here or not. If not, the Pound could weaken rather than bouncing as the UK-US 10Yr Spread (-1.177%) is moving in favour of the Dollar.
Short Dollar Squeeze Continues
Short Dollar Squeeze continues
Tempered North Korean rhetoric a hawkish Fed Dudley and a resurgent US consumer has provided an undercurrent of dollar positivity and a subtle squeeze on dollar shorts.
Never underestimate the spending power of the US consumer as American’s open their wallets with a positive start to Q 3 contributing to a higher retail sales headline strength and core retail sales prints, with 10 of 13 sub categories improving on the month.
Japanese Yen
USDJPY was the stand out benefactor of the de-escalation of North Korean rhetoric as haven hedges unwound and newly minted dollar longs were established on a hawkish shift in Fed language amid a backdrop of firming risk appetite. But given that the US and South Korea have military drills scheduled for next week, which could ratchet up the disruptive rhetoric, traders may wait for the dust to further settle before over committing to the current move. Nonetheless, the chart does look tempting given the last couple of ventures into the 108 handle resulted in aggressive retracement rallies back above 114 level.
Euro
EURUSD was not immune to the resurgent greenback but perhaps fell prey to low liquidity due to Assumption Day holiday in Europe.Also, there may be some concern that the ECB may lean against the current speed of the Euro appreciation in this Thursday’s ECB minutes. But given the market has widely tipped their hand to the long EURO trade, it’s a matter of where if not when to buy the dip. I suspect the short lived peak below 1.1700 answered that question, at least for the time being.
Australian Dollar
AUDUSD continues to struggle on the resurgent USD narrative. Yesterday’s RBA minutes created a lot bluster on the rates front. But the reality is the Aussie economy continues to sputter along, and weak wage growth and the high level of debt will continue to act as a drag.
Any misguided talk of a rate hike sooner than later for the sake of financial stability should be discounted when in fact there was no trade to be gleaned from the RBA minutes.
Traders continue to sell into commodity currency rallies, and AUD is a preferred short given sagging base metals prices. China’s move to deleverage does not bode well over the long term for hard commodity prices
Next up are the local jobs numbers, and given the employment data has been strong in recent months any weakness will be viewed as new intelligence and pounced on by traders.
Gold Slide Continues after Strong Retail Sales and Manufacturing Reports
Gold has posted losses to start off the week. In North American trade, spot gold is trading at $1273.22, down 0.67% on the day. On the release front, US indicators enjoyed a solid day. Retail Sales came in at 0.6%, above the estimate of 0.3%. Core Retail Sales also looked sharp, with the gain of 0.5% beating the forecast of 0.3%. There was more positive news from the manufacturing sector, as the Empire State Manufacturing Index soared to 25.2, crushing the estimate of 10.1 points. On Wednesday, the US releases Building Permits and Housing Starts. As well, the FOMC publishes its minutes from the July FOMC meeting. If there are any hints from the Fed about a rate hike in December, the slide in gold prices could continue.
US consumer spending numbers in July beat their estimates, raising hopes that consumers will continue to spend and boost the US economy. The strong gains in retail sales has helped raise investor risk appetite, which took a hit last week over the crisis in the Korean peninsula. This has boosted the stock markets, but hurt gold prices. Last week, tensions soared between the two enemies, sending gold about 2.4%, as investors dumped shares and snapped up the safe-haven metal. Tensions between North Korea and the US remain high, but the prevalent sentiment in the markets is that a diplomatic solution will be found to end the crisis. President Trump has his hands full at home as well. The latest fiasco for Trump was the alt-right protest in Charlottesville on the weekend, where one protester was killed by a suspected white supremacist. Trump initially refused to condemn white supremacists for the violence, and faced a strong backlash of criticism from both Democrat and Republican lawmakers. Trump finally came out with a statement on Monday which condemned hate groups, including white supremacists.
Trade Idea Wrap-up: USD/CHF – Buy at 0.9695
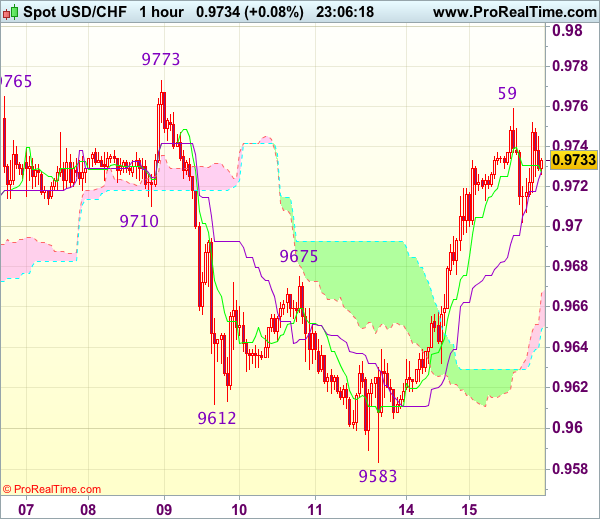
USD/CHF - 0.9730
Most recent candlesticks pattern : N/A
Trend : Near term up
Tenkan-Sen level : 0.9727
Kijun-Sen level : 0.9628
Ichimoku cloud top : 0.9667
Ichimoku cloud bottom : 0.9649
Original strategy :
Buy at 0.9695, Target: 0.9795, Stop: 0.9660
Position : -
Target : -
Stop : -
New strategy :
Buy at 0.9695, Target: 0.9795, Stop: 0.9660
Position : -
Target : -
Stop : -
As the greenback has continued heading north after this week’s anticipated rally, suggesting the retreat from 0.9773 has ended at 0.9583, hence consolidation with upside bias remains for another test of said resistance, however, break there is needed to confirm early rise from 0.9438 low has resumed and extend gain to 0.9808 and possibly 0.9825 resistance, however, near term overbought condition should limit upside and price should falter below previous support at 0.9859.
In view of this, we are looking to reinstate long on pullback as 0.9695-00 should limit downside and bring another rise later. Below previous resistance at 0.9675 would defer and risk weakness towards 0.9640 but downside should be limited to 0.9615-20 and bring another rise later.
Trade Idea Wrap-up: GBP/USD – Sell at 1.2920
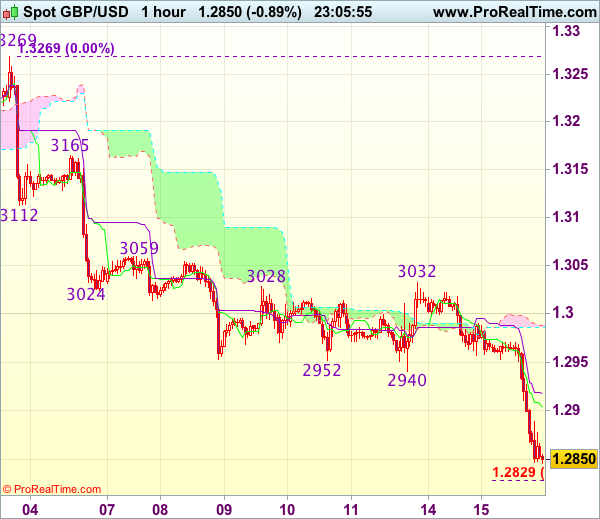
GBP/USD - 1.2857
Most recent candlesticks pattern : N/A
Trend : Near term down
Tenkan-Sen level : 1.2903
Kijun-Sen level : 1.2918
Ichimoku cloud top : 1.2988
Ichimoku cloud bottom : 1.2986
Original strategy :
Sell at 1.2920, Target: 1.2820, Stop: 1.2955
Position : -
Target : -
Stop : -
New strategy :
Sell at 1.2920, Target: 1.2820, Stop: 1.2955
Position : -
Target : -
Stop : -
As cable’s decline has gathered momentum after breaking below support at 1.2933-40, adding credence to our bearish view that the decline from 1.3269 top is still in progress for retracement of early upmove, hence downside bias remains for further weakness to 1.2825-30 (61.8% projection of 1.3269-1.2940 measuring from 1.3032), having said that, near term oversold condition should limit downside to 1.2800 and reckon 1.2770 would hold from here, bring rebound later.
In view of this, would not chase this fall here and would be prudent to sell sterling on recovery as said previous support at 1.2933 should turn into resistance and cap cable’s upside, bring another decline. Above 1.2950 would defer and risk a stronger rebound to 1.2990-00 before another decline.
Strong Retail Sales To Start the 3rd Quarter
Retail and food services surged 0.6 in July while the original 0.2 percent decline in June was revised upwardly to 0.3 percent. Thus, consumer demand started the third quarter on a strong footing.
Strong Retail Sales Even With Weak Gasoline Sales
Gasoline sales declined 0.4 percent in July after a dropping 1.5 percent in June. However, none of those declines were able to put a dent on consumer demand in either month as retail and food services sales increased an upwardly revised 0.3 percent in June and a strong 0.6 percent print in July. The strength in retail sales was broad based, with motor vehicle and parts dealers' sales increasing 1.2 percent while building material & garden equipment & supplies dealers' sales increased 1.2 percent after printing 1.1 percent in June. Even department stores sales, a sector that has been negatively affected by the eruption of online sales, posted a strong 1.0 percent increase for the month. Still, the sector is down 2.7 percent on a year-earlier basis and followed a 0.7 percent decline in June.
Other weak sectors in July were electronics & appliance stores' sales, declining 0.5 percent, while clothing & clothing accessories stores sales declined 0.2 percent compared to June.
However, the rest of the sectors were up during the month, portraying a very strong consumer at the end of the second quarter as well as at the start of the third quarter, which is completely contrary to the view we observed by looking at second quarter PCE numbers released several weeks ago.
Furniture & home furniture stores' sales were up 0.4 percent after increasing 0.5 percent in June, while food & beverage stores sales were up 0.4 percent after declining 0.7 percent in June. Health & personal care stores sales were up 0.4 percent after increasing 0.3 percent the previous month. Meanwhile, sporting goods, hobby, book & music stores' sales were up 0.3 percent, partially recovering the 0.5 percent decline in June.
The strongest sector in June was the miscellaneous store retailers sector, growing 1.8 percent during the month after declining 1.7 percent in June. Meanwhile, non-store retailers' sales were up 1.3 percent after a strong 1.0 percent increase in June. This sector was up 10.4 percent on a yearearlier basis.
Control Group Sales Strong in July
The July retail sales report was strong overall and this was also reflected in the retail sales control group aggregate, which goes into the calculation of GDP. This aggregate increased 0.6 percent compared to expectations of a 0.4 percent increase. Furthermore, control group sales were upwardly revised from a 0.1 percent decline in June to an increase of 0.1 percent. This means that not only is Q2 PCE probably going to be revised higher from an already strong 2.8 percent, but that the expectations for PCE during the third quarter are also going to be marked up going forward. That is, both indicators for the consumption of goods and services from the retail sales report are looking promising for the start of the third quarter of the year. It will be interesting to see if they can keep their momentum.
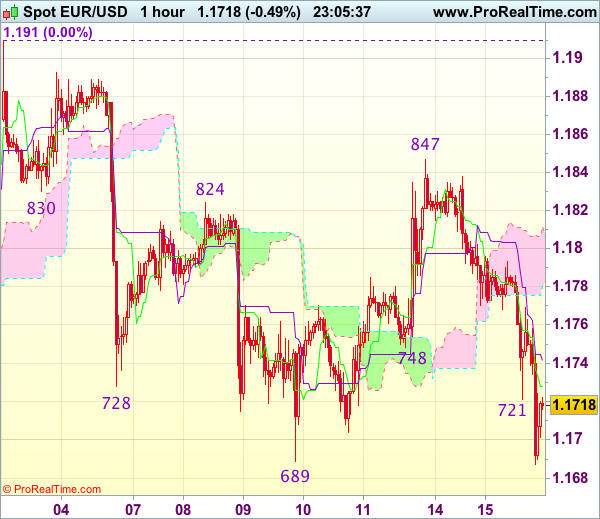
Trade Idea Wrap-up: EUR/USD – Sell at 1.1755
EUR/USD - 1.1720
Most recent candlesticks pattern : N/A
Trend : Sideways
Tenkan-Sen level : 1.1728
Kijun-Sen level : 1.1742
Ichimoku cloud top : 1.1812
Ichimoku cloud bottom : 1.1780
Original strategy :
Sell at 1.1755, Target: 1.1655, Stop: 1.1790
Position : -
Target : -
Stop : -
New strategy :
Sell at 1.1755, Target: 1.1655, Stop: 1.1790
Position : -
Target : -
Stop : -
Current selloff adds credence to our view that the rebound from 1.1689 (last week’s low) has ended at 1.1847 and a firm break below said support would extend recent decline from 1.1910 top to 1.1640-50 (50% Fibonacci retracement of 1.1370-1.1910 and previous support), below there would encourage for subsequent fall towards 1.1600-10 which is likely to hold from here due to near term oversold condition.
In view of this, we are looking to sell euro on recovery as 1.1755-60 should limit upside and bring another decline later. Above 1.1790-95 would abort and risk a stronger rebound to 1.1820 but price should falter below said resistance at 1.1847.