Sample Category Title
Mr Kim Turns Gold And Crude Oil, Off The Boil
A perceived drop in North Korea threats and some weak data from China and Europe was all the excuse that stale crude oil and gold longs needed to head for the exit door.
Crude Oil
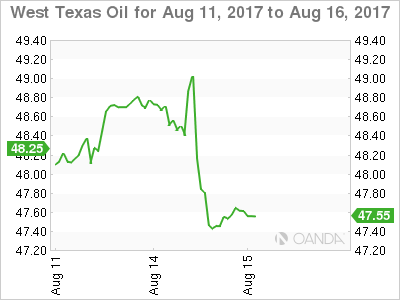
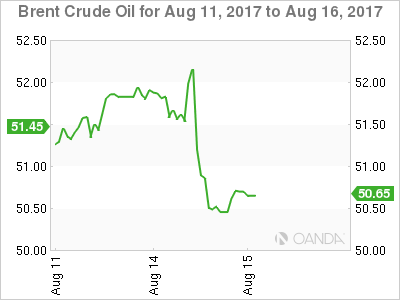
Crude oil prices tumbled overnight with both Brent and WTI spot falling some 2.60 % to close at their lows at 50.50 and 47.45 respectively. Numerous factors came together during the New York session to put the knife into oil and then twist it. A decrease in North Korea tension certainly helped along with weaker China and European data. It saw the U.S. dollar strengthen in general across the markets.
The EIA also adjusted its forecasts higher for U.S. shale production, but the cynic in me regards the backward looking Commitment of Traders (COT) report as the primary driver. Although a week out of date it showed that speculative traders (mostly hedge funds) had become firmly bullish on oil again. This fits perfectly with my comments in previous reports that stale speculative long positioning and a reluctance to hold unprofitable positions has been the main force behind the oil rally running out of steam over the last few sessions. Simply put, speculators have been long and wrong at unattractive levels.
WTI
Of the two contracts, WTI spot is looking the more vulnerable technically as it trades at 47.60 in early Asia. It broke and closed below its 100-day moving average overnight at 47.85, and this forms initial resistance followed by 48.25. A break of initial support at the overnight low of 47.30 sets the scene for a much deeper washout to possibly the 46.00 and 45.00 regions.
Brent
Brent spot is trading at 50.65 and clinging to its support at the 100-day average just below at 50.50. Resistance rests at 51.00 intraday. A break of 50.50 sets up a possible technical correction to support at 49.70.
Gold
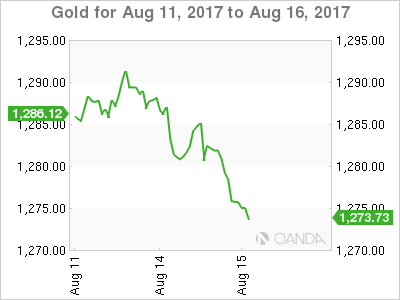
Gold feel seven dollars to 1275.00 overnight as a resurgent U.S. dollar weighed upon precious metals. Weaker China and European data and a lack of chest thumping from North Korea diminished the safe haven appeal of gold following the weekend. We suspect the lull is only temporary however and gold will continue to be supported on meaningful dips.
This morning gold continues to hover around 1275.50, just above initial support at 1275.00. A daily close below here may imply a deeper correction to 1260.00 is on the cards. However, longer term bulls will only get concerned should the 100-day moving average at 1254.85 break.
Resistance lies at 1282.00 initially ahead of 1292.50 and then the formidable 1296.00 region which must break and consolidate before we can start talking about a structural move onto a 1300 handle.
USD/CAD Daily Outlook
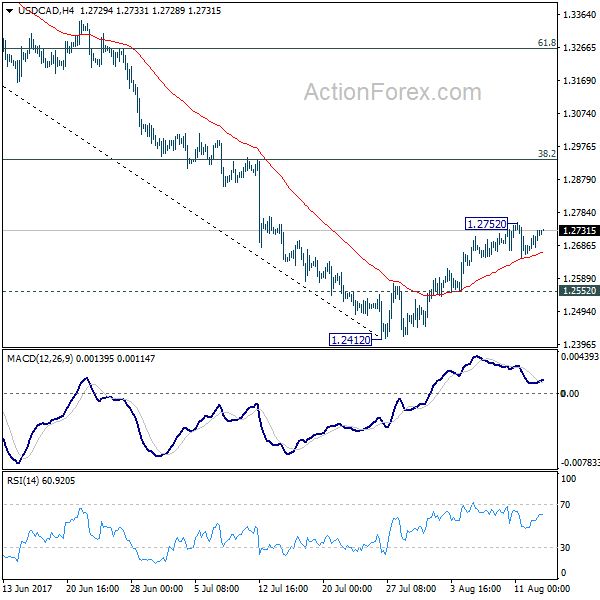
Daily Pivots: (S1) 1.2679; (P) 1.2705; (R1) 1.2748; More....
Intraday bias in USD/CAD remains neutral at this point. The corrective rise from 1.2412 might still extend higher. But based on current momentum, upside should be limited by 38.2% retracement of 1.3793 to 1.2412 at 1.2940 to bring fall resumption. On the downside, below 1.2552 minor support will argue that the recovery is completed and turn bias back to the downside for retesting 1.2412.
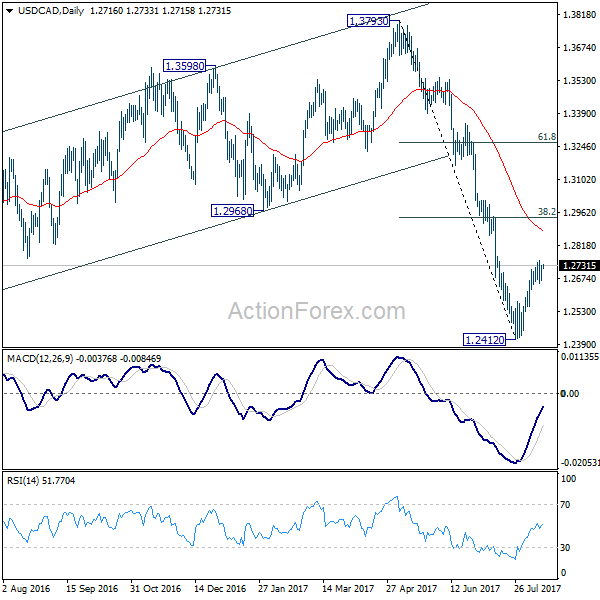
In the bigger picture, price actions from 1.4689 medium term top are seen as a correction pattern. Such corrective fall is still expected to extend to 50% retracement of 0.9406 to 1.4869 at 1.2048. At this point, we'd look for strong support from there to contain downside and bring rebound. Nonetheless, on the upside, sustained break of 1.2968, 38.2% retracement of 1.3793 to 1.2412 at 1.2940 will be the first sign of completion of the correction and will turn focus back to 1.3793 key resistance.
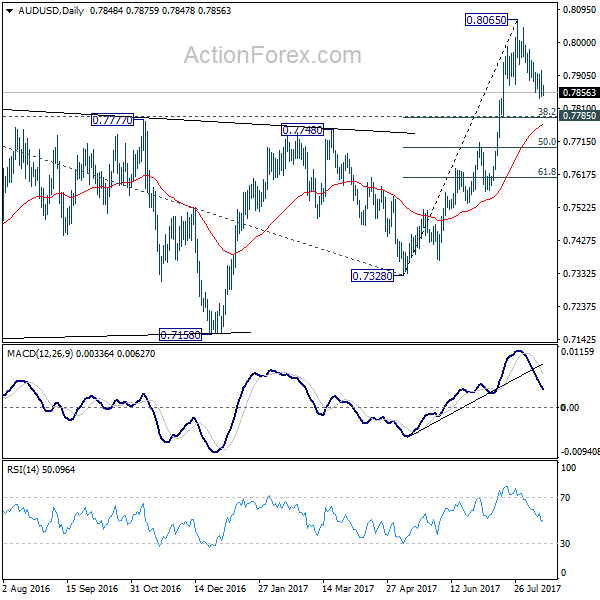
AUD/USD Daily Outlook
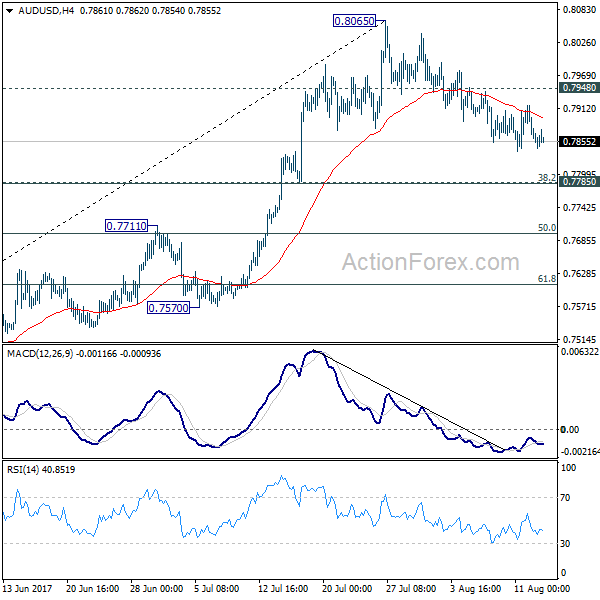
Daily Pivots: (S1) 0.7823; (P) 0.7871; (R1) 0.7897; More...
The correction from 0.8065 is still in progress and with 0.7948 minor resistance intact, deeper decline could be seen in AUD/USD. But we'd expect strong support from 0.7785 cluster support (38.2% retracement of 0.7328 to 0.8065 at 0.7783) to contain downside and bring rebound. On the upside, break of 0.7948 will argue that the pull back is completed. In such case, intraday bias will be turned back to the upside for retesting 0.8065.
In the bigger picture, rise from 0.6826 medium term bottom is still in progress. At this point, there is no confirmation of trend reversal yet and we'll continue to treat such rebound as a corrective pattern. But in any case, break of 55 month EMA (now at 0.8100) will target 38.2% retracement of 1.1079 to 0.6826 at 0.8451. Break of 0.7328 support is needed to confirm completion of the rebound. Otherwise, further rise is now expected.
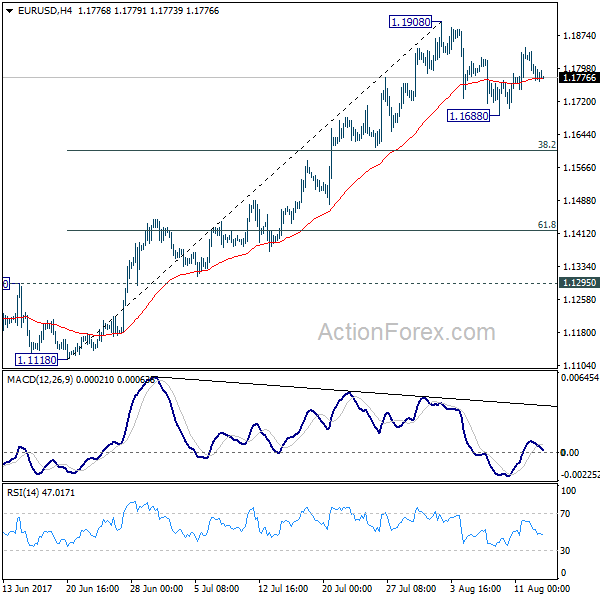
EUR/USD Daily Outlook
Daily Pivots: (S1) 1.1753; (P) 1.1796 (R1) 1.1822; More...
EUR/USD remains bounded in range of 1.1688/1908 and intraday bias stays neutral at this point. The consolidation from 1.1908 might extend and another fall cannot be ruled out. But downside should be contained by 38.2% retracement of 1.1119 to 1.1908 at 1.1606 to bring rebound. On the upside, break of 1.1908 will extend recent up trend to 1.2042 long term support turned resistance next.
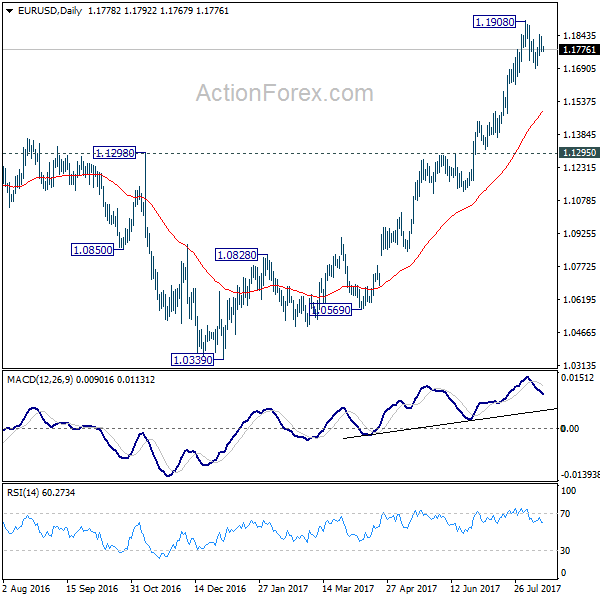
In the bigger picture, an important bottom was formed at 1.0339 on bullish convergence condition in weekly MACD. Sustained trading above 55 month EMA (now at 1.1768) will pave the way to key fibonacci level at 38.2% retracement of 1.6039 (2008 high) to 1.0339 (2017 low) at 1.2516. While rise from 1.0339 is strong, there is no confirmation that it's developing into a long term up trend yet. Hence, we'll be cautious on strong resistance from 1.2516 to limit upside. But for now, medium term outlook will remain bullish as long as 1.1295 support holds, in case of pull back.
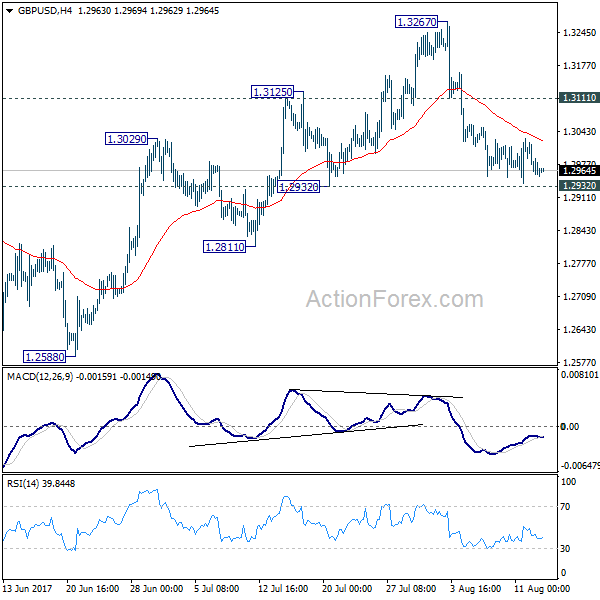
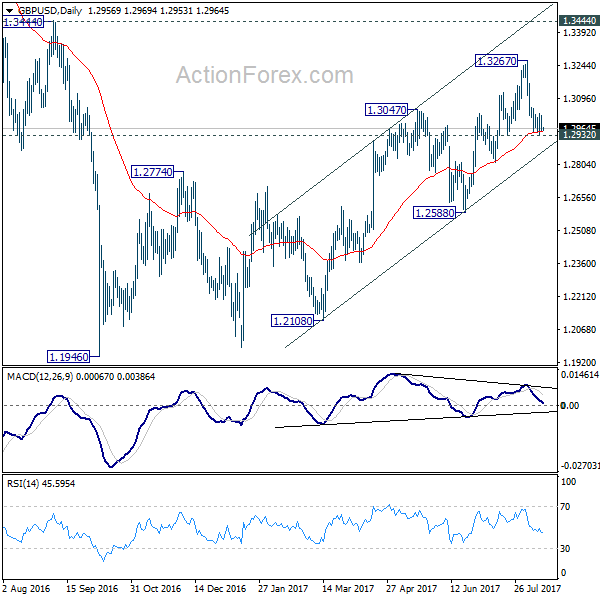
GBP/USD Daily Outlook
Daily Pivots: (S1) 1.2939; (P) 1.2980; (R1) 1.3004; More...
Intraday bias in GBP/USD remains neutral at this point. With 1.3111 resistance intact, near term outlook stays bearish and further fall is expected. As noted before, price actions from 1.1946 are seen as a corrective pattern and could have completed at 1.3267. Break of 1.2932 will affirm this bearish case and target 1.2588 key near term support for confirmation. However, break of 1.3111 resistance will turn bias back to the upside for retesting 1.3267 high instead.
In the bigger picture, overall, price actions from 1.1946 medium term low are seen as a corrective pattern. While further rise cannot be ruled out, larger outlook remains bearish as long as 1.3444 key resistance holds. Down trend from 1.7190 (2014 high) is expected to resume later after the correction completes. And break of 1.2588 will indicate that such down trend is resuming.
Elliott Wave View: Dow Future Resuming Higher
Short term Dow Futures (YM_F) Elliott Wave view suggests that rally from 6/29 low is unfolding as a a double three Elliott wave structure. Up from 6/29 low (21138), Minor wave W ended at 22132 and pullback to 21790 ended Minor wave X. Rally from there is unfolding as an impulse Elliott wave structure. Up from 21790, Subminutte wave i ended at 21884, Subminutte wave ii ended at 21815, Subminutte wave iii ended at 21988 and Subminutte wave iv ended at 21946. Expect Subminutte wave v of (a) to complete soon and thus cycle from 8/11 low to end. Index should then pullback in Minutte wave (b) to correct cycle from 8/11 low before resuming higher again. We don't like selling the proposed pullback and expect buyers to appear once Minutte wave (b) pullback is complete in 3, 7, or 11 swing provided pivot at 21787 low stays intact.
Dow Future 1 Hour Elliott Wave Chart
Double Three is the most important pattern in the new Elliott wave theory and probably the most common pattern in the market these days. Double three is also known as a 7 swing structure. It is a very reliable pattern that gives traders good opportunity to trade with a well defined invalidation level and target areas. The image below shows what Elliott Wave Double Three looks like. It has (W), (X), (Y) labels and an internal structure of 3-3-3, which means that all 3 legs has corrective sequences. Each (W) and (Y) is made of 3 waves oscillations & has structure of A, B, C or another W, X, Y of a lesser extent.
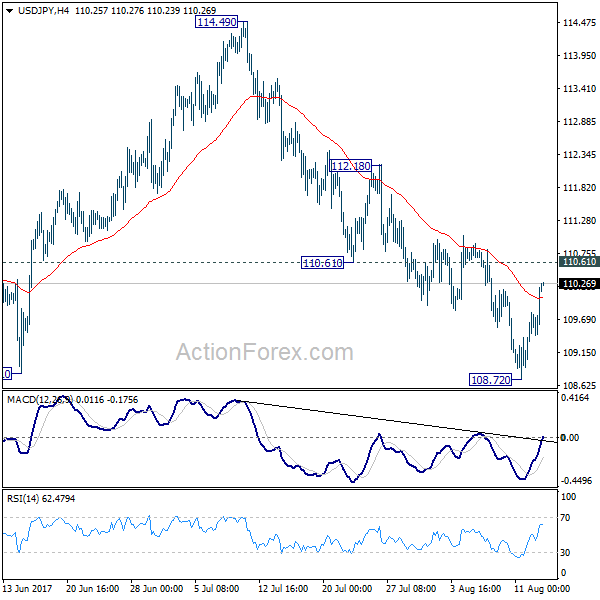
USD/JPY Daily Outlook
Daily Pivots: (S1) 109.18; (P) 109.48; (R1) 109.95; More...
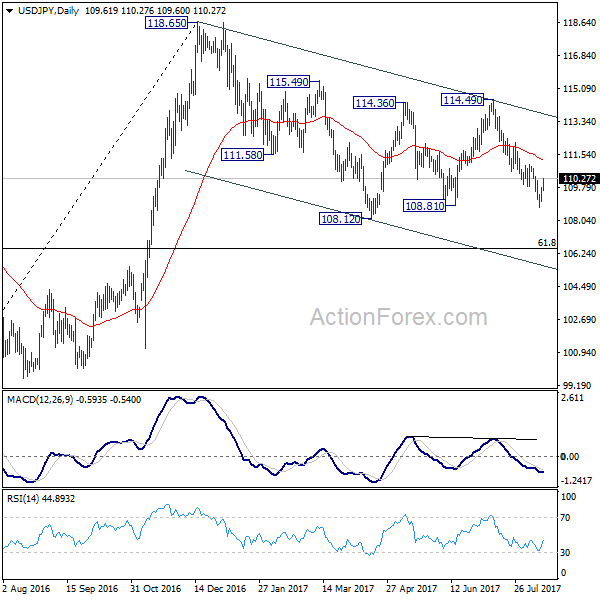
USD/JPY's rebound from 108.72 extends higher today. But it's staying below 110.61 support turned resistance and intraday bias remains neutral. Near term outlook also stays bearish and deeper decline is expected. Firm break of 108.81 support will resume whole corrective fall from 118.65 and target 61.8% retracement of 98.97 to 118.65 at 106.48. However, break of 110.61 will indicate short term bottoming and turn bias back to the upside for 112.18 resistance and above.
In the bigger picture, the corrective structure of the fall from 118.65 suggests that rise from 98.97 is not completed yet. Break of 118.65 will target a test on 125.85 high. At this point, it's uncertain whether rise from 98.97 is resuming the long term up trend from 75.56, or it's a leg in the consolidation from 125.85. Hence, we'll be cautious on topping as it approaches 125.85. If fall from 118.65 extends lower, downside should be contained by 61.8% retracement of 98.97 to 118.65 at 106.48 and bring rebound.
Daily Technical Analysis: USD/JPY Reversal At 109 Support Zone Starts ABC Zigzag
Currency pair USD/JPY
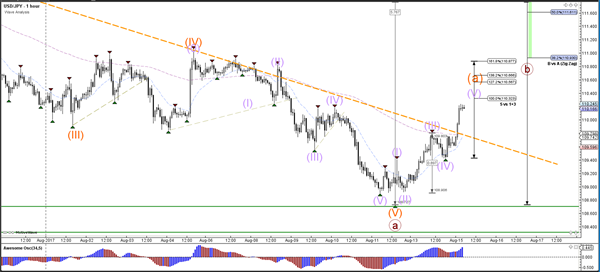
The USD/JPY bounced at the support zone (green lines) of the previous daily bottom and broke above the resistance trend line (dotted orange). The wave structure is therefore favouring a completion of the wave A (brown) at the newest low and the current bullish price action could be a wave A (orange) within wave B (brown).
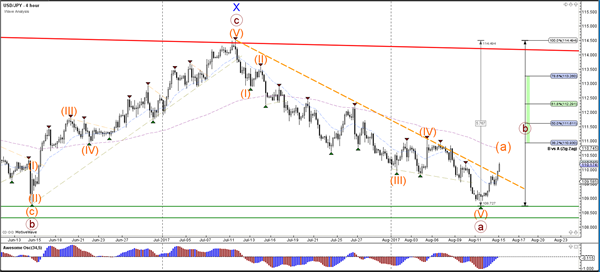
The USD/JPY is building a wave 5 (purple) within wave A (orange). Price could complete the wave 5 at the targets of wave 5 vs 1+3.
Currency pair EUR/USD
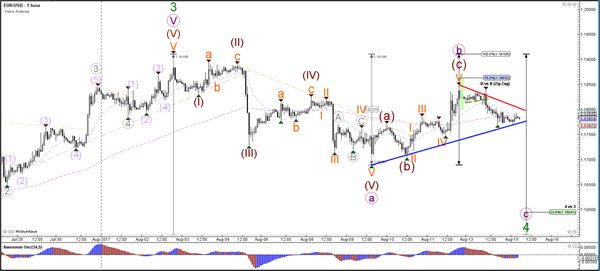
The EUR/USD made a bearish bounce at the Fibonacci levels of wave B vs A. The divergence between the tops (purple line) could create a larger bearish retracement via an ABC correction (purple). The main targets are the 23.6 and 38.2% Fibonacci levels of wave 4 vs 3. A break of the top and 100% Fibonacci level of wave B vs A at 1.1910 could indicate an uptrend continuation.
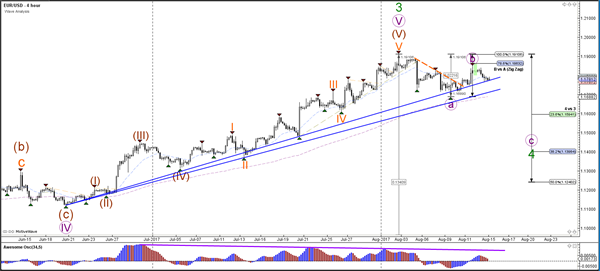
The EUR/USD potential break above the resistance (red) of the triangle chart pattern could see price move towards the next 78.6% Fibonacci level of wave B vs A whereas a break below support (blue) could see price continue towards the 23.6% Fib of wave 4 (green).
Currency pair GBP/USD
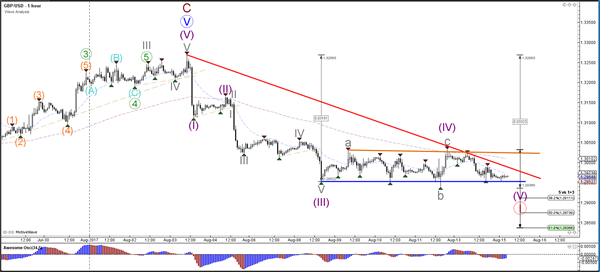
The GBP/USD downtrend is building a pause by moving sideways between support (blue) and resistance (orange). A bearish breakout could indicate the continuation of wave 1 (red).
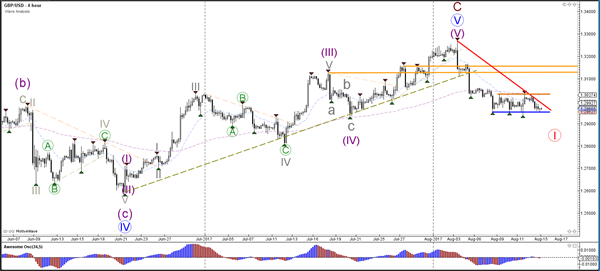
The GBP/USD sideways zone increases the chance that the current pattern is a choppy wave 4 (purple) correction.
Daily Technical Outlook And Review: EUR/USD, GBP/USD, AUD/USD, USD/JPY, USD/CAD, USD/CHF, DOW 30, GOLD
A note on lower timeframe confirming price action...
Waiting for lower timeframe confirmation is our main tool to confirm strength within higher timeframe zones, and has really been the key to our trading success. It takes a little time to understand the subtle nuances, however, as each trade is never the same, but once you master the rhythm so to speak, you will be saved from countless unnecessary losing trades. The following is a list of what we look for:
- A break/retest of supply or demand dependent on which way you're trading.
- A trendline break/retest.
- Buying/selling tails ... essentially we look for a cluster of very obvious spikes off of lower timeframe support and resistance levels within the higher timeframe zone.
- Candlestick patterns. We tend to only stick with pin bars and engulfing bars as these have proven to be the most effective.
We typically search for lower-timeframe confirmation between the M15 and H1 timeframes, since most of our higher-timeframe areas begin with the H4. Stops are usually placed 1-3 pips beyond confirming structures.
EUR/USD
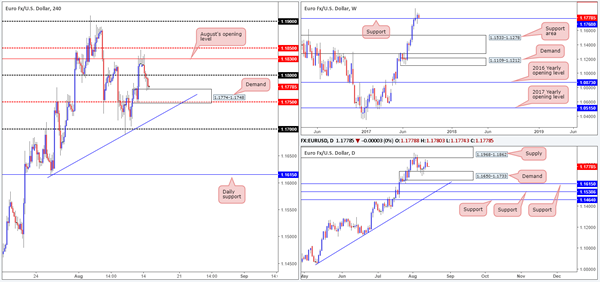
Try as it might, the single currency could not muster enough strength to close above August’s opening level at 1.1830 on Monday. In consequence to this, the pair fell away and eventually closed beneath the 1.18 handle, ending the day challenging a H4 demand pegged at 1.1774-1.1748. Perhaps the most compelling factor seen around this zone is the weekly support at 1.1768, which runs through the top edge of this area beautifully.
A long from the current H4 demand is tempting given the fusing weekly support and how strong the underlying trend on the EUR is at the moment. With that being said, however, there are two cautionary points to consider. The first being the 1.18 handle lurking just above the demand. The second point is the daily demand at 1.1650-1.1733 which happens to converge with a H4 trendline support etched from the low 1.1612. With this zone sited underneath the current H4 demand base, there’s a strong possibility that a fakeout may take shape.
Suggestions: The aforementioned H4 demand, even though it boasts weekly support at 1.1768, is not a place we will be looking to buy from today, largely because of the reasons stated above. To that end, our desk will remain on the sidelines until more favorable price action presents itself.
Data points to consider: German Prelim GDP q/q at 7am. US Core retail sales figures at 1.30pm GMT+1.
Levels to watch/live orders:
- Buys: Flat (stop loss: N/A).
- Sells: Flat (stop loss: N/A).
GBP/USD
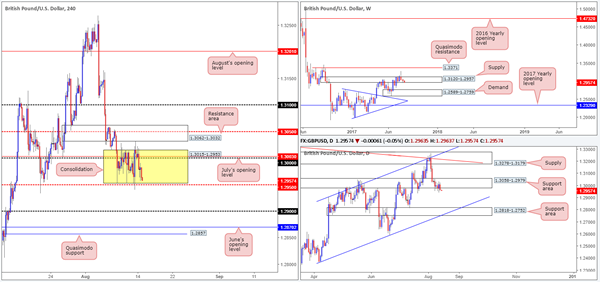
As can be seen on the H4 timeframe this morning, the GBP chewed its way through bids around the 1.30 neighborhood on Monday and proceeded to press back into the current consolidation drawn between 1.3015-1.2953 (yellow zone).
Yesterday’s move to the downside also forced daily price to strongly close beneath a support area at 1.3058-1.2979. With little bullish intent seen registered from this zone last week, we feel this base is now drained and lower prices could be on the cards. A continued move lower from here would likely expose another support area located at 1.2818-1.2752, which happens to fuse with a channel support etched from the low 1.2365 and is also seen glued to the top edge of a weekly demand at 1.2589-1.2759. In addition to this, let’s also remind ourselves where weekly price is trading from at the moment: a weekly supply area coming in at 1.3120-1.2957.
Suggestions: Despite what’s being seen on the higher timeframes at the moment, we will not become sellers in this market UNTIL a close below the 1.2950 neighborhood is seen. This – coupled with a successful retest of 1.2950, a short down to the 1.29 handle, followed closely by June’s opening line at 1.2870/H4 Quasimodo support at 1.2857, is a viable trade in our book.
Data points to consider: UK inflation figures scheduled for 9.30am. US Core retail sales figures at 1.30pm GMT+1.
Levels to watch/live orders:
- Buys: Flat (stop loss: N/A).
- Sells: Watch for H4 price to close below the 1.2950 region and then look to trade any retest seen thereafter ([waiting for a reasonably sized bearish candle to form following the retest – in the shape of either a full, or near-full-bodied candle – is advised] stop loss: ideally beyond the candle’s wick).
AUD/USD
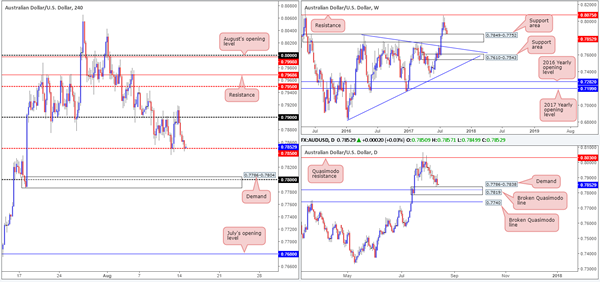
Kicking this morning’s report off with a look at the weekly timeframe, we can see that the candles recently came into contact with a support area marked at 0.7849-0.7752. There was, as noted in Monday’s report, a mild end-of-week correction seen from the top edge of this base. Looking down to the daily timeframe, the commodity currency is seen lurking just ahead of a demand at 0.7786-0.7838 (encases a daily broken Quasimodo level at 0.7819). The demand, as you can see, boasts a strong-looking base. This, alongside it being positioned within the current weekly support area, could see higher prices from here in the near future.
Recent activity on the H4 timeframe shows price failed to sustain gains beyond the 0.79 handle, and proceeded to fall sharply down to the mid-level support at 0.7850 (denotes the top edge of the aforesaid weekly support area). A violation of this line could lead to a move being seen down to the 0.78 handle, which is seen encased within a H4 demand area at 0.7786-0.7804.
Suggestions: With room being seen on the daily timeframe for price to stretch beyond the H4 mid-level support at 0.7850, we would not feel comfortable buying from this line. From our perspective, an ideal scenario would be for price to reach beyond 0.7850 today and cross swords with the aforementioned H4 demand area. As we believe this is a strong buy zone, our desk has set a pending buy order at 0.7805, with a stop-loss order tucked beneath at 0.7784.
Data points to consider: Australian Monetary policy meeting minutes at 2.30am. US Core retail sales figures at 1.30pm GMT+1.
Levels to watch/live orders:
- Buys: 0.7805 ([pending order] stop loss: 0.7784).
- Sells: Flat (stop loss: N/A).
USD/JPY
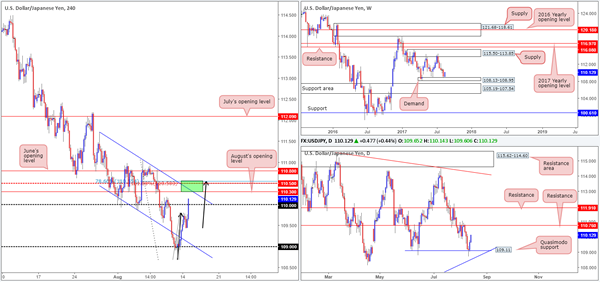
The US dollar made considerable ground against the Japanese yen on Monday, as geopolitical tensions eased between the US and North Korea (Bloomberg). As you can probably see, this has placed the H4 candles above the 110 handle and in-line for an attack of August’s opening level at 110.30, followed closely by the mid-level resistance at 110.50. What’s also notable from here is the AB=CD completion point at 110.50 (black arrows – 161.8% Fib ext.), the 78.6% Fib resistance at 110.55 (basically representing a Gartley Harmonic sell zone) and a channel resistance extended from the high 111.71.
While a short from the green H4 zone is incredibly tempting, traders may want to consider that weekly action is currently trading from demand at 108.13-108.95. Further adding to this, we do not see much in the way of resistance on the daily timeframe until we meet 110.76.
Suggestions: Despite weekly price trading from demand, a sell from the 110.50 neighborhood on the H4 timeframe is still interesting. Stops will, however, have to be positioned above June’s opening level at 110.80, thus clearing daily resistance at 110.76. The ultimate target from here would, from our perspective, be the neighboring channel support stretched from the low 110.30.
Data points to consider: US Core retail sales figures at 1.30pm GMT+1.
Levels to watch/live orders:
- Buys: Flat (stop loss: N/A).
- Sells: 110.50 region (stop loss: 110.80).
USD/CAD
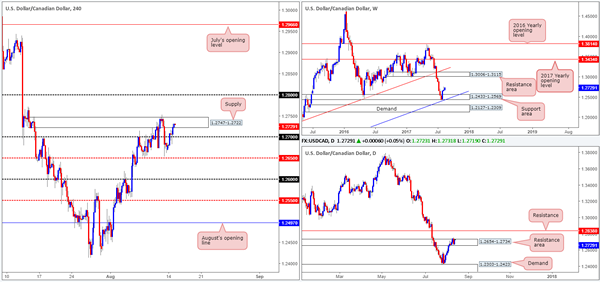
The US dollar advanced against its Canadian counterpart on Monday, consequently lifting the pair above the 1.27 handle and into the jaws of a H4 supply drawn from 1.2747-1.2722. As noted in Monday’s report, this supply area suffered a minor breach to the upside on Friday, which may have cleared the path north for the bulls to challenge the 1.28 region.
On the weekly timeframe, we do not see any obvious resistance on this scale until the resistance area planted at 1.3006-1.3115. The story on the daily timeframe shows price to be trading around a resistance area given at 1.2654-1.2734. The bears appear to lacking here, thus giving the impression we may see the unit stretch up to the resistance level penciled in at 1.2838.
Suggestions: Based on the above, we feel the current H4 supply zone will likely be taken out today. However, we would not be comfortable buyers in this market until a H4 close above this supply is seen. In order to press the buy button, however, we would require a retest of this area as support and a lower-timeframe buy signal (see the top of this report). The initial take-profit level for this setup would be 1.28, followed by the daily resistance at 1.2838, and quite possibly beyond given what the weekly timeframe shows.
Data points to consider: US Core retail sales figures at 1.30pm GMT+1.
Levels to watch/live orders:
- Buys: Watch for H4 price to close above 1.2747-1.2722 and then look to trade any retest seen thereafter ([waiting for a lower-timeframe buy signal to form following the retest is advised] stop loss: dependent on where one confirms this area).
- Sells: Flat (stop loss: N/A).
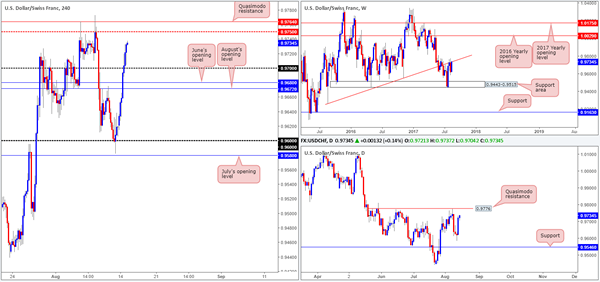
USD/CHF
An improvement in risk appetite on Monday weakened the demand for safe-haven assets, pushing the US dollar above both August and June’s opening levels at 0.9672/0.9680 and the 0.97 handle. The next level of resistance on the H4 timeframe can be seen at 0.9750, shadowed closely by a Quasimodo resistance line at 0.9764.
Over on the bigger picture, we can see that weekly price reconnected with a weekly trendline resistance extended from the low 0.9257. On the daily timeframe, however, the unit is seen trading within striking distance of a Quasimodo resistance planted at 0.9776.
Suggestions: Technically speaking, this is not a market we would like to be buyers in at the moment. There’s just too much overhead structure to consider! What we are interested in, nonetheless, is a sell from the daily Quasimodo resistance mentioned above at 0.9776, largely because of how well price reacted when it came near to testing the boundary last week, and, of course, the converging weekly trendline resistance!
Data points to consider: US Core retail sales figures at 1.30pm. Swiss PPI numbers at 8.15am GMT+1.
Levels to watch/live orders:
- Buys: Flat (stop loss: N/A).
- Sells: 0.9776 region ([waiting for a reasonably sized bearish candle to form – in the shape of either a full, or near-full-bodied candle – is advised] stop loss: ideally beyond the candle’s wick).
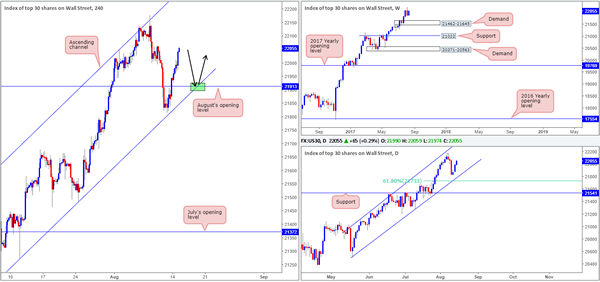
DOW 30
Leaving the H4 channel support line (extended from the low 21273) unchallenged on Monday, the US equity market advanced higher. Running through August’s opening level at 21913, the unit is now seen testing highs of 22059. With both the weekly and daily timeframes showing little resistance on the horizon, a retest of August’s opening level, alongside the aforementioned channel support would, in our humble view, be a nice area to consider entering long from (green zone). However, trendlines are prone to being faked so we would highly recommend being patient and waiting for a H4 bullish candle to take shape in the form of a full, or near-full-bodied candle. This will, of course, not guarantee that the level will hold, but what it will do is show buyer intent from a potential buy zone!
Our suggestions: Keep a close eye on the 21913 region for possible long opportunities.
Data points to consider: US Core retail sales figures at 1.30pm GMT+1.
Levels to watch/live orders:
- Buys: 21913 region ([waiting for a reasonably sized bullish candle to form – in the shape of either a full, or near-full-bodied candle – is advised] stop loss: ideally beyond the candle’s tail).
- Sells: Flat (stop loss: N/A).
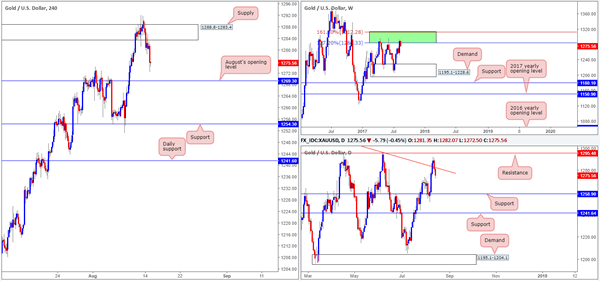
GOLD:
Demand for the safe-haven metal diminished on Monday as tensions between the US and North Korea eased. From a technical point of view, a selloff in this market was to be expected, as weekly price is seen trading from a resistance area comprised of two weekly Fibonacci extensions 161.8/127.2% at 1312.2/1284.3 taken from the low 1188.1.
Thanks to yesterday’s descent, daily price closed back below the trendline resistance etched from the high 1337.3, and has potentially opened the trapdoor down to a support level pegged at 1258.9. Near-term, however, we have August’s opening level at 1269.3 on the H4 chart to contend with.
Our suggestions: Until we see a H4 close print below August’s opening level, we will refrain from taking any shorts in this market. A close below this monthly line, followed up with a retest and a lower-timeframe sell signal (see the top of this report) would, in our opinion, be enough to confirm a sell trade down to the daily support mentioned above at 1258.9, followed closely by H4 support at 1254.3.
Levels to watch/live orders:
- Buys: Flat (stop loss: N/A).
- Sells: Watch for H4 price to close below 1269.3 and then look to trade any retest seen thereafter ([waiting for a lower-timeframe sell signal to form following the retest is advised] stop loss: dependent on where one confirms this level).
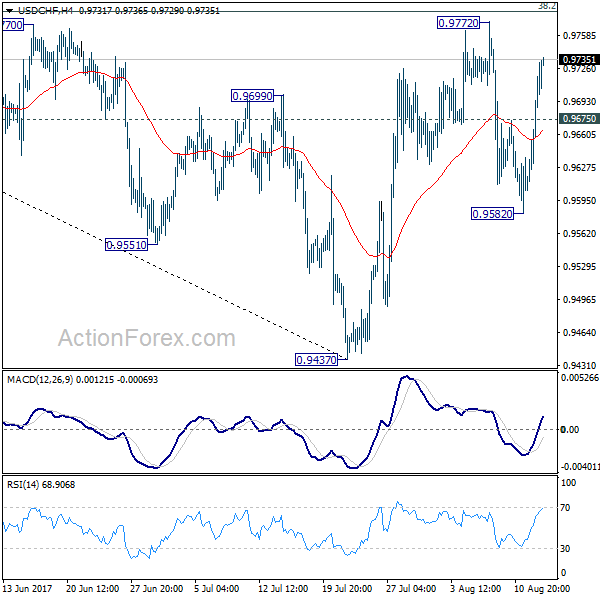
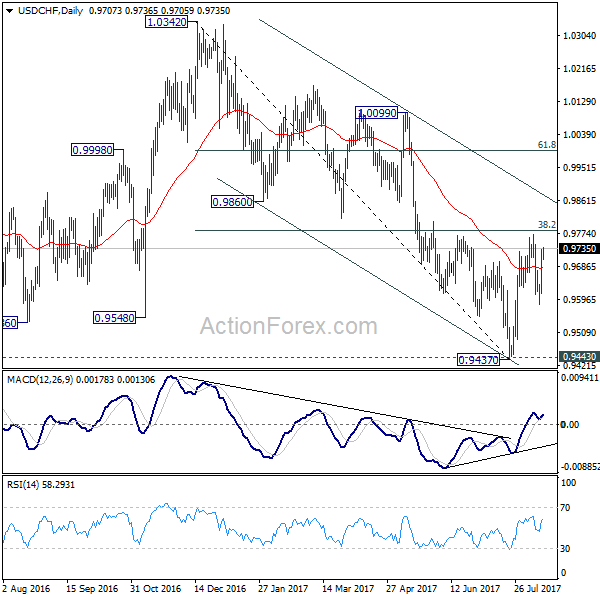
USD/CHF Daily Outlook
Daily Pivots: (S1) 0.9642; (P) 0.9687; (R1) 0.9765; More...
Intraday bias in USD/CHF remains on the upside as rebound from 0.9582 is in progress for retesting 0.9772. Decisive break there will revive the bullish case of reversal. That is, whole decline from 1.0342 has completed at 0.9437 after defending 0.9443 support. USD/CHF should then target channel resistance (now at 0.9880) next. On the downside, below 0.9675 minor support will turn intraday bias neutral first. Also, the pair is bounded inside medium term falling channel and limited below 38.2% retracement of 1.0342 to 0.9437 at 0.9783 for the moment. Break of 0.9582 will dampen our bullish view and turn bias back to the downside for 0.9437. This could also extend the fall from 1.0342 through 0.9437/43 key support level.
In the bigger picture, current development argues that USD/CHF has successfully defended 0.9443 key support level. And long term range trading in 0.9443/1.0342 is extending with another rise. At this point, there is no sign of an up trend yet. Hence, while further rise is expected in USD/CHF, we'll start to be cautious on loss of momentum above 61.8% retracement of 1.0342 to 0.9437 at 0.9996. However, firm break of 0.9443 will carry larger bearish implication and would target next key support at 0.9072.