Sample Category Title
EUR/JPY Head And Shoulders?
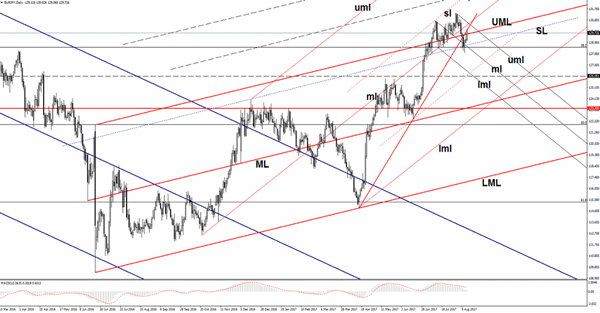
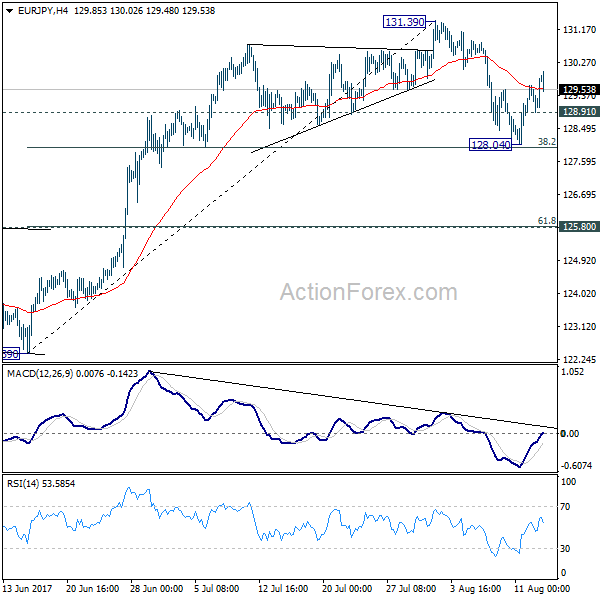
Price turned to the upside after the false breakdown below the confluence area formed by the 38.2% retracement level with the sliding line (SL) and with the median line (ml) of the minor descending pitchfork. Now is pressuring the upper median line (UML) of the major ascending pitchfork, has retested the red uptrend line as well.
Could still increase to retest the confluence formed by the uptrend line with the upper median line (uml), or the one formed between the median line (ml) of the black ascending pitchfork with the upper median line (ml) of the minor descending pitchfork.
A rejection from the mentioned confluence areas will signal a Head and Shoulders pattern, it will be confirmed only after a valid breakdown below the 38.2% retracement level.
GBP/JPY Truned To The Upside
Price rallies aggressively as the Yen is demolished by the Nikkei's impressive jump. GBP/JPY is trading in the green and looks motivated to climb much above the 143.00 psychological level. Today's rally invalidated a crucial breakdown, we still need a confirmation that will increase further in the upcoming period.
The Yen drops versus all its rivals as the JP225 started an aggressive bullish momentum, has opened with a gap up today as well, signaling that the bulls are in full control. The index is trading above the 19700 major static resistance and could climb towards the 20058 long term upside obstacle.
I want to remind you that the Nikkei is still under massive pressure despite the current rebound, could drop anytime again as long as stays under the 20058 horizontal resistance.
You should be careful later as the UK is to release high impact data, the CPI is expected to increase by 2.7% in the last month, more versus the 2.6% growth in the former reading period, while the Core CPI could increase by 2.5%, beating the 2.4% in June. The RPI, HPI, PPI Input and the PPI Output will be released as well.
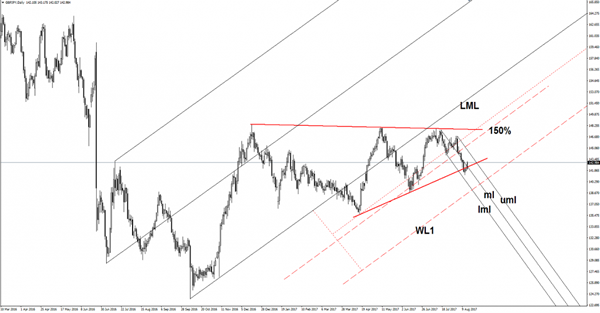
Looks like we had a false breakdown below the red uptrend line, a retest of this obstacle will signal a further increase in the upcoming period. The rebound is natural after the failure to reach the lower median line (lml) of the minor descending pitchfork.
A bounce back at least till the median line (ml) was expected, right now should climb to retest the upper median line (uml).
Trade Idea : GBP/USD – Stand aside
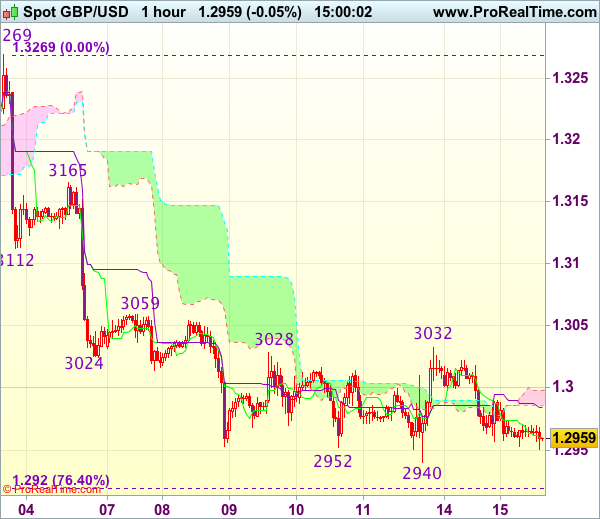
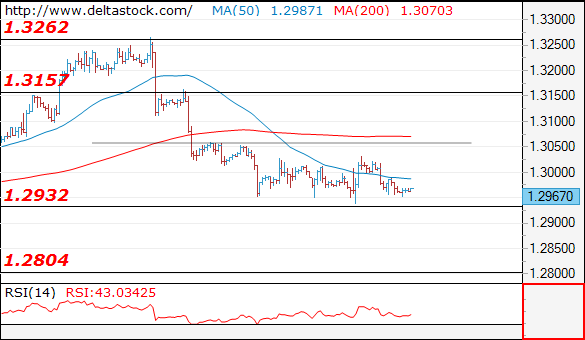
GBP/USD - 1.2947
Most recent candlesticks pattern : N/A
Trend : Near term down
Tenkan-Sen level : 1.2958
Kijun-Sen level : 1.2982
Ichimoku cloud top : 1.2998
Ichimoku cloud bottom : 1.2986
New strategy :
Stand aside
Position : -
Target : -
Stop : -
As the British pound has remained under pressure, adding credence to our bearish view that the decline from 1.3269 top is still in progress for retracement of early upmove, hence downside bias remains for test of previous chart support at 1.2933 but break there is needed to bring further fall to 1.2900, having said that, near term oversold condition should limit downside to 1.2870-75 and 1.2850 should hold from here, bring rebound later.
In view of this, would not chase this fall here and would be prudent to stand aside in the meantime. Above 1.2990 would bring another bounce towards resistance at 1.3032 but break there is needed to signal a temporary low is formed, bring correction back to resistance at 1.3059 first.
Trade Idea : EUR/USD – Sell at 1.1770
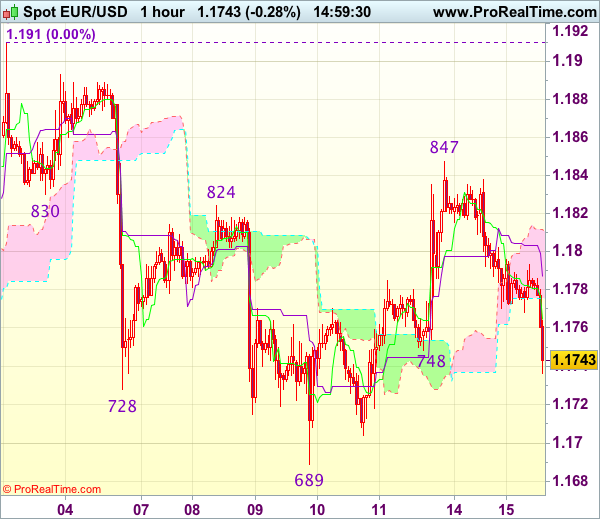
EUR/USD - 1.1733
Most recent candlesticks pattern : N/A
Trend : Sideways
Tenkan-Sen level : 1.1763
Kijun-Sen level : 1.1785
Ichimoku cloud top : 1.1810
Ichimoku cloud bottom : 1.1776
Original strategy :
Bought at 1.1790, stopped at 1.1770
Position : - Long at 1.1790
Target : -
Stop : - 1.1770
New strategy :
Sell at 1.1770, Target: 1.1670, Stop: 1.1805
Position : -
Target : -
Stop : -
Current selloff dampened our bearishness and suggests the rebound from 1.1689 (last week’s low) has ended at 1.1847, hence consolidation with downside bias is seen for weakness to 1.1700-05, however, break of said support at 1.1689 is needed to retain bearishness and extend recent decline from 1.1910 top to 1.1640-50 (50% Fibonacci retracement of 1.1370-1.1910 and previous support) which is likely to hold from here due to oversold condition.
In view of this, we are looking to sell euro on recovery as 1.1770-80 should limit upside and bring another decline later. Above 1.1800-05 would abort and prolong choppy trading within recent established broad range, risk another rebound to said resistance at 1.1847 first.
Trade Idea : USD/JPY – Exit short entered at 110.10
USD/JPY - 110.30
Most recent candlesticks pattern : N/A
Trend : Near term down
Tenkan-Sen level : 110.08
Kijun-Sen level : 109.94
Ichimoku cloud top : 109.41
Ichimoku cloud bottom : 109.26
Original strategy :
Sold at 110.10, Target: 109.10, Stop: 110.45
Position : - Short at 110.10
Target : - 109.10
Stop : - 110.45
New strategy :
Exit short entered at 110.10
Position : - Short at 110.10
Target : -
Stop : -
As the greenback has maintained a firm undertone after breaking above resistance at 110.18, suggesting the rebound from 108.73 low is still in progress and near term upside risk remains for further gain to 110.49-50 (100% projection of 108.73-109.80 measuring from 109.42), then towards resistance at 110.83, however, near term overbought condition should prevent sharp move beyond previous resistance at 111.05, risk from there is seen for a retreat later.
In view of this, would be prudent to exit short entered at 110.10 and stand aside for now. below the Kijun-Sen (now at 109.94) would bring test of previous resistance at 109.80 but break of support at 109.42 is needed to signal top is formed and revive bearishness for weakness towards 109.00.

EUR/JPY Daily Outlook
Daily Pivots: (S1) 128.82; (P) 129.23; (R1) 129.57; More...
Intraday bias in EUR/JPY remains on the upside as rebound from 128.04 would target retesting 131.39 high. Break there is needed to confirm up trend resumption. Otherwise, we'd likely see more consolidation first. On the downside, below 128.91 minor support will turn bias to the downside for another fall. At this point, we'd still expect strong support from 38.2% retracement of 122.39 to 131.39 at 127.95 to bring rebound. But sustained break of 127.95 will bring deeper decline to 125.80 cluster support (61.8% retracement at 125.82) before completing the correction.
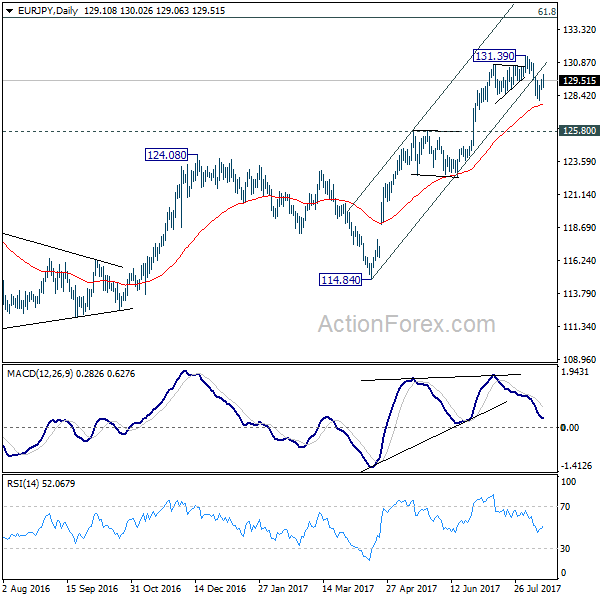
In the bigger picture, the down trend from 149.76 (2014 high) is completed at 109.03 (2016 low). Current rally from 109.03 should be at the same degree as the fall from 149.76 to 109.03. Further rise is expected to 61.8% retracement of 149.76 to 109.03 at 134.20. Sustained break there will pave the way to key long term resistance zone at 141.04/149.76. Medium term outlook will remain bullish as long as 124.08 resistance turned support holds.
GBP/JPY Daily Outlook
Daily Pivots: (S1) 141.66; (P) 142.19; (R1) 142.68; More
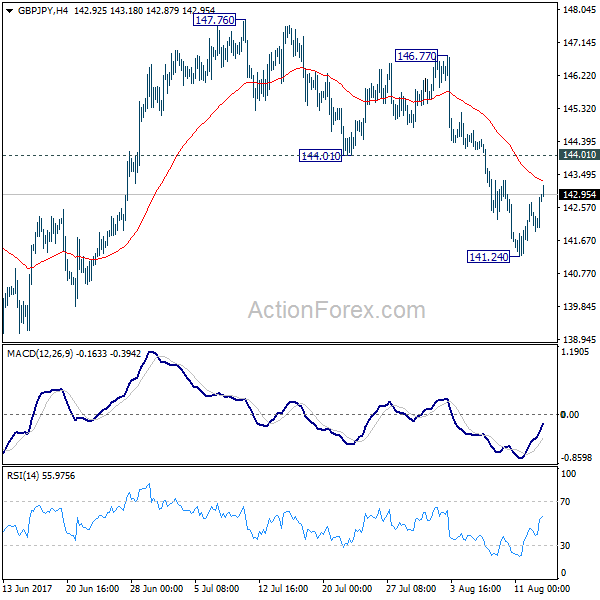
GBP/JPY recovers further today but stays below 144.01 support turned resistance. Intraday bias remains neutral with bearish near term outlook. Below 141.24 will extend the fall from 147.76 to 138.65 support and below. As GBP/JPY is seen as staying in consolidation pattern from 148.42, we'd expect strong support from 135.58 to contain downside. On the upside, break of 144.01 will indicate completion of the decline from 147.76 and turn bias back to the upside.
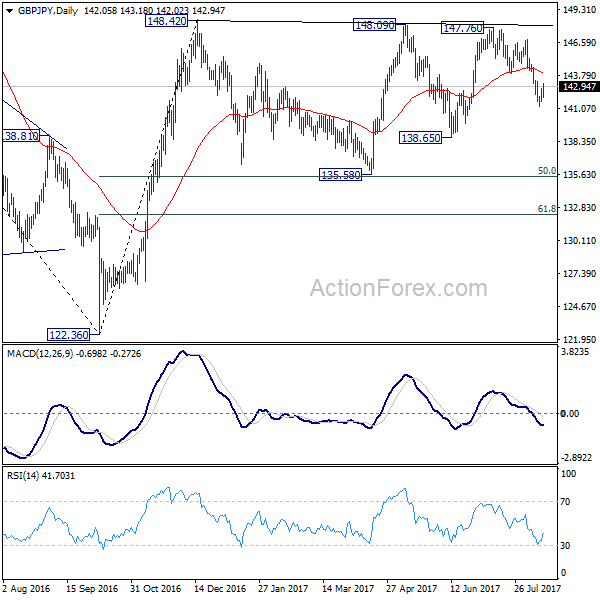
In the bigger picture, the sideway pattern from 148.42 is extending with another leg. But we'd expect strong support from 135.58 and 50% retracement of 122.36 to 148.42 at 135.39 to contain downside. Medium term rise from 122.36 is still expected to resume later. And break of 38.2% retracement of 196.85 to 122.36 at 150.43 will carry long term bullish implications. However, firm break of 135.58/39 will dampen the bullish view and turn focus back to 122.36 low.
Forex Technical Analysis: EUR/USD, USD/JPY, GBP/USD
EUR/USD
Current level - 1.1775
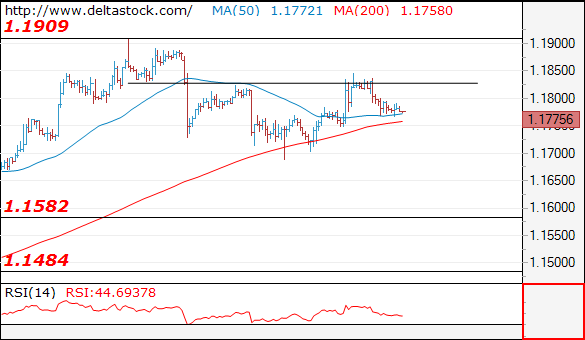
The rise from 1.1687 has been reversed at yesterday's peak at 1.1847 and the bias is already bearish, for a break through 1.1687 low, towards 1.1580.
| Resistance | Support | ||
| intraday | intraweek | intraday | intraweek |
| 1.1850 | 1.1909 | 1.1750 | 1.1580 |
| 1.1909 | 1.2000 | 1.1680 | 1.1480 |
USD/JPY
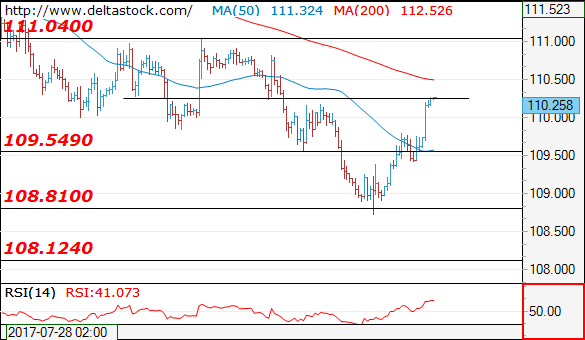
Current level - 110.25
The bias is still positive as the pair is currently testing 110.30 resistance area. There is a risk of bouncing even higher, towards 111.10 mark, but the outlook on the senior frames remains bearish, for a slide towards 108.10 low. Trigger on the downside is 109.40.
| Resistance | Support | ||
| intraday | intraweek | intraday | intraweek |
| 110.30 | 112.20 | 109.40 | 108.10 |
| 111.10 | 114.50 | 108.10 | 107.00 |
GBP/USD
Current level - 1.2967
Although there is an intraday risk of another attempt at 1.3050, the overall outlook remains bearish, for a slide towards 1.2810 area.
| Resistance | Support | ||
| intraday | intraweek | intraday | intraweek |
| 1.3050 | 1.3260 | 1.2930 | 1.2930 |
| 1.3100 | 1.3500 | 1.2810 | 1.2810 |
EUR/GBP Daily Outlook
Daily Pivots: (S1) 0.9072; (P) 0.9084; (R1) 0.9099; More
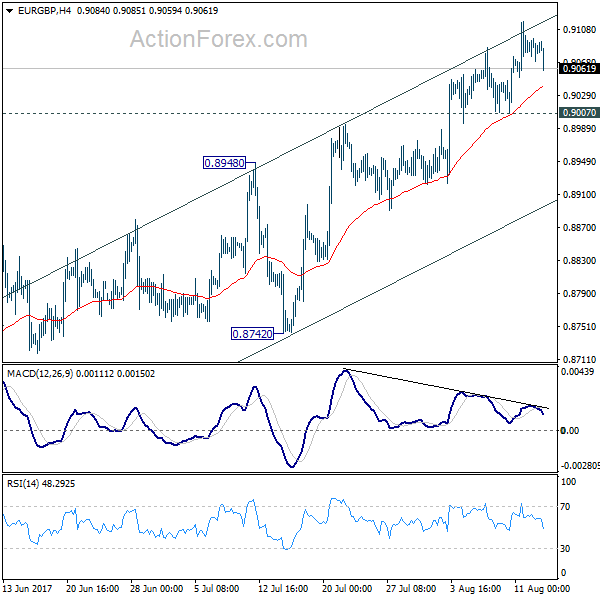
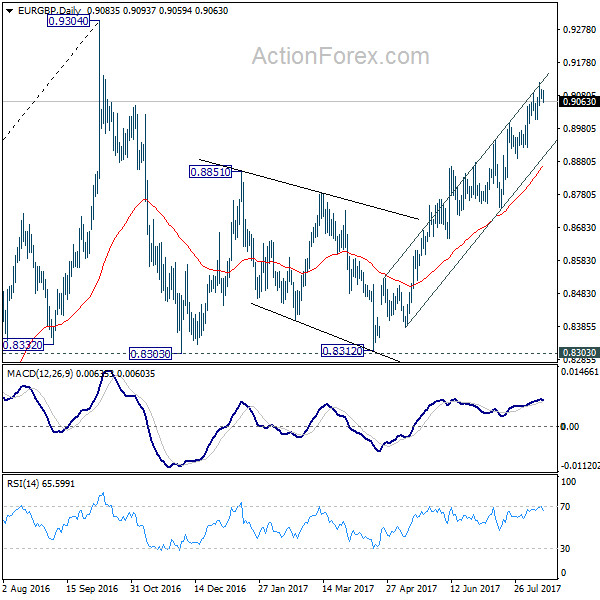
With 0.9007 minor support intact, further rise is still expected in EUR/GBP. Current rise from 0.8312 is expected to target a test on 0.9304 high. At this point, there is no clear sign of up trend resumption yet. Hence, we'll be cautious on strong resistance from 0.9304 to limit upside and bring another fall. On the downside, considering bearish divergence condition in 4 hour MACD, break of 0.9007 support will indicate short term topping. Intraday bias will then be turned back to the downside for 0.8742/8948 support zone.
In the bigger picture, price actions from 0.9304 are viewed as a medium term corrective pattern. It's uncertain whether it is finished yet. But in case of another fall, we'd expect strong support from 0.8116 cluster support (50% retracement of 0.6935 to 0.9304 at 0.8120) to contain downside and bring rebound. Whole up trend from 0.6935 is expected to resume after consolidation from 0.9304 completes.
EUR/AUD Daily Outlook
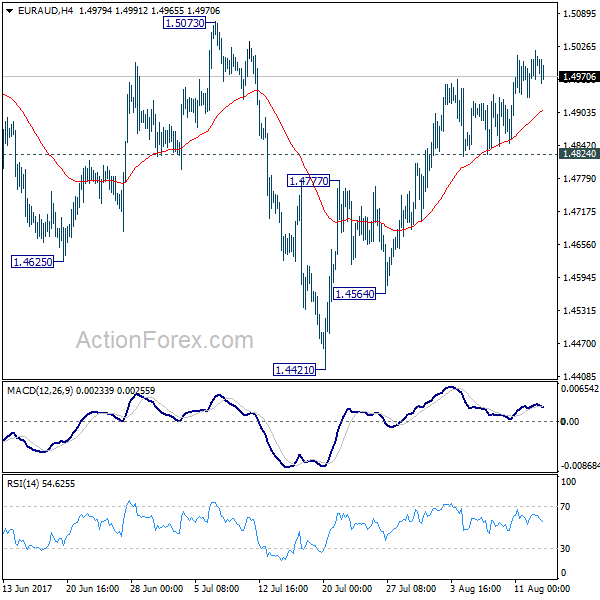
Daily Pivots: (S1) 1.4951; (P) 1.4985; (R1) 1.5038; More...
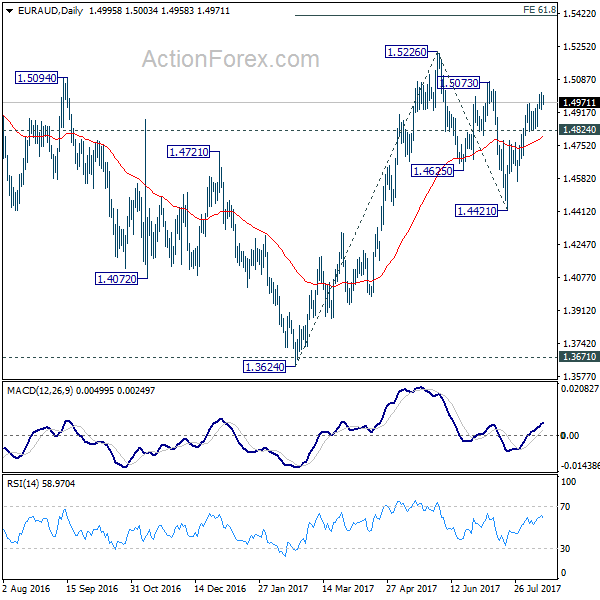
With 1.4824 minor support intact, further rise is expected in EUR/AUD to 1.5073 resistance. Correction from 1.5226 should have completed with three waves down to 1.4421 already. Firm break of 1.5073 will likely resume the rise from 1.3624 and target 61.8% projection of 1.3624 to 1.5226 from 1.4421 at 1.5411 next. On the downside, however, break of 1.4824 support will dampen our bullish view and turn bias back to the downside for 1.4564 support instead.
In the bigger picture, we're holding on to the view that corrective decline from 1.6587 medium term has completed at 1.3624. Rise from 1.3624 is expected to extend to retest 1.6587. The corrective structure of the fall from 1.5226 is affirming this view. Above 1.5226 will target a test on 1.6587 key resistance. However, another decline will dampen our view and would drag EUR/AUD lower to retest key support zone around 1.3624.