Sample Category Title
AUD/USD Growing Selling Pressures
AUD/USD's short-term technical structure is bearish. Hourly support can be found at 0.7786 (18/07/2017 low) has been broken. Hourly resistance is given at 0.8066 (27/07/2017 high) . Expected to show continued decline.
In the long-term, we are waiting for further signs that the current downtrend is ending. Key supports stand at 0.6009 (31/10/2008 low) . A break of the key resistance at 0.8295 (15/01/2015 high) is needed to invalidate our long-term bearish view.
USD/CAD Short-Term Bullish Momentum Continues
USD/CAD's short-term bullish momentum continues. The road is wide open for further increase. Hourly support is given at a distance at 1.2414 (27/07/2017 low). Expected to show continued increase.
In the longer term, the pair has broken longterm support that can be found at 1.2461 (16/03/2015 low) before bouncing back. Strong resistance is given at 1.4690 (22/01/2016 high). The pair should head further lower.
USD/CHF Testing Another Time Resistance At 0.9771
USD/CHF is pushing higher. Resistance is given at 0.9771 (15/06/2017 high). Hourly support lies at at 0.9584 (08/11/2017 low). Expected to to bounce back lower.
In the long-term, the pair is still trading in range since 2011 despite some turmoil when the SNB unpegged the CHF. Key support can be found 0.8986 (30/01/2015 low). The technical structure favours nonetheless a long term bullish bias since the unpeg in January 2015
USD/JPY Bullish Breakout
USD/JPY has exited short-term downtrend channel after the rebound at 108.83 (17/04/2017 low). Expected to show further consolidation before another leg higher.
We favor a long-term bearish bias. Support is now given at 96.57 (10/08/2013 low). A gradual rise towards the major resistance at 135.15 (01/02/2002 high) seems absolutely unlikely. Expected to decline further support at 93.79 (13/06/2013 low).
GBP/USD Monitoring Support At 1.2933
GBP/USD is trading lower. Hourly resistance is given at 1.3267 (03/08/2017 high). Hourly support is given at 1.2933 (20/07/2017 low). Expected to show further bearish breakout of support at 1.2933.
The long-term technical pattern is even more negative since the Brexit vote has paved the way for further decline. Long-term support given at 1.0520 (01/03/85) represents a decent target. Long-term resistance is given at 1.5018 (24/06/2015) and would indicate a long-term reversal in the negative trend. Yet, it is very unlikely at the moment.
EUR/USD Short-Term Weakness
EUR/USD bullish pressures are still on despite ongoing short-term weakness. Hourly resistance is given at 1.1910 (02/08/2017 high) while hourly support can be found at 1.1689 (09/08/2017 high). Stronger support lies at 1.1613 (26/07/2017 low). Expected to show further short-term selling pressures.
In the longer term, the momentum is now turning largely positive. We favour a continued bullish bias. Key resistance holding at 1.1871 (24/08/2015 high) has been broken while strong support lies at 1.0341 (03/01/2017 low).
Trade Idea: GBP/USD – Sell at 1.2950
GBP/USD – 1.2903
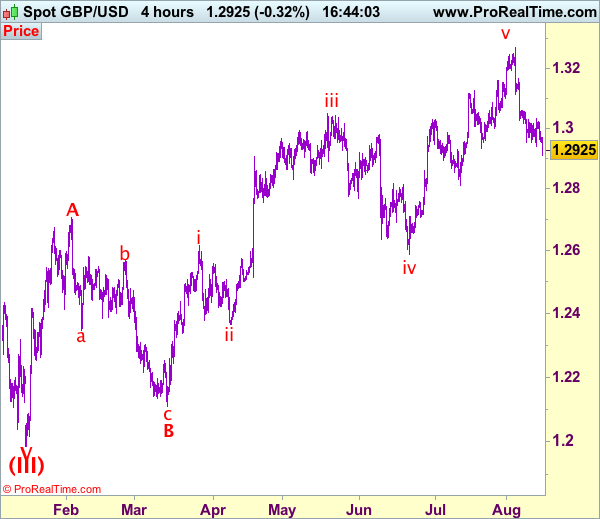
Recent wave: Wave V of larger degree wave (III) has ended at 1.1986 and major correction has commenced from there for gain to 1.3000 and 1.3140-50
Trend: Near term up
Original strategy :
Sell at 1.3055, Target: 1.2860, Stop: 1.3115
Position: -
Target: -
Stop: -
New strategy :
Sell at 1.2950, Target: 1.2800, Stop: 1.3010
Position: -
Target: -
Stop:-
As cable has fallen again after brief recovery and decline gathered momentum after breaking below previous support at 1.2933, adding credence to our view that the selloff from 1.3269 top is still in progress and bearishness remains for this move to bring correction of early upmove, hence further weakness to 1.2850-60, then test of previous support at 1.2812 would be seen, however, near term oversold condition should prevent sharp fall below 1.2800 and reckon 1.2740-50 would hold on first testing, bring rebound later.
In view of this, would not chase this fall here and would be prudent to sell cable on recovery as 1.2950-55 should limit upside, above 1.2990 would defer and risk a stronger rebound to 1.3032 (Friday’s high), however, break there is needed to signal a temporary low is formed instead, bring a further subsequent gain to 1.3059 and possibly towards 1.3100 but previous support at 1.3112 (now resistance) should limit upside.
Our preferred count on the daily chart is that cable's rebound from 1.3500 (wave (A) trough) is unfolding as a wave (B) with A ended at 1.7043, followed by triangle wave B and wave C as well as wave (B) has ended at 1.7192, the subsequent selloff is the larger degree wave (C) which is still unfolding with minor wave (III) of larger degree wave 3 ended at 1.1986, hence wave (IV) correction is in progress which could either be a triangle wave (IV) of a complex formation but upside should be limited to 1.3500 and price should falter well below 1.4000, bring another decline in wave (V) of 3 for weakness to 1.1500, then 1.1200.
AUD Slides Amid Broad USD Rally, German GDP On The Rise
AUD loses ground amid RBA minutes
The Australian dollar was little changed after the Reserve Bank of Australia published the minutes of its August meeting. AUD/USD was treading water at around $0.7870 following the release. However, in late Asian session the Aussie started to tumble amid a broad-based USD strength. The minutes revealed that the central bank was quite optimistic regarding consumption growth, arguing that “rising employment and stronger household income growth were expected to support consumption growth”. However, the RBA noted that, despite a strengthening in economic condition, further appreciation of the AUD could derail the ongoing economic recovery as well as the pick-up in inflation.
Therefore, we expect the RBA to maintain its neutral stance as the Aussie started to reverse gains. However, further strength in the Australian currency may trigger verbal interventions from Governor Lowe.
AUD/USD slid as ow as 0.7825, the lowest level since July 18th. The currency is slowing grinding towards the next support that lies at around 0.7784-0.7787 (Fibonacci 38.2% on May-July rally and low from July 18th).
German GDP increases despite falling exports
A month before the German election, news regarding the German fundamentals data are still positive. Yet, GDP Growth has slightly slowed. The figure, which has been released this morning, came in at 0.6%, a inch below markets’ expectations at 0.7%. It is the 12th quarter that Germany is printing positive economic growth. The first European economy is growing at the average pace of 0.6% per quarter since 2014. Over the last three years France GDP only increased 0.5% q/q.
It is also worth noticing that annualized growth is robust with a GDP growth at 2.1% which represents the fastest pace since 2014. German fundamentals are on the solid side with unemployment rate at its lowest since 1989. Nonetheless exports are still concerning as June showed the biggest drop since 2015 - 3% - while imports fell even more. Indeed, the euro may be too strong for Germany.
On the short-term, we believe that the Eurodollar is likely to pursue its consolidation phase below 1.1800 and markets seem to start pricing in a more cautious ECB which will definitely weigh on the currency.
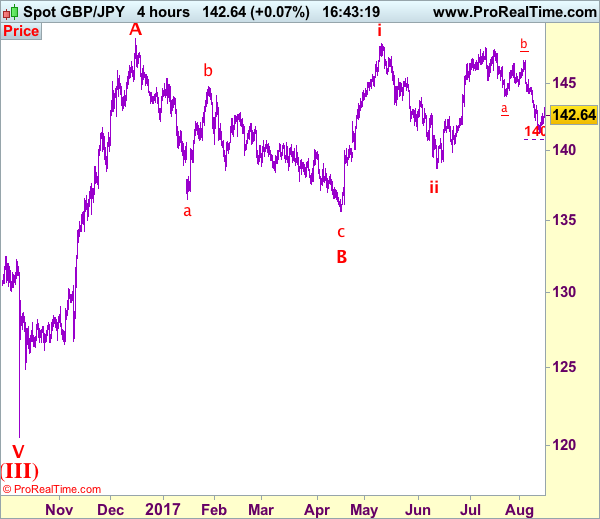
Trade Idea: GBP/JPY – Stand aside
GBP/JPY - 142.57
Recent wave: Medium term low formed at 120.50 and (A)-(B)-(C) major correction has commenced with (A) leg ended at 148.45, hence wave (B) is unfolding for retreat to 131.00-10.
Trend: Near term down
Original strategy:
Sold at 142.50, stopped at 142.80
Position: - Short at 142.50
Target: -
Stop: - 142.80
New strategy :
Stand aside
Position: -
Target: -
Stop:-
As sterling has rebounded again after finding renewed buying interest at 141.95 yesterday, suggesting a temporary low has possibly been formed at 141.25 on Friday, hence further consolidation above this level would be seen and upside risk remains for another rebound to 143.35-40, break there would add credence to this view, bring retracement of recent decline to 144.00 (previous support turned resistance), however, reckon upside would be limited to 144.45-50 and 144.70 should hold, price should falter well below strong resistance at 145.30, bring another decline later.
On the downside, below said support at 141.95 would bring retest of said last week’s low at 141.25, however, break there is needed to revive bearishness and signal recent decline has resumed and extend weakness to 140.80-85 (1.618 times projection of 147.75-144.05 measuring from 146.80) but oversold condition should prevent sharp fall below 140.50 and reckon psychological support at 140.00 would hold from here. As near term outlook is mixed, would be prudent to stand aside for now.
Our preferred count is that larger degree wave V with circle is unfolding from 251.12 with wave (I) 219.34, (II): 241.38 and wave (III) is subdivided into 1: 192.60, 2: 215.89 (23 Jul 2008) and wave 3 ended at 118.87 earlier in 2009. The correction from there to 162.60 is wave 4 which itself is a double three and is labeled as first a-b-c ended at 151.53, followed by wave x at 139.03, 2nd a ended at 162.60, 2nd b at 146.75 and 2nd c leg of wave 4 ended at 163.00. Therefore, the decline from 163.00 to 116.85 is now treated as wave 5 which also marked the end of larger degree wave (III), hence wave (IV) major correction has commenced for retracement of the wave (III) from 241.38 and upside target at 183.95-00 (50% Fibonacci retracement of the wave (II) from 241.38) had been met, a drop below 160.00 would suggest wave (IV) has ended at 195.85, bring decline in wave (V) for initial weakness to 130 (already met) and 120.
Technical Outlook: Cable Breaks Below Key Supports After Weaker Than Expected UK Inflation Data
Pound broke below strong support at 1.2939 on fresh bearish acceleration after UK CPI miss. Inflation stayed unchanged at 2.6% in July, missing forecast at 2.7% and disappointed traders who expected stronger figure to support scenario of interest rate hike.
Sterling hit fresh one-month low at 1.2910 in extension below strong supports at 1.29340/40 zone, turning near-term risk towards next layers of supports between 1.2869/18 (span of daily cloud) among which 100SMA and Fibo 61.8% of 1.2588/1.3268 lay.
Broken 1.2939 level now turned to resistance, with former congestion top at 1.3031, reinforced by 30SMA, expected to limit stronger upticks.
Res: 1.2939, 1.2970, 1.3000, 1.3031
Sup: 1.2910, 1.2869, 1.2857, 1.2848