Sample Category Title
UK Inflation Data Miss Consensus Forecast
Inflation still overshoots the BOE target
The downtrend continues as the price breaks the 50 DMA
Fundamental Analysis
The immediate reaction of the economic data on the Sterling dollar pair was negative and investors pushed the pair lower. It appears that the inflation data is losing steam. The UK home grown prices are still somewhat muted and it is something which the MPC is comfortable about. The inflation data overshooting the bank's target is blamed on the sterling weakness. Going forward, the growth picture still looks subdued and this does not appear to be changing in 2018 as well. More notably, one can not disregard the influence of higher energy prices from Big six energy suppliers making its way to the CPI basket.
Technical Analysis
The candle session shows that the downward trend has more room to go.
Price piercing the 50-DMA is a sign of weakness.
As long as the price is above the upward trend line and both: 100 and 200 DMA, the bulls still control the momentum.
The support is at 1.2812 which is the low of 12 July, however, the area where the price could bounce back up is 1.2877.
The resistance is at 1.3270
GBP/USD Elliott Wave Analysis
GBP/USD – 1.2883
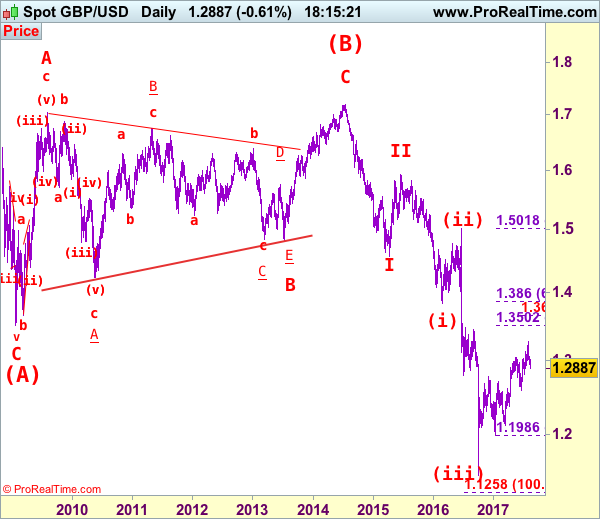
As cable has slipped again after brief recovery and broke below indicated support at 1.2999 and 1.2933, adding credence to our view that top has been formed at 1.3269 earlier this month and few weeks of consolidation below this level would be seen with downside bias for at least a correction of recent upmove, hence further weakness to support at 1.2812 is likely, break there would encourage for decline to 1.2775-80 (38.2% Fibonacci retracement of 1.1986-1.3269), then towards 1.2700, however, near term oversold condition should limit downside to 1.2650-60 and reckon 1.2620-30 (50% Fibonacci retracement) would hold from here, price should stay well above previous chart support at 1.2589, bring rebound later.
Our preferred count on the daily chart is that cable's rebound from 1.3500 (wave (A) trough) is unfolding as a wave (B) with A ended at 1.7043, followed by triangle wave B and wave C as well as wave (B) has possibly ended at 1.7192, below support at 1.4232 would add credence to this count, then further fall to 1.4000 level would follow but reckon downside would be limited to 1.3655 support and price should stay above previous support at 1.3500.
On the upside, expect recovery to be limited to 1.2950-60 and renewed selling interest should emerge below resistance at 1.3032, bring another decline. A daily close above 1.3055-60 would defer and risk a stronger rebound to 1.3100-10 but still reckon upside would be limited to 1.3165 and price should falter well below said resistance at 1.3269, bring another decline later.
Recommendation: Sell at 1.3030 for 1.2800 with stop above 1.3130.
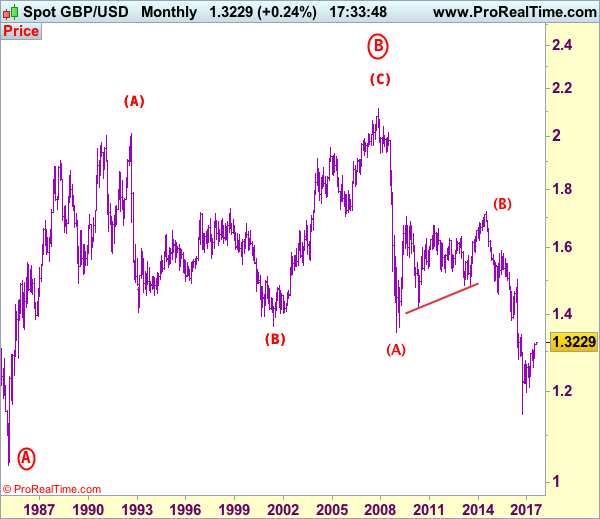
Longer term - Cable's rise from 1.0520 (Feb 1985) to 2.0100 (September 1992) is seen as [A], the decline to 1.3682 is labeled as (B) and (C) wave rally has ended at 2.1162 (9 Nov, 2007) which is also the top of larger degree wave B with circle. The selloff from there is a 5-waver with wave (A) ended at 1.3500 (23 Jan 2009), wave (B) itself is labeled as A: 1.6733, triangle wave B: 1.4813 and wave C as well as top of wave (B) ended at 1.7192 (2014), hence the selloff from there is an impulsive wave (C) with wave I : 1.4566, wave II 1.5930, an extended wave III is unfolding and already exceeded our downside target at 1.3500 and 1.3000, hence weakness to 1.2500 and possibly 1.2000 cannot be ruled out, however, price should stay well above psychological level at 1.0000.
Daily Technical Analysis: USD/CAD Flat Top Ascending Triangle Uptrend
The USD/CAD has been in a steady uptrend. The price has formed an ascending flat top triangle that suggest an uptrend continuation. But the price has already reached the W H4 camarilla pivot so bulls need to be careful. If the pair breaks 1.2760 then 1.2805 will be possible. If there is no breakout to the upside then a retracement towards the POC 1.2700-15 (50.0, D L3, ascending triangle trend line, EMA89) will be possible. New buyers might appear within the POC zone and spike the price up towards the 1.2760 and above mentioned targets. However, bulls should pay attention to 1.2700 break to the downside. If that happens, the pair might experience a temporary weakness leading to 1.2656-45 zone.
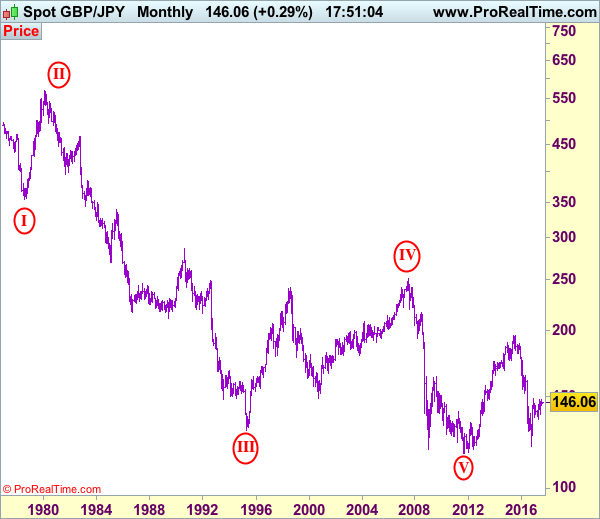
GBP/JPY Elliott Wave Analysis
GBP/JPY – 146.05
Sterling’s anticipated selloff to 141.25 (last week’s low) adds credence to our view that temporary top has been formed at 147.75 last month and although price has rebounded this week, reckon upside would be limited to 144.40-50 and price should falter below resistance at 145.30, bring another decline later this month. Below said support at 141.25 would signal the fall from 147.75 top is still in progress for correction of early upmove to 140.50 then towards psychological support at 140.00, however, near term oversold condition should limit downside to 139.85 support and price should stay well above previous chart support at 138.70.
Our preferred count is that larger degree wave V with circle is unfolding from 251.12 with wave (I) 219.34, (II): 241.38 and wave (III) is subdivided into 1: 192.60, 2: 215.89 (23 Jul 2008) and wave 3 ended at 118.87 earlier in 2009. The correction from there to 162.60 is wave 4 which itself is a double three and is labeled as first a-b-c ended at 151.53, followed by wave x at 139.03, 2nd a ended at 162.60, 2nd b at 146.75 and 2nd c leg of wave 4 ended at 163.00. Therefore, the decline from 163.00 to 116.85 is now treated as wave 5 which also marked the end of larger degree wave (III), hence wave (IV) major correction has commenced for retracement of the wave (III) from 241.38 and upside target at 183.95-00 (50% Fibonacci retracement of the wave (II) from 241.38) had been met, a drop below 160.00 would suggest wave (IV) has ended at 195.85, bring decline in wave (V) for initial weakness to 130 (already met) and 120.
On the upside, although current rebound from 141.25 may bring initial recovery to 143.30-35 and possibly 144.00, reckon upside would be limited to 144.50-60 and bring another decline to aforesaid downside targets. Above 145.30 would dampen this bearish scenario and suggest first leg of decline from 147.75 has ended instead, bring a stronger rebound d to 145.90-0-0 but price should falter below resistance at 146.80, bring another decline later.
Recommendation: Short entered at 146.50 met target at 144.50 with 200 points profit and would sell again at 144.50 for 141.50 with stop above 145.50.

The long-term downtrend from 570.99 (29 Feb 1980) is labeled as an impulsive wave with III with circle ended at 129.77 (20 Apr 1995) and the corrective rebound to 251.12 (20 Jul 2007) is treated as wave IV with circle and the wave V with circle selloff from 251.12 has possibly ended at 116.80 (almost reached our indicated target at 116.00) and major correction has commenced from there and indicated upside target at 183.90-00 (50% Fibonacci retracement of 251.10-116.85) had been met, reckon upside would be limited to 199.80-90 (61.8% Fibonacci retracement) and bring wave (V) decline in later part of 2017.
CRUDE OIL Wide-Open For Further Weakness
Crude oil is trading lower. Hourly support is given at a distance at 45.40 (24/07/2017 low). Strong resistance can be found at 50.41 (31/07/2017). Expected to show short-term weakness.
In the long-term, crude oil has recovered after its sharp decline last year. However, we consider that further weakness are very likely. Strong support lies at 35.24 (05/04/2016) while resistance can now be found at 55.24 (03/01/2017 high).
SILVER Short-Term Bearish Pressures
Silver's bullish pressures are on. Hourly resistance lies at 17.24 (10/08/2017 high) while support can be found at 16.13 (07/08/2017 high). Expected to show continued current bullish momentum.
In the long-term, the death cross indicates that further downsides are very likely. Resistance is located at 25.11 (28/08/2013 high). Strong support can be found at 11.75 (20/04/2009).
GOLD Bearish Consolidation
Gold is consolidating lower. Hourly support is given at 1251 (08/08/2017 low). Stronger support lies at 1204 (10/07/2017 high). The commodity is heading towards resistance given at 1296 (06/06/2017 high). Expected to show conitnued buying pressures.
In the long-term, the technical structure suggests that there is a growing upside momentum. A break of 1392 (17/03/2014) is necessary ton confirm it, A major support can be found at 1045 (05/02/2010 low)
BITCOIN Fear Of Missing Out
Bitcoin keeps on surging, probably on fear of missing out. The digital currency has set a new all-time high at 4449 (15/08/2017 high) and hourly support lies very far at 2403 (26/07/2017 low). The road is wide open for another bullish move.
In the long-term, the digital currency has had an exponential growth. There are decent likelihood that the asset will consolidate above $1500. Long-term support is given at $1464 (04/05/2017 low).
EUR/CHF Bouncing Higher
EUR/CHF's short-term buying pressures are back on. Hourly support is now located at 1.1260 (04/08/2017 low). Expected to show continued increase.
In the longer term, the technical structure has reversed. Strong resistance at 1.1200 (04/02/2015 high) has been broken. Yet,the ECB's QE programme is likely to cause persistent selling pressures on the euro, which should weigh on EUR/CHF. Supports can be found at 1.0184 (28/01/2015 low) and 1.0082 (27/01/2015 low).
EUR/GBP Consolidating Below 0.9100
EUR/GBP is trading around its highest levels of the year despite ongoing consolidation. Hourly resistance lies at 0.9087 (08/08/2017 high). Hourly support is given at a distance at 0.8742 (16/06/2017 low). Downside risks are nonetheless important.
In the long-term, the pair has largely recovered from recent lows in 2015. The technical structure suggests a growing upside momentum. The pair is trading above from its 200 DMA. Strong resistance can be found at 0.9500 psychological level.