Sample Category Title
Global Stocks Punished By Geopolitics, US Inflation In Focus
An air of caution is lingering across the financial markets during early trading on Friday, as investors closely monitor the escalating tensions surrounding the United States and North Korea. The war of words between the two nations is putting investors on high alert and more comments from President Trump overnight, has resulted in additional risk-off being seen in the markets.
Money is jumping into safe-havens like Gold and the Japanese Yen, while the Korean Won has fallen to its lowest level in a month- after extending its losses to around 2% for the week. After a very quiet start to the week due to the summer season, the second half has been dominated by geopolitics - with the mounting tensions between the United States and North Korea denting risk sentiment, ultimately punishing global stocks.
Asian equity markets tumbled lower on Friday amid the risk aversion, and European stocks are likely to extend losses as uncertainty accelerates the traders' flight to safety. Wall Street closed sharply lower on Thursday, after US President Donald Trump reiterated his warnings to North Korea. Stocks may remain pressured this afternoon, as market players remain hesitant to carry riskier assets ahead of the US inflation data, scheduled for later today.
Yen supported by risk aversion
The Japanese Yen has sharply appreciated against its major trading partners, following the escalation in geopolitical tensions between the United States and North Korea. Money has poured into the Yen as investors search for safe-haven assets following the “fire and fury” comments from US President Donald Trump, earlier in the week.
The Japanese Yen is regularly seen as a trader's best friend in times of uncertainty, and what we are noticing is a continuation of the same trend.
The Yen gained further ground against the US Dollar during trading on Friday, with the USDJPY dipping below 109.00 for the first time since mid-June.
If geopolitical risk and uncertainty continues to strengthen the Yen, USDJPY bears are likely to have found enough inspiration to conquer the stubborn 109.00 support level. From a technical standpoint, the USDJPY is heavily bearish on the daily charts, as there have been consistently lower lows and lower highs. A breakdown and daily close below 109.00, may even encourage an eventual depreciation towards 107.50
Commodity Spotlight – Gold
Market jitters from the escalating geopolitical tensions between the US and North Korea have brought Gold back into fashion this week, with the yellow metal hitting a fresh two-month high above $1288, during early hours on Friday. In times of uncertainty, investors continue to be attracted to Gold and further upside is likely, if US/North Korean anxiety supports the flight to safety.
Although the metal is currently following a positive trajectory on the daily charts, market players might decide to remain on the sidelines ahead of the US inflation report, released later today. It should be kept in mind that the inflation figures have the ability to impact the prospects of higher US interest rates, and this will possibly have a direct correlation to the value of Gold.
From a technical standpoint, Gold bulls are back in town and the breakout above $1280 increases the potential of a further appreciation towards $1300.
US inflation report in focus
The Dollar weakened against a basket of major currencies on Thursday, after U.S producer prices declined the most in 11 months - falling 0.1% in July, while unemployment claims rose last week.
Today's main focus and event risk for the U.S Dollar, will be the pending inflation report from the United States Federal Reserve, which should offer fresh clues on the pace of monetary tightening. Although the Greenback has maintained its post NFP gains this week, the overall price action suggests that market players are still hesitant to purchase the currency. Investors need more convincing over the possibility of higher US interest rates this year and this should come in the form of rising inflation. With concerns over stubbornly low inflation weighing heavily on the prospect of another US interest rate increase, the pending US CPI data will be in sharp focus. A soft inflation figure below market consensus, is likely to quell expectations of higher US interest rates, ultimately pressuring the Dollar.
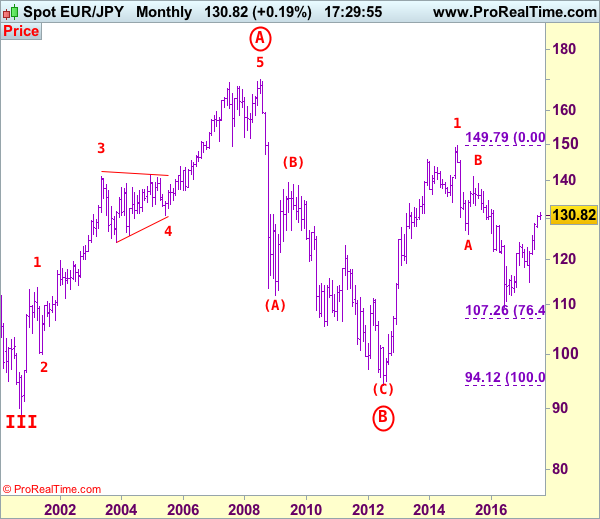
EUR/JPY Elliott Wave Analysis
EUR/JPY - 128.25
Although the single currency did rebound after finding support at 128.43 earlier this week, renewed selling interest quick emerged at 129.56 yesterday and euro has slipped again, suggesting near term downside risk remains for the retreat from 131.40 temporary top to bring retracement of recent upmove, hence downside risk remains for this move to extend weakness to 127.95-00 (38.2% Fibonacci retracement of 122.38-131.40), then test of support at 127.44 but break of latter level is needed to provide confirmation, bring further fall to 126.45-50, having said that, price should stay above previous resistance at 125.82 (now support) and euro may head north again from there. Only a sustained breach below this level would signal correction of recent upmove has commenced for further fall to 125.15-20 but previous resistance at 124.65 would hold from here.
The daily chart is labeled as attached, early selloff from 169.97 (July 2008) to 112.08 is wave (A) of B instead of end of entire wave B and then the rebound from there to 139.26 is wave (B), hence, wave (C) has possibly ended at 94.12 with a diagonal triangle as labeled in the daily chart, hence upside bias is seen for further gain. Recent rally above indicated retracement level at 116.69 (50% Fibonacci retracement of the intermediate fall from 139.26-94.12) adds credence to this view and signal major reversal has commenced but first leg of this wave C has possibly ended at 149.79, hence wave 2 has commenced with wave A ended at 126.09, followed by wave B at 141.06, wave C commenced and could have ended at 109.49, above 126.00 would add credence to this view, then headway to 130.00 would follow.
On the upside, whilst initial recovery to 129.00 cannot be ruled out, reckon said resistance at 129.56 would limit upside and bring another decline later. Above previous support at 130.09 would defer and suggest first leg of decline from 131.40 has ended instead, risk a stronger rebound to 130.50 but upside should be limited to 130.80-85 and price should falter below 131.40, bring another leg of corrective decline later this month. Only above said resistance at 131.40 would extend medium term upmove from 109.49 low (2016 low) to extend further gain to 132.00-10, however, overbought condition should prevent sharp move beyond 132.90-00 (1.236 times projection of 109.49-124.10 measuring from 114.85) and price should falter well below previous chart resistance at 134.59.
Recommendation: Exit long entered at 128.55 and stand aside for this week.
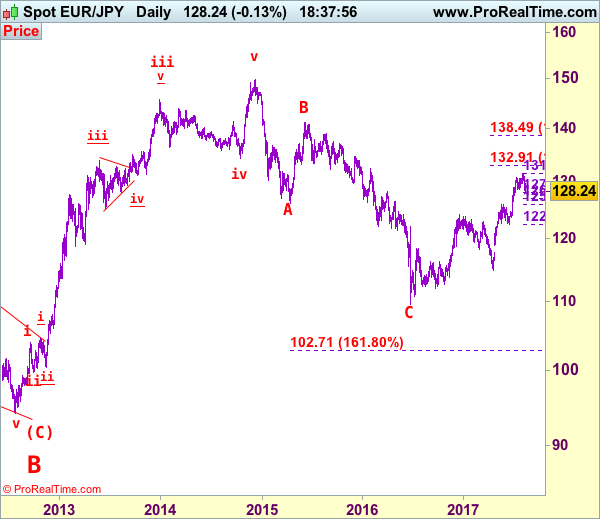
To re-cap the corrective upmove from the record low of 88.93 (18 Oct 2000), the wave A from there is subdivided as: 1:88.93-113.72, 2:99.88 (1 Jun 2001), 3:140.91 (30 May 2003), 4:124.17 (10 Nov 2003) and 5 ended at record high of 169.97 (21 Jul 2008). The brief but sharp selloff to 112.08 is viewed as a-b-c x a-b-c wave (A) of B. The subsequent rebound to 139.26 is (B) of B and (C) of (B) has possibly ended at 94.12 and in any case price should stay well above previous chart support at 88.93, bring rally in larger degree wave C towards 150.00.
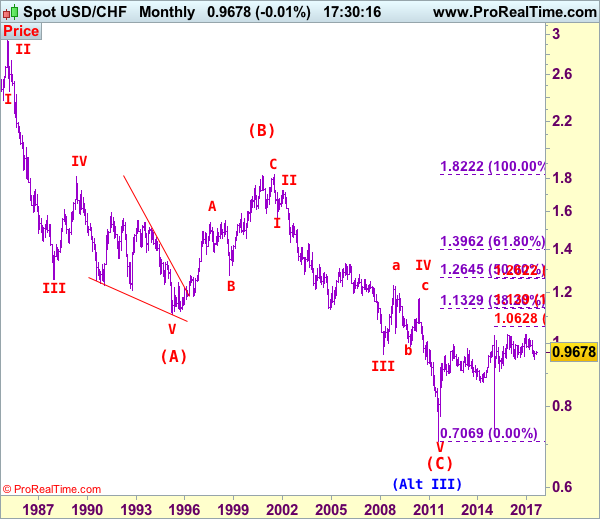
USD/CHF Elliott Wave Analysis
USD/CHF – 0.9618
As the greenback has retreated after running into resistance at 0.9773 earlier this week, suggesting initial downside risk is for weakness to 0.9600, however, as the strong rebound from 0.9438 to 0.9773 signals a temporary low has possibly been formed at 0.9438, reckon downside would be limited to 0.9540-50 and bring another rebound later. Above 0.9700 would bring another bounce to 0.9773 resistance but break there is needed to add credence to this view and extend the rebound from 0.9438 low for further gain to 0.9845-50 (61.8% Fibonacci retracement of 1.0100-0.9438) but reckon upside would be limited to 0.9890-00 and price should falter well below psychological resistance at 1.0000.
Our preferred count on the daily chart is that early selloff to 0.9630 is an end of the larger degree wave III and major correction is unfolding from there with a leg ended at 1.2298 (Nov 2008 with (a): 1.0625, (b):1.0011 and (c):1.2298), wave b ended at 0.9910 with (a): 1.0370, (b): 1.1967, (c): 0.9910. The rise from there to 1.1730 is the wave c which also marked the end of wave IV and wave V has possibly ended at 0.7068.
On the downside, whilst the pullback from 0.9773 may bring initial weakness to 0.9600, reckon 0.9550-55 would limit downside and bring another rebound to aforesaid upside targets. Only a drop below said recent low at 0.9438 would revive bearishness and signal the erratic decline from 1.0344 top (formed back in late 2016) is still in progress and downside bias remains for this move to extend weakness to 0.9390-00, however, loss of downward momentum should prevent sharp fall below 0.9300-10, risk from there has increased for a rebound to take place probably later.
Recommendation: Buy at 0.9555 for 0.9755 with stop below 0.9455

Dollar's long-term downtrend started from 2.9343 (Feb 1995) and it was unfolding as a (A)-(B)-(C) with (A): 1.1100, (B): 1.8310 (26 Oct 2000), then followed by another impulsive wave (C) with wave III ended at 0.9630 (Mar 2008). Under this count, correction in wave IV has possibly ended at 1.1730 and wave V already broke below support at 0.9630 and met indicated downside target at 0.7500 and 0.7400. The reversal from 0.7068 suggests the wave V has possibly ended and the breach of resistance at 0.9595 add credence to this view and indicated upside target at 1.0000 had been met, however, the sharp retreat from 1.0296 to 0.7401 suggests choppy trading would be seen but price should stay above said record low at 0.7068.
Weekend Risks Weigh On Investor Sentiment On Friday
- Safe havens preferred as geopolitics increase weekend risks;
- US indices seen lower after biggest daily losses in three months on Thursday;
- US inflation data and Fed speakers also in focus today.
As has been the case for much of the week, markets are heading into the weekend on a negative note as traders seek safety ahead of what could be a potential risky couple of days.
The war of words between Donald Trump and North Korean officials has stepped up in recent days and has put investors on edge, prompting a more risk averse approach in the markets. The weekend brings an undefined amount of risk for investors, with the potential for circumstances to escalate both dramatically and unexpectedly at a time when markets are closed.
It’s therefore unsurprising that safe havens are being preferred once again and I would be surprised if this doesn’t continue into the close, unless we see significant improvements over the course of the day. In the unlikely event that either side follows through on the threats of recent days and an attack occurs, we could see some dramatic moves at the open next week, something investors in perceived riskier assets would be very vulnerable to.
European equity markets are deep in the red early in the session – a typical response in risk-off trading – experiencing similar losses to those seen in the US on Thursday and Asia overnight. The S&P 500 and Dow broke through notable support over the last few weeks yesterday to make significant losses - the biggest percentage losses we’ve seen in almost three months – in a clear sign that investors are growing uneasy. Still, the moves we’re seeing don’t suggest to me that we’ve reached the stage in which investors are actually anticipating a military action from either side.
As we’ve seen over the last few days, the yen is making decent gains on Friday, benefiting from its status as a safe haven currency, although this could change in the event of a military strike from North Korea. The Swiss Franc is also making gains to a slightly lesser degree having made very strong gains on Wednesday which will undoubtedly raise questions about how active the Swiss National Bank is being in the FX markets. The central bank is obviously not averse to interventions. Gold has also continued its move towards $1,300 which has been a resistance zone over the last 10 months and a break above here would be a significant break and suggest investors are growing increasingly concerned.
Geopolitics aside, there will be a focus on US economic data and monetary policy today, with CPI inflation data being released and two Federal Reserve policy makers making an appearance. Inflation – or lack of - has been an ongoing problem for the central bank and some policy makers have voiced concerns about this in recent months as they consider whether to raise interest rates again this year. Should we see another dip in inflation in July, it could make the job of building a consensus for another rate hike this year more difficult.
CRUDE OIL Wide-Open For Further Weakness
Crude oil is trading lower. Hourly support is given at a distance at 45.40 (24/07/2017 low). Strong resistance can be found at 50.41 (31/07/2017). Expected to show short-term weakness.
In the long-term, crude oil has recovered after its sharp decline last year. However, we consider that further weakness are very likely. Strong support lies at 35.24 (05/04/2016) while resistance can now be found at 55.24 (03/01/2017 high).
SILVER Bullish Pressures Are On
Silver's bullish pressures are on. Hourly resistance lies 17.24 (10/08/2017 high) while support can be found at 16.13 (07/08/2017 high). Expected to show continued current bullish momentum.
In the long-term, the death cross indicates that further downsides are very likely. Resistance is located at 25.11 (28/08/2013 high). Strong support can be found at 11.75 (20/04/2009).
GOLD Strong Buying Demand
Gold is consolidating. Hourly support is given at 1251 (08/08/2017 low). Stronger support lies at 1204 (10/07/2017 high). The commodity is heading towards resistance given at 1296 (06/06/2017 high). Expected to push even higher.
In the long-term, the technical structure suggests that there is a growing upside momentum. A break of 1392 (17/03/2014) is necessary ton confirm it, A major support can be found at 1045 (05/02/2010 low)
BITCOIN All-Time High!
Bitcoin keeps on surging. The digital currency has broken hourly resistance given at 3478 (08/08/2017 high) and hourly support lies very far at 2403 (26/07/2017 low). The road is wide open for another bullish move.
In the long-term, the digital currency has had an exponential growth. There are decent likelihood that the asset will consolidate above $1500. Long-term support is given at $1464 (04/05/2017 low).
EUR/CHF Selling Pressures Are Back
EUR/CHF has consolidated and short-term selling pressures are definitely back on. Hourly support is now located at 1.1260 (04/08/2017 low). Expected to show continued weakness.
In the longer term, the technical structure has reversed. Strong resistance at 1.1200 (04/02/2015 high) has been broken. Yet,the ECB's QE programme is likely to cause persistent selling pressures on the euro, which should weigh on EUR/CHF. Supports can be found at 1.0184 (28/01/2015 low) and 1.0082 (27/01/2015 low).

EUR/GBP Consolidating Below 0.9100
EUR/GBP is trading around its highest levels of the year despite ongoing consolidation. Hourly resistance lies at 0.9087 (08/08/2017 high). Hourly support is given at a distance at 0.8742 (16/06/2017 low). Downside risks are nonetheless important.
In the long-term, the pair has largely recovered from recent lows in 2015. The technical structure suggests a growing upside momentum. The pair is trading above from its 200 DMA. Strong resistance can be found at 0.9500 psychological level.