
Sample Category Title
AUD/USD Growing Selling Pressures
AUD/USD's short-term technical structure is bearish. Hourly support at 0.7875 (21/07/2017 low) has been broken. Hourly resistance is given at 0.8066 (27/07/2017 high) . Expected to show continued decline.
In the long-term, we are waiting for further signs that the current downtrend is ending. Key supports stand at 0.6009 (31/10/2008 low) . A break of the key resistance at 0.8295 (15/01/2015 high) is needed to invalidate our long-term bearish view.
USD/CAD Short-Term Bullish Momentum Continues
USD/CAD's short-term bullish momentum continues. The road is wide open for further increase. Hourly support is given at a distance at 1.2414 (27/07/2017 low). Expected to show continued increase.
In the longer term, the pair has broken longterm support that can be found at 1.2461 (16/03/2015 low) before bouncing back. Strong resistance is given at 1.4690 (22/01/2016 high). The pair should head further lower.
USD/CHF Weakening
USD/CHF is weakening after the pair failed to monitor resistance at 0.9771 (15/06/2017 high). Hourly support at 0.9631 (01/08/2017 low) has been broken. Expected to to show further downside pressures towards 0.9500.
In the long-term, the pair is still trading in range since 2011 despite some turmoil when the SNB unpegged the CHF. Key support can be found 0.8986 (30/01/2015 low). The technical structure favours nonetheless a long term bullish bias since the unpeg in January 2015.
USD/JPY Ready For A Breaking Strong Support
USD/JPY's bearish momentum continues. The pair has failed to break resistance implied by the upper bound of the downtrend channel. The pair is heading towards 108.83 (17/04/2017 low). Expected to show further downside pressures.
We favor a long-term bearish bias. Support is now given at 96.57 (10/08/2013 low). A gradual rise towards the major resistance at 135.15 (01/02/2002 high) seems absolutely unlikely. Expected to decline further support at 93.79 (13/06/2013 low).
GBP/USD Monitoring Support At 1.2933
GBP/USD keeps on weakening. Hourly resistance is given at 1.3267 (03/08/2017 high). Hourly support is given at 1.2933 (20/07/2017 low). Expected to show further monitoring of support at 1.2933.
The long-term technical pattern is even more negative since the Brexit vote has paved the way for further decline. Long-term support given at 1.0520 (01/03/85) represents a decent target. Long-term resistance is given at 1.5018 (24/06/2015) and would indicate a long-term reversal in the negative trend. Yet, it is very unlikely at the moment.
EUR/USD Consolidating Below 1.1800
EUR/USD bullish pressures are still on despite ongoing consolidation. Hourly resistance is given at 1.1910 (02/08/2017 high). Hourly support can be found at 1.1715 (08/08/2017 high). Stronger support lies at 1.1613 (26/07/2017 low). Expected to show renewed bullish pressures.
In the longer term, the momentum is now turning largely positive. We favour a continued bullish bias. Key resistance holding at 1.1871 (24/08/2015 high) has been broken while strong support lies at 1.0341 (03/01/2017 low).
Trade Idea: GBP/USD – Sell at 1.3055
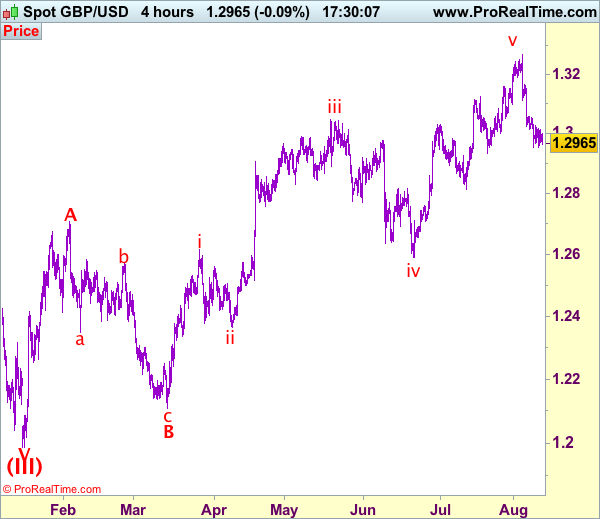
GBP/USD – 1.2962
Recent wave: Wave V of larger degree wave (III) has ended at 1.1986 and major correction has commenced from there for gain to 1.3000 and 1.3140-50
Trend: Near term up
Original strategy :
Sell at 1.3055, Target: 1.2860, Stop: 1.3115
Position: -
Target: -
Stop: -
New strategy :
Sell at 1.3055, Target: 1.2860, Stop: 1.3115
Position: -
Target: -
Stop:-
As cable has remained under pressure after recent selloff from 1.3269 top, reinforcing our bearish view that the fall from 1.3269 top is still in progress and downside bias remains for this move to bring retracement of recent upmove, hence further weakness to previous support at 1.2933 would be seen, break there would extend decline to 1.2890-00 and possibly towards 1.2850-60, however, previous support at 1.2812 would hold from here, bring another rebound later.
In view of this, would not chase this fall here and would be prudent to sell cable on subsequent recovery as resistance at 1.3059 should limit upside and bring another decline. Only above previous support at 1.3112 (now resistance) would abort and signal the fall from 1.3269 has ended instead, bring a stronger rebound to indicated resistance at 1.3165 first.
Our preferred count on the daily chart is that cable's rebound from 1.3500 (wave (A) trough) is unfolding as a wave (B) with A ended at 1.7043, followed by triangle wave B and wave C as well as wave (B) has ended at 1.7192, the subsequent selloff is the larger degree wave (C) which is still unfolding with minor wave (III) of larger degree wave 3 ended at 1.1986, hence wave (IV) correction is in progress which could either be a triangle wave (IV) of a complex formation but upside should be limited to 1.3500 and price should falter well below 1.4000, bring another decline in wave (V) of 3 for weakness to 1.1500, then 1.1200.
Trade Idea: GBP/JPY – Sell at 142.50
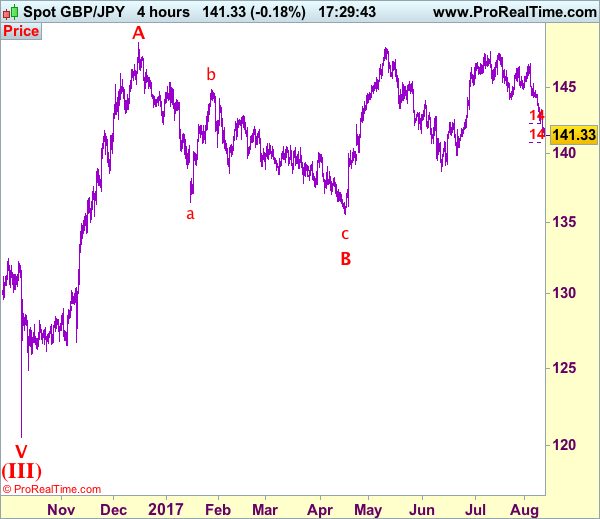
GBP/JPY - 141.40
Recent wave: Medium term low formed at 120.50 and (A)-(B)-(C) major correction has commenced with (A) leg ended at 148.45, hence wave (B) is unfolding for retreat to 131.00-10.
Trend: Near term up
Original strategy:
Sell at 143.60, Target: 141.60, Stop: 144.20
Position: -
Target: -
Stop: -
New strategy :
Sell at 142.50, Target: 140.50, Stop: 143.10
Position: -
Target: -
Stop:-
Sterling has dropped again after brief recovery to 143.30, adding credence to our bearish view that recent decline from 147.75 top is still in progress for retracement of early upmove and downside bias remains for this fall to extend weakness to 140.80-85 (1.618 times projection of 147.75-144.05 measuring from 146.80), however, near term oversold condition should prevent sharp fall below 140.50 and reckon psychological support at 140.00 would hold from here, bring rebound later.
In view of this, would not chase this fall here and would be prudent to sell sterling on recovery as 142.40-50 should limit upside and bring another decline later. Above 142.80-85 would defer and risk rebound to said resistance at 143.30, however, a sustained breach above this level is needed to signal a temporary low is formed, bring a stronger rebound to 143.90-00.
Our preferred count is that larger degree wave V with circle is unfolding from 251.12 with wave (I) 219.34, (II): 241.38 and wave (III) is subdivided into 1: 192.60, 2: 215.89 (23 Jul 2008) and wave 3 ended at 118.87 earlier in 2009. The correction from there to 162.60 is wave 4 which itself is a double three and is labeled as first a-b-c ended at 151.53, followed by wave x at 139.03, 2nd a ended at 162.60, 2nd b at 146.75 and 2nd c leg of wave 4 ended at 163.00. Therefore, the decline from 163.00 to 116.85 is now treated as wave 5 which also marked the end of larger degree wave (III), hence wave (IV) major correction has commenced for retracement of the wave (III) from 241.38 and upside target at 183.95-00 (50% Fibonacci retracement of the wave (II) from 241.38) had been met, a drop below 160.00 would suggest wave (IV) has ended at 195.85, bring decline in wave (V) for initial weakness to 130 (already met) and 120.
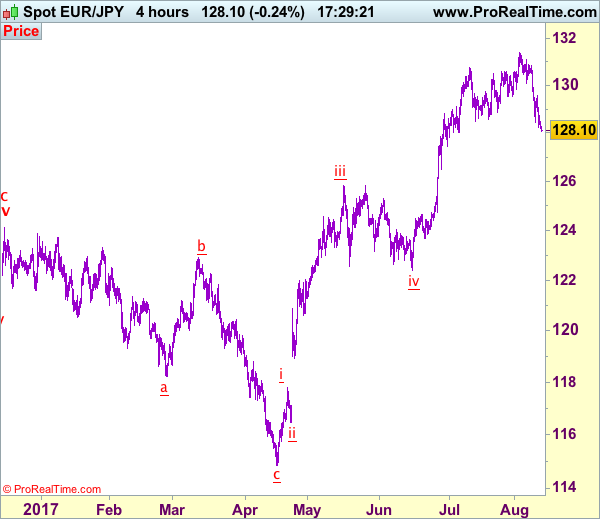
Trade Idea: EUR/JPY – Hold short entered at 129.50
EUR/JPY - 128.15
Recent wave: wave v of (C) ended at 94.12 and major correction in wave A has ended at 149.79
Trend: Near term up
Original strategy:
Sold at 129.50, Target: 127.50, Stop: 130.10
Position: - Short at 129.50
Target: - 127.50
Stop: - 130.10
New strategy :
Hold short entered at 129.50, Target: 127.50, Stop: 128.60
Position: - Short at 129.50
Target: - 127.50
Stop:- 128.60
As the single currency has fallen again after meeting renewed selling interest at 129.56 yesterday as suggested, justifying our bearish view for the decline from 131.40 top to bring retracement of early upmove to 128.00, then towards previous support at 127.44, however, near term oversold condition should limit downside to 127.00, risk from there has increased for a rebound to take place later.
In view of this, we are holding on to our short position entered at 129.50. Above 128.50 would risk rebound to 129.00 but only break of said resistance at 129.56 would abort and signal low is formed instead, bring a stronger rebound to 130.00-09 (previous support).
Our latest preferred count is that wave (ii) is ABC-X-ABC which ended at 123.33 and wave (iii) is unfolding with wave iii ended at 100.77, followed by wave iv at 111.57 and wave v as well as the wave (iii) has ended at 97.04, followed by wave (iv) at 111.43 and wave (v) has ended at 94.12 which is also the end of the larger degree v, this also implied the major wave (C) has also ended there, hence major correction has commenced from there with (A) leg unfolding in its lower degree wave c which has possibly ended at 145.69. Under this count, A-B-C wave (B) has commenced with A leg ended at 136.23, wave B at 143.79 and wave C has possibly ended at 149.79.
Our larger degree count is that the decline from 139.26 is wave (C) and is sub-divided into a diagonal triangle i-ii-iii-iv-v with wave i - 105.44, wave ii- 123.33, wave iii - 97.03, wave iv - 111.43, followed by the final wave v as well as the end of wave (C) at 94.12, this also mark the bottom of larger degree wave B. Under this count, major rise in wave C has commenced as an impulsive wave with minor wave III ended at 145.69, wave V is still in progress for further gain to 150.00. Having said that, this so-called wave V could well be the first leg of larger degree 5-waver wave C and this wave C should bring at least a retest of wave A top at 169.97 (July 2008).
Trade Idea: AUD/USD – Stand aside
AUD/USD – 0.7850
Recent wave: Wave 5 ended at 1.1081 and major correction has commenced for fall to 0.7000 and then towards 0.6500-10
Trend: Near term up
New strategy :
Stand aside
Position: -
Target: -
Stop:-
Although aussie has continued trading lower after recent anticipated decline and near term downside risk remains for the corrective fall from 0.8066 top to bring retracement of early upmove in wave iv to 0.7839 (previous resistance tuned support) and possibly 0.7800, near term oversold condition should prevent sharp fall below 0.7786 support and price should stay above wave i top at 0.7712, bring rebound later.
In view of this, would not chase this fall here and would be prudent to stand aside for now. On the upside, expect recovery to be limited to 0.7900 and bring another decline later. Above 0.7940-45 would suggest low is possibly formed and bring test of indicated resistance at 0.7980, break there would add credence to this view, bring a stronger rebound to 0.8000, then towards 0.8043 resistance, above there would signal the pullback from 0.8066 top has ended instead, bring retest of this level first. We are keeping our latest bullish count that recent impulsive waves is unfolding as (1 2, (i)(ii), i ii) and may extend headway towards 0.8150.
On the 4-hour chart, the move from 0.8066 is the wave 5 with i: 0.8860, ii: 0.8315, wave iii is an extended move ended at 1.0183, iv: 0.9706 and wave v has ended at 1.1081 (also the top of entire wave 5). The subsequent selloff is the major correction which is unfolding as ABC-X-ABC and 2nd A leg has ended at 0.8848, followed by a-b-c wave B which ended at 0.9758, hence, 2nd C wave is now in progress and indicated downside target at 0.7000 and 0.6950 had been met, so further fall to 0.6710-20 cannot be ruled out.
