Sample Category Title
GBPUSD Intraday Analysis
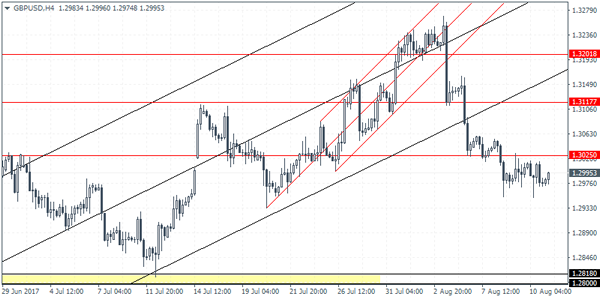
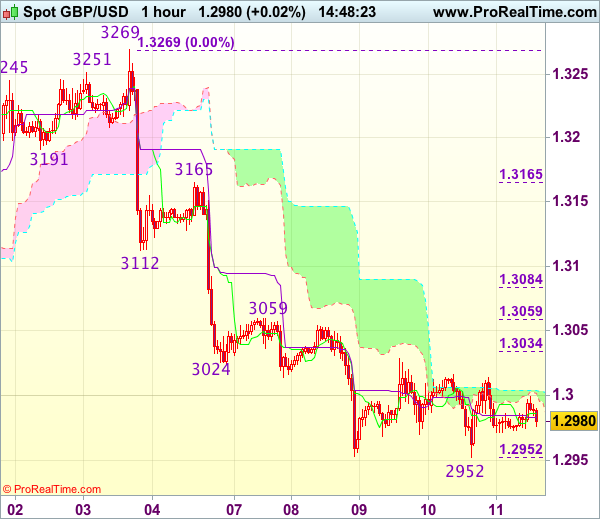
GBPUSD (1.2995): The GBPUSD currency pair continues to trade below the support level at 1.3025. However, price action has remained limited so far. On the 4-hour chart, we can anticipate another test back to 1.3025. It is essential that GBPUSD will post a reversal here establishing resistance. This will pave the way for a decline towards 1.2818 - 1.2800. To the upside, a breakout above 1.3025 could signal further gains that could push GBPUSD towards 1.3177. We expect the declines to come through sometime next week when the UK's inflation and wage data will be published.
EURUSD Intraday Analysis
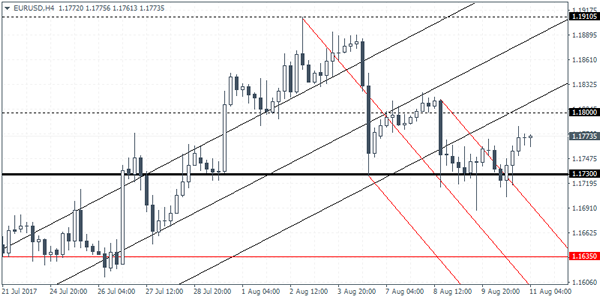
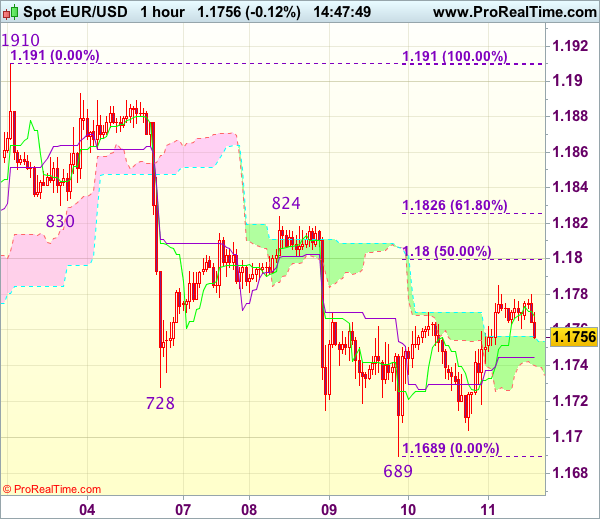
EURUSD (1.1773): The EURUSD continued to stay firmly supported above the short-term support level at 1.1730. Price action has managed to bounce off this level, and the failure to break down below this support will now see a retracement back to 1.1800. Establishing resistance here will be critical for the further direction in the currency pair. Above 1.1800, further gains in EURUSD could signal a short-term upside in prices. The next level of interest to the upside will be likely at 1.1900. To the downside, if we see a reversal at 1.1800, EURUSD could remain range bound within the levels, but the bias could shift to the downside. Eventually, if EURUSD breaks below 1.1730, then we can expect to see a decline to 1.1635 support.
Gold Gains On Mounting North Korea Tensions
Gold and other safe haven assets including the Japanese yen and the Swiss franc maintained the gains as investors flocked to the safe haven assets. Rising tensions between the United States and North Korea have kept the investor risk appetite in check. After North Korea had dismissed the warnings from Trump, the president said that his previous statement might not have been enough.
The US equity markets understandably fell with the Dow Jones losing 204.69 points while the CBOE volatility index spiked, signaling caution in the equity markets.
On the economic front, the UK's manufacturing and industrial data was a mixed bag. Most of the gains came from the oil and gas industry in an otherwise flat print on manufacturing.
Looking ahead, the US consumer price index data will be coming out today. Forecasts point to an uptick in inflation, which could help to boost the sentiment in the U.S. dollar.
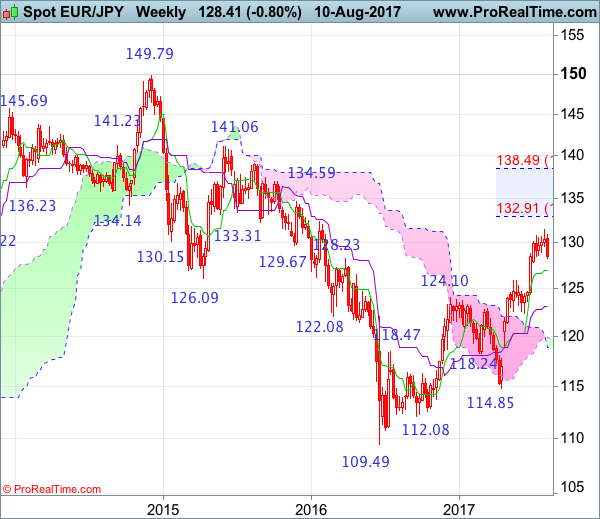
EUR/JPY Candlesticks and Ichimoku Analysis
Weekly
• Last Candlesticks pattern: Window
• Time of formation: 24 April 2017
• Trend bias: Up
Daily
• Last Candlesticks pattern: Hammer
• Time of formation: 18 May 2017
• Trend bias: Up
EUR/JPY – 128.45
Although the single currency extended recent upmove and rose to as high as 131.40 last week, the subsequent sharp retreat suggests a temporary top has possibly been formed there, hence consolidation with mild downside bias is seen for retracement of recent upmove to 127.95-00 (38.2% Fibonacci retracement of 122.38-131.40), then 127.40-45 support, however, near term oversold condition should limit downside to 126.85-90 (50% Fibonacci retracement) and price should stay above the upper Kumo (now at 126.15), bring rebound later.
On the upside, whilst recovery to 128.90-00 cannot be ruled out, reckon 129.55-60 would limit upside and bring another decline later. A daily close above the Tenkan-Sen (now at 129.81) would defer and suggest 1st leg of decline from 131.40 top has ended instead, risk a stronger rebound to 130.00, then 130.40-50 but resistance at 130.83 should hold, bring another decline later. A break above this level would suggest pullback from 131.40 has ended and bring retest of this level but only break there would revive bullishness and extend recent upmove to 132.00, then towards previous resistance at 132.33.
Recommendation: Exit long entered at 128.65 and turn short at 129.50 for 127.00 with stop above 130.50
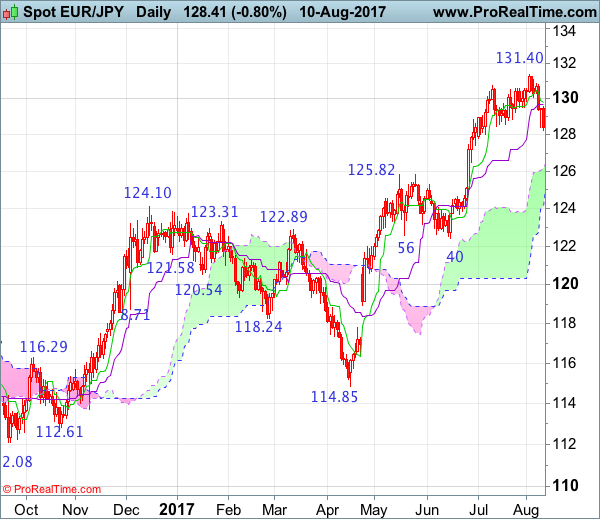
On the weekly chart, despite last week’s marginal rise to 131.40, this week’s sharp retreat looks set to form a black candlestick, suggesting consolidation below this level would be seen and downside risk is for correction to 128.00, then test of the Tenkan-Sen (now at 126.90), however, a weekly close below there is needed to signal a temporary top is formed, bring retracement of recent upmove to 126.40-50 but previous resistance at 125.81 should turn into support and limit euro’s downside, reckon 124.50 would remain intact, bring rebound later.
On the upside, expect recovery to be limited to 129.50 and bring another decline. Above 130.00 would bring recovery to 130.50 but resistance at 130.83 should hold and bring another retreat later. Above 130.83 would bring retest of 131.40 but only break there would revive bullishness and extend major upmove from 109.49 low to 131.90-00, then test of previous chart resistance at 132.33, however, overbought condition should limit upside to 133.00-10, risk from there is seen for a retreat to take place later.
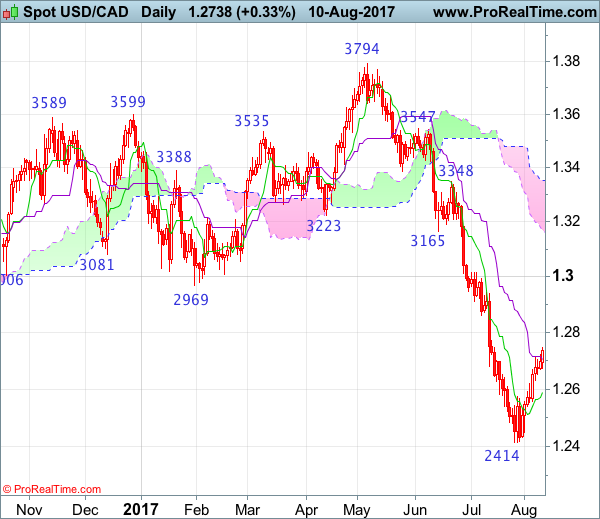
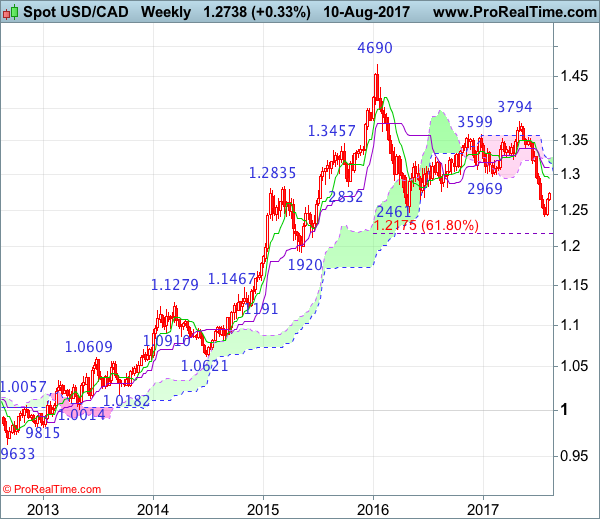
USD/CAD Candlesticks and Ichimoku Analysis
Weekly
• Last Candlesticks pattern: Shooting doji
• Time of formation: 01 May 2017
• Trend bias: Sideway
Daily
• Last Candlesticks pattern: Bearish engulfing
• Time of formation: 5 May 2017
• Trend bias: Down
USD/CAD – 1.2740
The greenback has edged higher after recovering from 1.2414, retaining our view that consolidation above this level would be seen and although gain to 1.2770-75 cannot be ruled out, reckon upside would be limited to 1.2805-10 and bring another decline later, below the Tenkan-Sen (now at 1.2584) would bring weakness to 1.2500-05, however, break of said support at 1.2414 is needed to confirm decline has resumed and extend weakness to 1.2350-60 and later towards 1.2300 but price should stay well above 1.2240-50, risk from there has increased for a rebound to take place later.
On the upside, whilst initial recovery to 1.2770-75 cannot be ruled out, reckon upside would be limited to 1.2800-10 and bring another decline later. Above previous support at 1.2859 (now resistance) would defer and suggest a temporary low is formed instead, bring a stronger rebound to 1.2900-05, however, still reckon upside would be limited to 1.2940-45 and price should falter below resistance at 1.3015.
Recommendation: Sell at 1.2800 for 1.2600 with stop above 1.2900.
On the weekly chart, last week’s rebound formed a white candlestick, retaining our view that consolidation above support at 1.2414 would be seen and initial upside risk remains for recovery to 1.2770-75, however, still reckon upside would be limited to 1.2800-05 and bring another decline later. Below 1.2600 would bring weakness to 1.2550, then 1.2500, however, break of support at 1.2414 is needed to signal medium term fall from 1.4690 top has resumed and extend weakness to 1.2300-10 but oversold condition should prevent sharp fall below 1.2240-50 and price should stay above 1.2175 (61.8% Fibonacci retracement of 1.0621-1.4690).
On the upside, although initial recovery to 1.2770-75 cannot be ruled out, reckon upside would be limited to 1.2805-10 resistance and bring another decline later. Above previous support at 1.2859 (now resistance) would suggest a temporary low is possibly formed, bring a stronger rebound to 1.2900, then towards resistance at 1.2944, however, reckon the Tenkan-Sen (now at 1.2978) would hold. Only a weekly close above the Tenkan-Sen (now at 1.2978) would shift risk to upside for a strong rebound to to 1.3015 resistance, then 1.3050-60 but price should falter below the Kijun-Sen (now at 1.3104) and bring another selloff in late Q3.
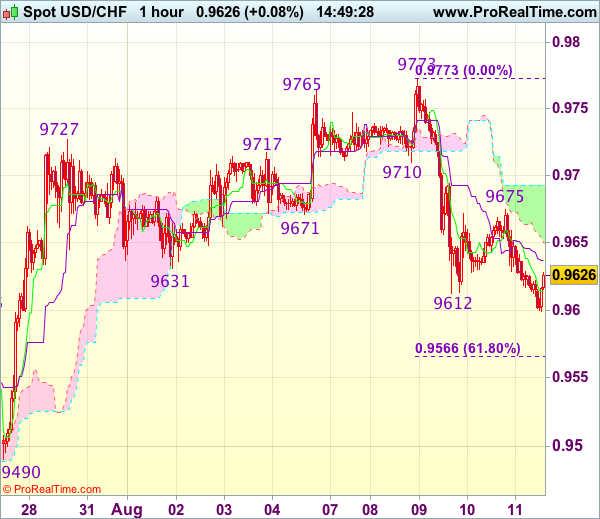
Trade Idea : USD/CHF – Sell at 0.9740 or buy at 0.9610
USD/CHF - 0.9630
Most recent candlesticks pattern : N/A
Trend : Near term up
Tenkan-Sen level : 0.9616
Kijun-Sen level : 0.9637
Ichimoku cloud top : 0.9693
Ichimoku cloud bottom : 0.9650
Original strategy :
Sell at 0.9710, Target: 0.9610, Stop: 0.9745
Position : -
Target : -
Stop : -
New strategy :
Sell at 0.9740, Target: 0.9620, Stop: 0.9775
O.C.O.
Buy at 0.9610, Target: 0.9710, Stop: 0.9575
Position : -
Target : -
Stop : -
Although the greenback fell briefly to 0.9599, lack of follow through selling on break of previous support at 0.9612 and current rebound suggest consolidation with mild upside bias would be seen and test of resistance at 0.9675 cannot be ruled out, however, break there is needed to signal an intra-day low is formed, bring test of the upper Kumo (now at 0.9693) but previous support at 0.9710 should limit upside and renewed selling interest should emerge around 0.9740-50, bring another decline later.
In view of this, whilst we are still looking to sell dollar on subsequent rebound, we would turn long on dips. Below said support at 0.9599 would extend the corrective decline from 0.9773 top for retracement of early upmove to 0.9565-70 (61.8% Fibonacci retracement of 0.9438-0.9773).
Trade Idea : GBP/USD – Stand aside
GBP/USD - 1.2980
Most recent candlesticks pattern : N/A
Trend : Near term down
Tenkan-Sen level : 1.2986
Kijun-Sen level : 1.2983
Ichimoku cloud top : 1.3003
Ichimoku cloud bottom : 1.2996
New strategy :
Stand aside
Position : -
Target : -
Stop : -
Despite falling marginally to 1.2952 yesterday, lack of follow through selling and the subsequent rebound suggest further consolidation would take place and another bounce to 1.3025-30 cannot be ruled out, however, reckon upside would be limited to resistance at 1.3059 and price should falter below 1.3085-90 and bring another decline later.
On the downside, below support at 1.2952-53 would signal recent fall from 1.3269 top has resumed and extend weakness to previous chart support at 1.2933 but reckon 1.2900 would hold from here, risk from there has increased for a rebound to take place later.
Trade Idea : EUR/USD – Buy at 1.1725
EUR/USD - 1.1759
Most recent candlesticks pattern : N/A
Trend : Near term up
Tenkan-Sen level : 1.1768
Kijun-Sen level : 1.1745
Ichimoku cloud top : 1.1757
Ichimoku cloud bottom : 1.1740
Original strategy :
Sold at 1.1770, stopped at break-even
Position : - Short at 1.1770
Target : -
Stop : - 1.1770
New strategy :
Buy at 1.1725, Target: 1.1825, Stop: 1.1690
Position : -
Target : -
Stop : -
As the single currency continued finding support just above this week’s low at 1.1689 and has rebounded, suggesting low is possibly formed there and consolidation with mild upside bias is seen for test of 1.1800 (50% Fibonacci retracement of 1.1910-1.0689), however, break of 1.1824-26 (previous resistance and 61.8% Fibonacci retracement) is needed to signal the fall from 1.1910 has ended and bring further gain to 1.1850 later.
In view of this, we are looking to turn long on dips. Below said support at 1.1689 would abort and signal the fall from 1.1910 top is still in progress for retracement of early upmove to 1.0670, then test of support at 1.1650.
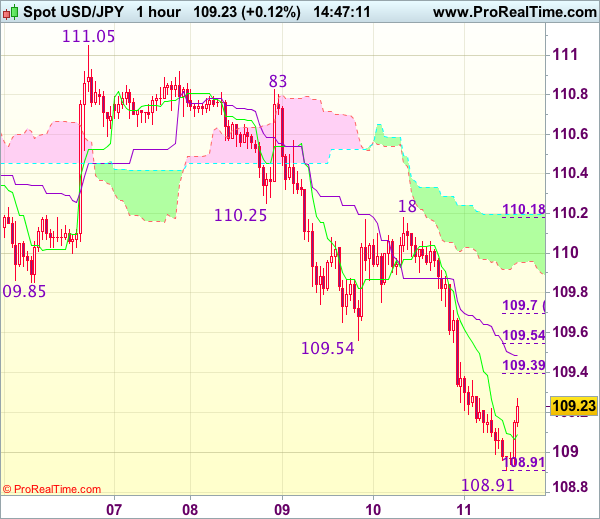
Trade Idea : USD/JPY – Sell at 109.70
USD/JPY - 109.20
Most recent candlesticks pattern : N/A
Trend : Near term down
Tenkan-Sen level : 109.09
Kijun-Sen level : 109.49
Ichimoku cloud top : 110.20
Ichimoku cloud bottom : 109.95
New strategy :
Sell at 109.70, Target: 108.70, Stop: 110.05
Position : -
Target : -
Stop : -
Although the greenback extended recent fall and dropped to 108.91 earlier today, current rebound suggests consolidation above this level would be seen and test of the Kijun-Sen (now at 109.49) is likely, however, reckon 109.70 (61.8% Fibonacci retracement of 110.18-108.91) would limit upside and bring another decline, below said support at 108.91 would extend recent fall to previous support at 108.82, break there would bring subsequent fall towards 108.50 but price should stay above chart support at 108.13.
In view of this, would not chase this fall here and would be prudent to sell dollar on recovery as 108.70 should limit upside. Only break of resistance at 110.18 would abort and signal recent decline has ended and risk a stronger rebound to 110.50 but price should falter below another previous resistance at 110.83.
Elliott Wave View: Gold More Upside
Short term Gold (XAUUSD) Elliott Wave view suggests that rally from 7/10 low is unfolding as a a double three Elliott wave structure. Up from 7/10 low (1204.69), Minor wave W ended at 1274.11 and pullback to 1251.27 ended Minor wave X. Wave Y is currently in progress as a zigzag Elliott wave structure where Minute wave ((a)) is expected to complete with one more leg higher and can reach as high as 1294.3 – 1304.6, then it should pullback in Minute wave ((b)) before the rally resumes, We don’t like selling Gold and expect buyers to appear again after Minute wave ((b)) pullback is complete in 3, 7, or 11 swing, provided pivot at 1251.27 low remains intact.
Gold 1 Hour Elliott Wave Chart
According to Elliott wave theory, Zigzag is a 3 waves structure having an internal subdivision of (5-3-5) swing sequence. The internal swing is labeled as A, B, C where A = 5 waves, B = 3 waves and C = 5 waves. This means that A and C can be impulsive or diagonal. The A and C waves must meet all the conditions of 5 waves structure, such as: having an RSI divergence, ideal Fibonacci extensions, ideal retracements etc. For illustration purpose, in a bearish zigzag graphic below, we can see what Elliott Wave Zig Zag structure looks like. 5 waves down in A, 3 wave bounce in B and another 5 waves down in C.