Sample Category Title
XAU/USD Analysis: Finds Support Level At 1,261.94
In the second half of Wednesday the Greenback appreciated against all major currencies, including the gold. Most probably, it was related to the sanctions bill as well as high earnings posted by large American companies. In any case, the downside momentum was strong enough to drive the pair through the bottom trend-line of an ascending channel. Fortunately for the yellow metal, the barrier set up by the weekly PP at 1,261.94 and that became additionally secured by the approached 200-hour SMA managed to stop the downfall and even forced the pair to make a rebound. As a result, today the bullion will try to get back into formation, break through the 55- and 100-hour SMAS and try to reach the 1,272.24 level. Various technical indicators support this scenario, pointing out the pair is oversold.
Can Gold Price Remain Above $1255 Vs US Dollar?
Key Highlights
- Gold price after trading towards $1275 found resistance and declined sharply against the US Dollar.
- There are two important bullish trend lines forming with supports at $1258 and $1255 on the 4-hours chart of XAU/USD.
- Today, the Caixin China Services PMI for July 2017 was released, which posted a minor decline from 51.6 to 51.5.
- The US Services PMI will be released today for July 2017, which is slated to remain at 54.2.
Gold Price Technical Analysis
Gold price is in a solid uptrend and trading comfortably above $1250 against the US Dollar. The price after trading as high as $1274 started a correction and currently testing a major support.
It has already moved below the 23.6% Fib retracement level of the last wave from the $1243.77 low to $1274.15 high. However, the downside move was protected by the $1255 support.
There are two important bullish trend lines forming with supports at $1258 and $1255 on the 4-hours chart of XAU/USD. Moreover, the 50% Fib retracement level of the last wave from the $1243.77 low to $1274.15 high is at $1258.
All these are important supports near $1255-60. As long as these are intact, there are chances of Gold resuming its uptrend back towards $1270 in the near term.
Caixin China Services PMI
Today, the Caixin China Services PMI for July 2017 was released. The market was looking for an increase in the PMI from the last reading of 51.6 to 51.9.
However, the actual result was opposite, as there was a minor decline from 51.6 to 51.5. On the other hand, the Composite Output Index posted a decent rise from June's low of 51.1 to 51.9 in July 2017, which is a new four-month high.
The report added that:
New business also expanded at a weaker pace across the service sector in July. Furthermore, the rate of growth edged down to the least marked for 16 months, with some panellists linking relatively subdued sales to lower client numbers.
Overall, the result was positive, and helped Gold to remain above the $1255-60 support area.
Today's Economic Releases during NY Session
- US Services PMI for July 2017 - Forecast 54.2, versus 54.2 previous.
- US ISM Non-Manufacturing Index for July 2017 - Forecast 57.0, versus 57.4 previous.
- US Initial Jobless Claims - Forecast 242K, versus 244K previous.
- US Factory Orders June 2017 (MoM) - Forecast +2.8%, versus -0.8% previous.
USD/JPY Analysis: Fails To Bypass 200-Hour SMA
Yesterday the USD/JPY failed to soar towards the weekly PP at 111.15. The reason behind the 53-pips drop, most probably, was attributed to the 200-hour SMA that created an impassable resistance barrier. Nevertheless, from the other side the fall of the rate was also constrained by the 55-hour SMA near 110.43. Since the pair proved to be sensitive to these two technical indicators, they can be temporarily marked as closest support and resistance levels, between which the pair is expected to move during today's trading session. However, given that the upside momentum hasn't come to an end yet, the buck most likely is going to continue to try to move to the top. A necessary impulse might be given by announcement of the US ISM Non-Manufacturing PMI and Factory Orders at 14:00 GMT.
GBPUSD Analysis: Waits For BoE Decision
In late Wednesday, the currency exchange rate made an attempt to break from a supposed head and shoulders pattern. However, the weekly R1 at 1.3200 once again proved to be a very meaningful barrier for the Pound. To certain extent, the rebound was also triggered by the approached 55-hour SMA that has additionally strengthened the above support level. From a technical perspective, the rest of the day the pair should spend in the surge towards the weekly R2 at 1.3264. However, at 14:00 GMT the Bank of England will announce the Official Bank Rate and, afterwards, Governor Carney will make remarks about this decision. Depending on the result, the Pound might surge or fall by 60-110 basis points, which means that it might be thrown from the currency ascending channel by traders' reaction.
EUR/USD Analysis: Makes A Rebound Near 1.1828
In line with expectations, during the previous trading session the currency exchange rate managed to soar to the weekly R2 at 1.1878 and made a subsequent rebound from it. Despite the 23-pip depreciation of the Euro, the pair did not fall beyond the 55-hour SMA near 1.1828, as it was additionally protected by the support line of a rising wedge. Hence, in first half of Thursday, the rate is expected to resume the surge towards the above weekly R2. However, then two scenarios might happen. Either the pair will bounce off from it and, thus, repeat yesterday's scenario, or it will succeed to break to the top and, thus, continue to gradually move within the active pattern. The seconds scenario seems more realistic, especially taking into account that the rate continues to move along the above 55-hour SMA.
AUD/USD: Australian Trade Balance
The release of the country's trade balance figures failed to provide any support for the Australian Dollar, with AUD/USD tumbling 0.09% to hit the 0.7928 mark right after the data came out. Following the release, the Aussie continued to weaken against the Greenback, sliding towards the 0.79248 level through the early morning session. The Australian Bureau of Statistics reported the country's trade surplus narrowed more than expected in June, falling sharply to A$856M from the downwardly-revised A$2.02B surplus seen in the previous month. However, despite the weaker-than-expected data, the Australian economy seems to have picked up steam from the sluggish March quarter, as consumer and business spending were seen climbing recently.
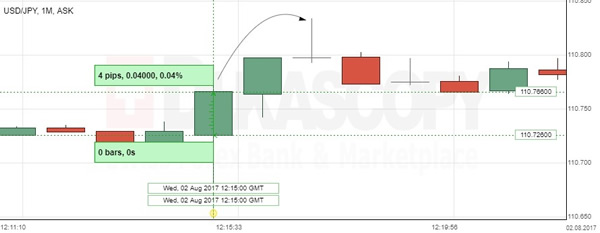
USD/JPY: US ADP Non-Farm Payrolls
The USD/JPY exchange rate edged higher after the private survey showed a modest increase in job creation. After the publication, the US Dollar rose against the Japanese Yen by 0.04% to reach the 110.76 mark. ADP reported that non-farm sectors added 178K jobs in July, the second weakest change this year, compared with the upwardly-revised 191K increase in the previous month. According to the report, a slight fall in manufacturing jobs was offset by higher employment for service-related positions. Figures suggested that job creation remained strong enough to see the economy nearing to full employment. However, preliminary data is unlikely to determine the current condition of the US labour market, as the official report is set to come in on Friday.
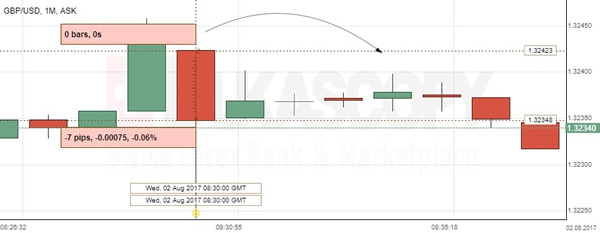
GBP/USD: UK Construction PMI
The British Pound depreciated against the US Dollar, as the data revealed that the UK construction industry grew at the slowest pace in 11 months in July. After the report, the GDP/USD exchange rate fell by 0.06% to be seen trading at 1.3234. Markit revealed that its PMI for Britain's construction sector dropped to 51.5 in July, below forecasts for a modest decline to 54.5 points. The report showed a decrease in commercial development and weaker house building, which reflected a slowdown in the property market. Moreover, post-election uncertainties and unclarity surrounding the country's economic outlook resulted in subdued demand for construction, while firms revealed less confidence about the future of the sector.
EUR/GBP Elliott Wave Analysis
EUR/GBP – 0.8932
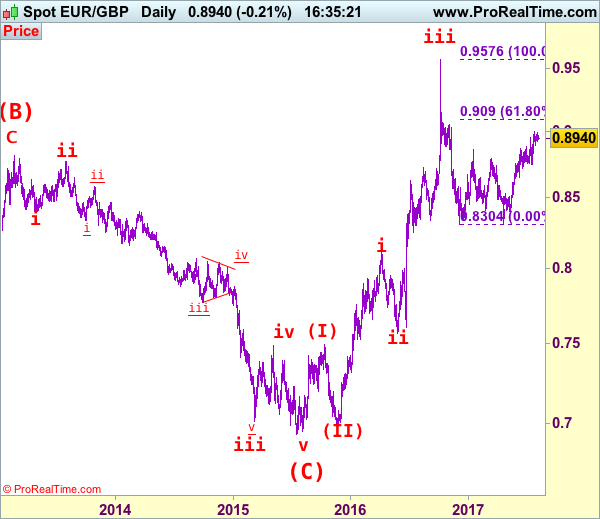
EUR/GBP – The major (A)(B)(C)-(X)-(A)(B)(C) correction from 0.9805 is unfolding and 2nd (A) has possibly ended at 0.6936.
As the single currency has maintained a firm undertone after breaking above previous resistance at 0.8950, adding credence to our bullish view that recent rise from 0.8304 (Dec 2016) is still in progress and upside bias remains for further gain to psychological resistance at 0.9000, break there would encourage for headway to 0.9090 (61.8% Fibonacci retracement of 0.9576-0.8304), having said that, break of previous resistance at 0.9142 is needed to signal the retreat from 0.9576 top (2016 high) has ended at 0.8304, bring headway to 0.9200-10 first.
Our latest preferred count is that the wave V of a 5-wave series from 0.5682 ended at 0.9805 earlier and major from there has possibly ended at 0.8067 as A-B-C-X-A-B-C. We are keeping our view that the entire correction from 0.9805 has possibly ended at 0.7756 and as labeled as the attached daily chart and impulsive move from 0.9084 has ended at 0.7756 as a 5-waver which marked either the (C) wave or the A leg of (C), a daily close above resistance at 0.8831 would suggest (C) leg has ended and headway towards 0.9084.
On the downside, whilst initial pullback to 0.8845-50 cannot be rule out, reckon 0.8825-30 would limit downside and bring another rise later. A daily close below 0.8780-85 would defer and suggest a temporary top is possibly formed, bring test of support at 0.9743 but break there is needed to add credence to this view, bring retracement of recent upmove to 0.8700, then towards previous support at 0.8652 which is likely to hold from here.
Recommendation: Buy at 0.8830 for 0.9030 with stop below 0.8730
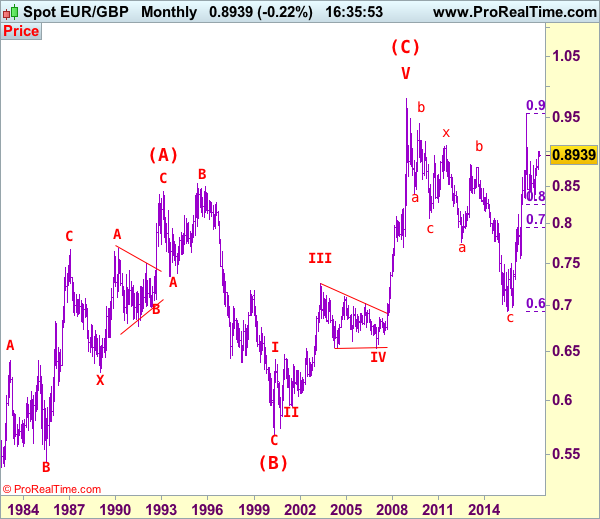
Euro's long term uptrend started in Feb 1981 at 0.5039 and is unfolding as a (A)-(B)-(C) move with (A): 0.8433 (Feb 1993), (B): 0.5682 (May 2000) and impulsive wave (C) should have ended at 0.9805 with wave III ended at 0.7254 (May 2003), triangle wave IV at 0.6536 (23 Jan 2007) and wave V as well as wave (C) has ended at 0.9805.
We are keeping an alternate count that only wave III ended at 0.9805 and the correction from there is the wave IV and may extend weakness to 0.7700, however, it is necessary to see a daily close above resistance at 0.9143 would change this to be the preferred count.
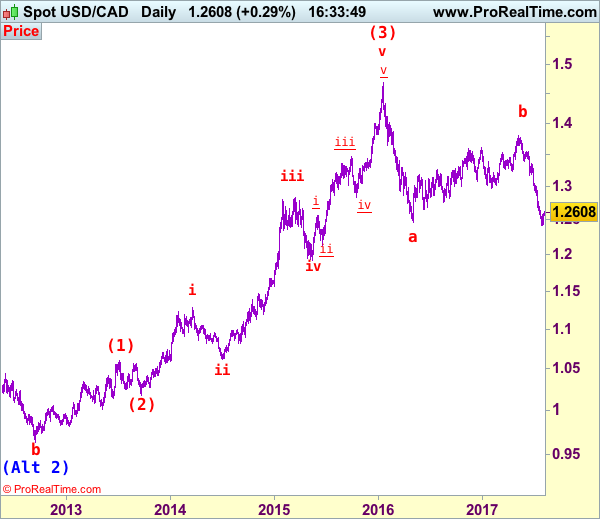
USD/CAD Elliott Wave Analysis
USD/CAD – 1.2607
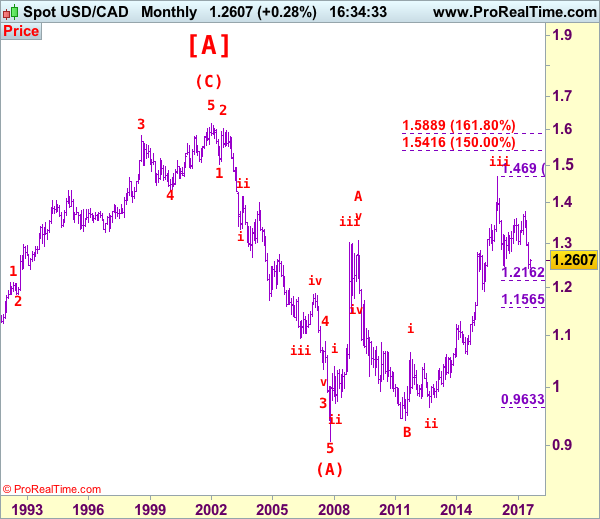
USD/CAD – Wave v ended at 0.9407 and only wave (3) of c ended at 1.4690 and one more rise cannot be ruled out.
The greenback finally recovered after falling to 1.2414 late last month and consolidation above this level would be seen initially and corrective bounce to 1.2700, then 1.2770-75 cannot be ruled out, however, reckon previous support at 1.2859 would cap upside and bring another decline later, below 1.2451 would bring retest of 1.2414 but break there is needed to confirm recent wave c decline has resumed for weakness to 1.2350, then 1.2300 but loss of momentum should prevent sharp fall below 1.2200-10 and price should stay well above 1.2000 level, bring rebound later. We are keeping our bearish count that wave b ended at 1.3794 and wave c has commenced for further fall to aforesaid downside targets.
We are keeping our view that the wave b from 1.0657 (a leg top) has possibly ended at 0.9633 with (a): 0.9800, wave (b): 1.0447 and wave c at 0.9633, the subsequent rise from there is now treated as wave c exceeded indicated upside target at 1.3770-80 and 1.4000 and wave (3) has possibly ended at 1.4690 and wave (4) correction has commenced for retracement back to 1.2410-20, then towards 1.2200.
On the daily chart, our latest preferred count remains that the A of (B) rally from 0.9059 low (7 Nov 2007) unfolded into an impulsive wave with i: 0.9059-1.0380, ii ended at 0.9819, iii at 1.3019 followed by triangle wave iv at 1.2026 , then wave v formed a top at 1.3066 and also ended the wave A. The wave B is unfolding as an double three a-b-c-x-a-b-c and is sub-divided as a: 1.2192, b: 1.2716 and wave c at 1.0784, followed by wave x at 1.1725, another set of a-b-c unfolded with 2nd a at 0.9931, 2nd b at 1.0674. the 2nd c has possibly ended at 0.9407, therefore, consolidation with upside bias is seen for major correction, indicated target at 1.3900 had been met and gain to 1.4700 would follow.
On the upside, whilst initial recovery to 1.2700 cannot be ruled out, reckon upside would be limited to 1.2770-75 and renewed selling interest should emerge there, bring another decline to aforesaid downside targets. Above previous support at 1.2859 would defer and risk a stronger rebound to resistance at 1.2944 but upside should be limited to psychological resistance at 1.3000 and price should falter well below another previous support at 1.3165 (now resistance), bring another decline later.
Recommendation: Sell at 1.2770 for 1.2470 with stop above 1.2870.
Longer term - The selloff from 1.6194 (21 Jan 2002) to 0.9059 (07 Nov 2007) is viewed as (A) wave which is a 5-waver as labeled on the monthly chart as below, the subsequently rally is labeled as (B) with impulsive A leg of (B) ended at 1.3066, wave B of (B) is unfolding which has either ended at 0.9407 or would extend one more fall but downside should be limited to 0.9200 and 0.9000 should hold.