Sample Category Title
Trade Idea: AUD/USD – Buy at 0.7890
AUD/USD – 0.8032
Recent wave: Wave 5 ended at 1.1081 and major correction has commenced for fall to 0.7000 and then towards 0.6500-10
Trend: Near term up
Original strategy :
Buy at 0.7800, Target: 0.7990, Stop: 0.7740
Position: -
Target: -
Stop: -
New strategy :
Buy at 0.7890, Target: 0.8090, Stop: 0.7830
Position: -
Target: -
Stop:-
As aussie has rallied after finding renewed buying interest at 0.7878 yesterday and broke above psychological resistance at 0.8000, adding credence to our bullish view that recent upmove is still in progress and upside bias remains for the medium term impulsive wave to extend headway to 0.8100, however, near term overbought condition should limit upside to 0.8140-50, bring retreat later. We are keeping our latest bullish count that recent impulsive waves is unfolding as (1 2, (i)(ii), i ii) and may extend headway to aforesaid upside targets.
In view of this, would not chase this rise here and we are looking to buy aussie on subsequent pullback as 0.7878 support should limit downside, bring another upmove later. Below support at 0.7875 would defer and risk correction to 0.7810-20, however, still reckon downside would be limited to 0.7786 and price should stay well above wave i top at 0.7712.
On the 4-hour chart, the move from 0.8066 is the wave 5 with i: 0.8860, ii: 0.8315, wave iii is an extended move ended at 1.0183, iv: 0.9706 and wave v has ended at 1.1081 (also the top of entire wave 5). The subsequent selloff is the major correction which is unfolding as ABC-X-ABC and 2nd A leg has ended at 0.8848, followed by a-b-c wave B which ended at 0.9758, hence, 2nd C wave is now in progress and indicated downside target at 0.7000 and 0.6950 had been met, so further fall to 0.6710-20 cannot be ruled out.

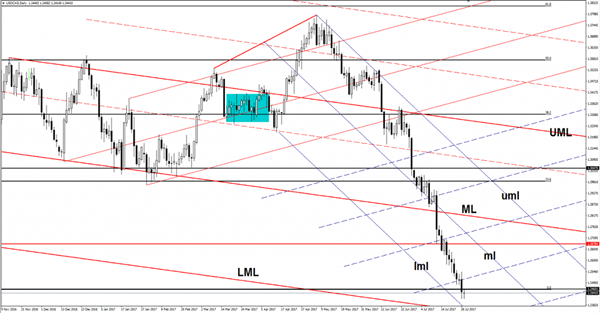
USD/CAD Breakdown Needs Confirmation
USD/CAD plunged below two important support levels in the yesterday’s session and now could try to stabilize under these broken obstacles.
Price is located below the 1.2460 log term support, a distribution below this level will confirm a further drop in the upcoming period, the next downside target will be at the lower median line (lml) of the descending pitchfork. Only a failure to reach the lower median line (lml) and a false breakdown below the 1.2460 will signal a reversal
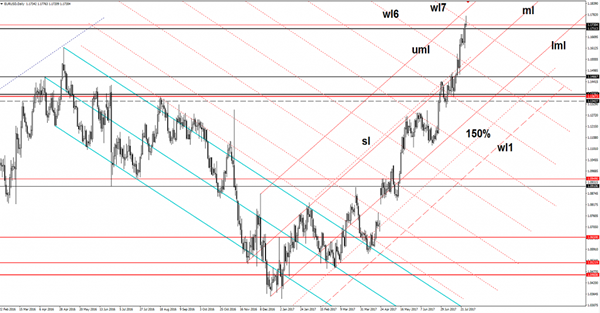
EUR/USD Hit Another Upside Target
Price rallied aggressively in the US session, after the FOMC Statement, has increased as much as 1.1776 level in the morning, where has found temporary resistance. As you already know, the USD has taken another punch from the Federal Reserve last night. The Federal Fends rate remains unchanged at 1.25% and could stay steady in the upcoming months if the United States data will come in mixed, only some impressive data will force the FED to take action again.
Price has decreased in the last few hours, but the retreat could be only temporary before will resume the upside movement. Could come to test and retest the 1.1712 long term broken resistance.
The European currency could receive support from the Spanish Unemployment Rate, which could decrease from 18.8% to 17.8% in the first quarter, the German Gfk German Consumer Climate climbed from 10.6 to 10.8 points, beating the 10.7 estimate.
EUR/USD closed much above the 1.1712 broken static resistance in the last session and has extended the latest gains, but the sellers have stepped in and have forced the rate to decrease below the seventh warning line (wl7) of the former descending pitchfork.
A consolidation above the 1.1712 level will confirm a breakout from the long term extended sideways movement. However, a failure to reach the upper median line (uml) of the minor ascending pitchfork will send the rate towards the median line (ml). We may have another buying opportunity if will move sideways till will reach and retest the median line (ml).
Has erased the morning gains as the USDX has squeezed after the earlier sell-off, the index maintains a bullish perspective and could approach and reach the 92.49 major static support.
US Inflation Concerns Pressure USD
The Federal Reserve ended its 2-day meeting on Wednesday with, as expected, no change in US interest rates. The Fed commented that US inflation had declined, notably removing the often said 'recently' which has been conceived as meaning the slowdown might not be temporary. The Fed also said it expected to start winding down its massive holdings of bonds 'relatively soon,' with many believing this will start in September. This would result in a tightening in financial conditions and is likely to lessen the need for actual hikes in rates.
Oil rose to the highest in almost 2 months after government data showed US crude and products stockpiles tumbled again last week to their lowest levels since the start of 2017. The US EIA report showed Crude inventories had a drawdown of 7.21 million barrels last week, its lowest level since January 6th. This has been a good week for Oil with the energy ministers' meeting in St. Petersburg seeing Saudi Arabia pledging to cut its crude oil exports to 6.6 million barrels daily starting in August and Nigeria stating it was willing to cap its output at 1.8 million bpd. However, the markets are wary as Ecuador recently stated it was quitting any output cut deal and Iraq stating that it is planning to raise production by the end of the year.
The UK Office for National Statistics released GDP that showed the UK economy grew by 0.3% in the second quarter. Whilst a modest improvement on the 0.2% growth of Q1 it lags 2016.
EURUSD saw little movement on Wednesday, trading in a less than 50 pip range, until the FOMC statement which saw a USD sell-off. EURUSD climbed to a high of 1.17761 overnight – a level not seen since January 2015. Currently, EURUSD is trading around 1.1740.
USDJPY gathered strength throughout Wednesday, reaching a high of 112.156 before succumbing to USD weakness to reach a low of 110.777 overnight. However, USD pressure is likely to be limited as the markets expect the Bank of Japan to keep its ultra-easy policies in place longer than other central banks. Currently, USDJPY is trading around 111.05.
GBPUSD recovered from early lows of 1.2999, rebounding on the 'better than expected – but not great' Q2 GDP release that showed a rise in growth, albeit small. GBPUSD has traded as high as 1.31565 overnight and is currently trading around 1.3140.
Risk-on sentiment saw Gold climb to as high as $1,264.69. Currently, Gold is trading close to these highs around $1,264.
Following the latest US inventories drawdown data, WTI gained 0.8% on day to trade as high as $48.86. Currently, WTI is trading around $48.75.
At 13:30 BST US Initial Jobless Claims (Jul 21) will be released with the consensus looking for 241K, slightly higher than the previous release of 233K. The US Labour market has shown great strength recently and, whilst the forecast is expected higher, it should not be overly negative for USD – unless it is significantly higher, which will see result in USD pressure.
At the same time, US Durable Goods Orders (Jun) will be released, with a healthy 3.0% consensus predicted – a significant improvement on the previous reading of -0.8%
EUR/GBP Candlesticks and Ichimoku Analysis
Weekly
• Last Candlesticks pattern: N/A
• ime of formation: N/A
• Trend bias: Near term up
Daily
• Last Candlesticks pattern: Hammer
• Time of formation: 3 Feb 2016
• Trend bias: Up
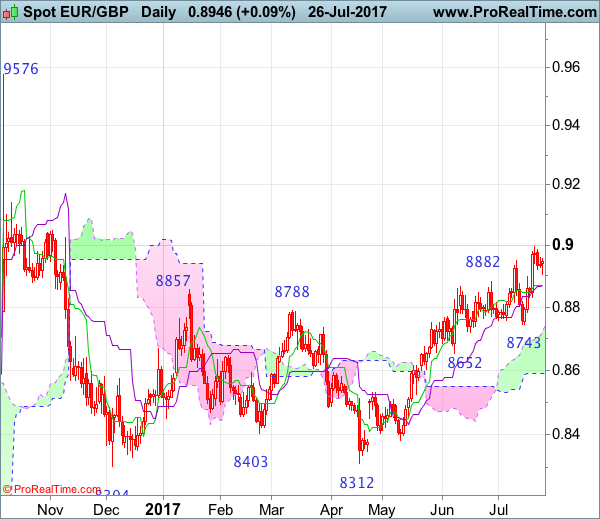
EURGBP – 0.8776
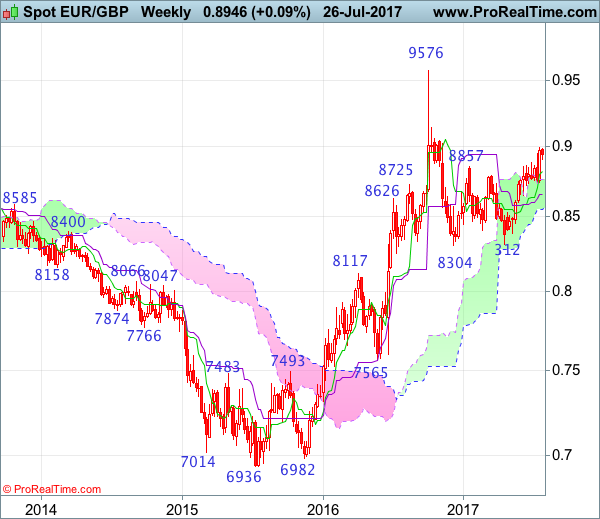
The single currency only retreated to 0.8743 earlier this month before finding renewed buying interest and euro has surged again from there, adding credence to our bullish view for recent upmove to extend further gain (indicated upside targets at 0.8900 and 0.8940-50 - 50% Fibonacci retracement of 0.9576-0.8304 had been met), upside bias remains for further gain to psychological resistance at 0.9000, break there would extend headway to 0.9090 (61.8% Fibonacci retracement), however, loss of momentum should prevent sharp move beyond 0.9150-60, bring retreat later.
On the downside, whilst initial pullback to the Tenkan-Sen (now at 0.8869), then 0.8800 is likely, reckon support at 0.8743 would remain intact, bring another upmove later. A drop below this support would abort and suggest a temporary top is possibly formed instead, bring retracement of recent upmove to 0.8695-00, however, still reckon downside would be limited to previous support at 0.8652 and price should stay above the lower Kumo (now at 0.8589) and bring rebound later.
Recommendation: Buy again at 0.8795 for 0.8995 with stop below 0.8695.
On the weekly chart, last week’s rally together with the breach of previous resistance at 0.8950 adds credence to our bullish view that the rise from 0.8304 is still in progress and upside bias remains for this move to extend gain to 0.9000, then towards 0.9090 (61.8% Fibonacci retracement of 0.9576-0.8304) would be seen, however, a weekly close above resistance at 0.9142 is needed to retain bullishness and signal the entire correction from 0.9576 top has ended at 0.8304 and encourage for further subsequent gain to 0.9200-10.
On the downside, although pullback to the Tenkan-Sen (now at 0.8824) cannot be ruled out, reckon downside would be limited to 0.8795-00 and bring another rise later. Below support at 0.8743 support would defer and risk correction to 0.8700 but reckon downside would be limited to the Kijun-Sen (now at 0.8654) and the lower Kumo (now at 0.8551) should remain intact, bring another rally later.
EUR/CHF Candlesticks and Ichimoku Analysis
Weekly
• Last Candlesticks pattern: Doji
• Time of formation: 20 Feb 2017
• Trend bias: Up
Daily
• Last Candlesticks pattern: Doji
• Time of formation: 1 Sep 2016
• Trend bias: Near term down
EUR/CHF – 1.1151
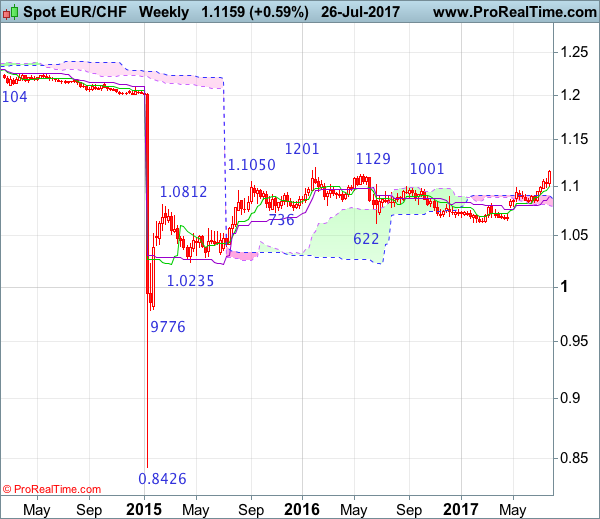
The single currency has finally resumed medium term upmove from 1.0622 (2016 low), adding credence to our bullish view and our long position entered at 1.0865 met indicated upside target at 1.1065 (with 200 points profit), hence upside bias remains for test of previous resistance at 1.1201, above there would encourage for headway to 1.1300 but loss of upward momentum should prevent sharp move beyond 1.1400-10 and price should falter well below 1.1500, bring correction later next month.
On the downside, whilst initial pullback to the Tenkan-Sen (now at 1.1081) cannot be ruled out, reckon downside would be limited to 1.0995-00 and support at 1.0984 would hold, bring another rally later. A daily close below this support would defer and suggest a temporary top is possibly formed, bring correction to 1.0940-50, then towards 1.0890-00 and price should stay well above previous support at 1.0833, bring another rally later.
Recommendation: Long entered at 1.0865 met target at 1.1065 with 200 points profit and would buy again at 1.1020 for 1.1220 with stop below 1.0920.

On the weekly chart, euro’s upmove has accelerated after breaking above indicated previous resistance at 1.0988 (now support), adding credence to our bullish view that recent rise from 1.0622 is still in progress and upside bias remains for another test of recent high at 1.1201, break there would encourage for headway to 1.1290-00, then towards 1.1390-00 but near term overbought condition should prevent sharp move beyond 1.1500, risk from there has increased for a retreat to take place next month or in late Q3.
On the downside, although pullback to 1.1080-90, then 1.1020-30 cannot be ruled out, reckon the Tenkan-Sen (now at 1.1004) would limit downside and bring another rise later. Below previous resistance at 1.0988 (now support) would defer and risk correction towards the Kijun-Sen (now at 1.0903) but only a weekly close below there would signal a temporary top is formed instead, bring further fall to 1.0850-60, then test of previous support at 1.0833 which is likely to hold from here, bring rebound later.
Trade Idea : USD/CHF – Hold short entered at 0.9570
USD/CHF - 0.9519
Most recent candlesticks pattern : N/A
Trend : Near term down
Tenkan-Sen level : 0.9507
Kijun-Sen level : 0.9543
Ichimoku cloud top : 0.9511
Ichimoku cloud bottom : 0.9490
Original strategy :
Sold at 0.9570, target: 0.9470, Stop: 0.9605
Position : - Short at 0.9570
Target : - 0.9470
Stop : - 0.9605
New strategy :
Hold short entered at 0.9570, target: 0.9470, Stop: 0.9570
Position : - Short at 0.9570
Target : - 0.9470
Stop : - 0.9570
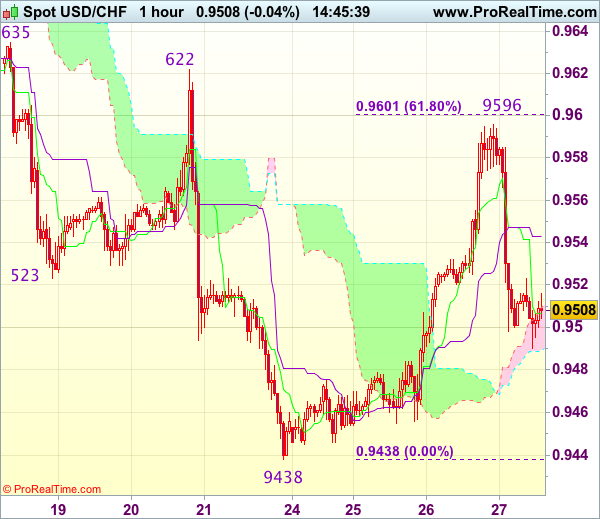
Although the greenback rose to as high as 0.9596, the subsequent selloff on dollar’s broad-based weakness signals top is formed there, retaining our bearishness and consolidation with downside bias remains for weakness to 0.9470, however, break of 0.9450-55 is needed to signal the rebound from 0.9438 has ended there, bring retest of this level first.
In view of this, we are holding on to our short position entered at 0.9570. Above 0.9560-70 would risk test of 0.9596-01 (said resistance and 61.8% Fibonacci retracement of 0.9701-0.9438), break there would suggest a temporary low has been formed at 0.9438 instead, bring a stronger rebound towards resistance area at 0.9622-35.
Forex Technical Analysis: EUR/USD, USD/JPY, GBP/USD
EUR/USD
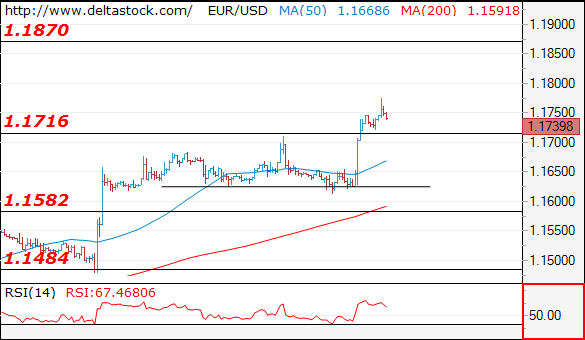
Current level - 1.1739
The corrective pattern below 1.1716 was a shallow one and the general uptrend has been renewed, heading towards 1.1870 hurdle. Initial intraday support lies at 1.1716 and crucial on the downside is the recent low at 1.1611.
| Resistance | Support | ||
| intraday | intraweek | intraday | intraweek |
| 1.1780 | 1.1870 | 1.1716 | 1.1580 |
| 1.1870 | 1.2000 | 1.1611 | 1.1480 |
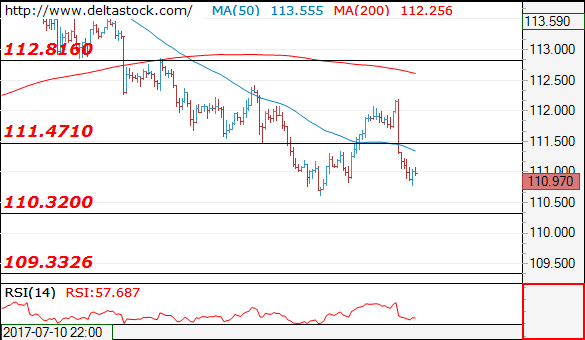
USD/JPY
Current level - 110.97
The corrective rebound above 111.60 is over with yesterday's peak at 112.20 and the outlook is bearish, for a slide towards 109.30. Minor intraday resistance lies at 111.47.
| Resistance | Support | ||
| intraday | intraweek | intraday | intraweek |
| 111.47 | 114.50 | 110.30 | 110.30 |
| 112.80 | 115.50 | 109.30 | 108.10 |
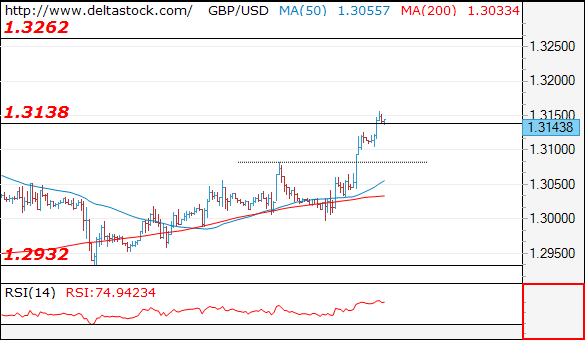
GBP/USD
Current level - 1.3148
The test at 1.3000 has failed and the uptrend has been renewed, currently heading towards 1.3260 area. Key intraday support is projected at 1.3080.
| Resistance | Support | ||
| intraday | intraweek | intraday | intraweek |
| 1.3160 | 1.3260 | 1.3080 | 1.2930 |
| 1.3260 | 1.3500 | 1.2930 | 1.2810 |
Trade Idea : GBP/USD – Buy at 1.3085
GBP/USD - 1.3135
Most recent candlesticks pattern : N/A
Trend : Near term up
Tenkan-Sen level : 1.3132
Kijun-Sen level : 1.3079
Ichimoku cloud top : 1.3037
Ichimoku cloud bottom : 1.3036
Original strategy :
Sold at 1.3100, stopped at 1.3135
Position : - Short at 1.3100
Target : -
Stop : - 1.3135
New strategy :
Buy at 1.3085, Target: 1.3185, Stop: 1.3050
Position : -
Target : -
Stop : -
Cable found decent demand just below 1.3000 level and has rallied on back of dollar’s broad-based selloff, signal recent upmove is still in progress and upside bias is seen for further gain to 1.3160, then 1.3185-90, however, near term overbought condition should prevent sharp move beyond 1.3210-20 and price should falter below 1.3240-50, risk from there is seen for a retreat later.
In view of this, would not chase this rise here and we are looking to buy sterling on subsequent pullback as previous resistance at 1.3084 should turn into support and contain cable’s downside, bring another rise. Below 1.3050 would risk weakness to 1.3030-35 but break of latter level is needed to signal top is formed, then correction to 1.2999 support would follow.
Daily Technical Analysis: US Dollar Continues Downtrend After Fed Leaves Rates Unchanged
Currency pair EUR/USD
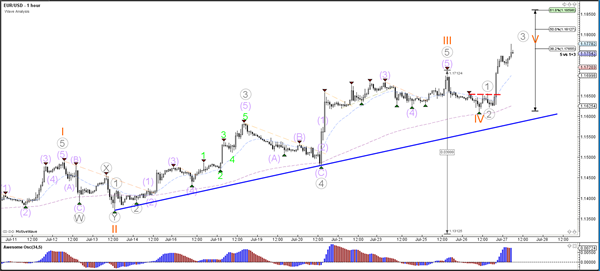
As expected the Federal Reserve (Fed) left the interest rates unchanged for the US, which caused the US Dollar to weaken against multiple currencies, including the Euro. Prior to the FOMC statement in the US, the EUR/USD retraced back to the 23.6% Fibonacci level of wave 4 vs 3 but price bounced strongly soon after. The EUR/USD has now reached the 1.1750 resistance level and a break above it could see price challenge the Fibonacci targets of wave 5 vs 1+3.
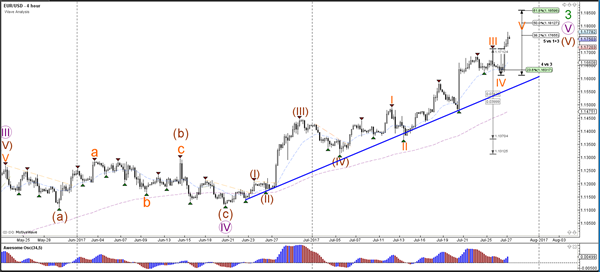
The EUR/USD completed a wave 4 (orange) retracement and is now building strong bullish momentum. This is probably part of a wave 3 (grey) within wave 5 (orange). Once the wave 3 is completed, it is likely to see a wave 4 and 5 (grey) continuation.
Currency pair USD/JPY
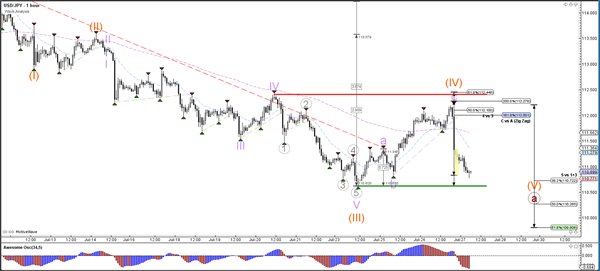
The USD/JPY respected and bounced at the Fibonacci levels of wave 4 (orange) and the resistance from the previous top (red). The bearish turn is most likely part of the wave 5 (orange).
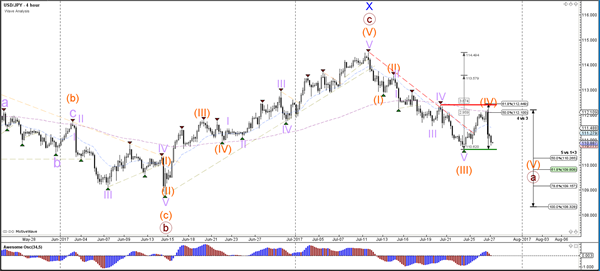
The USD/JPY could move towards the round level of 110 once price breaks below the bottom (green).
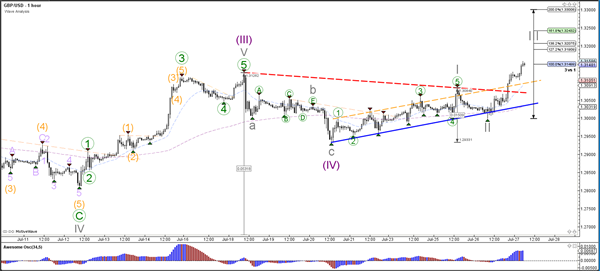
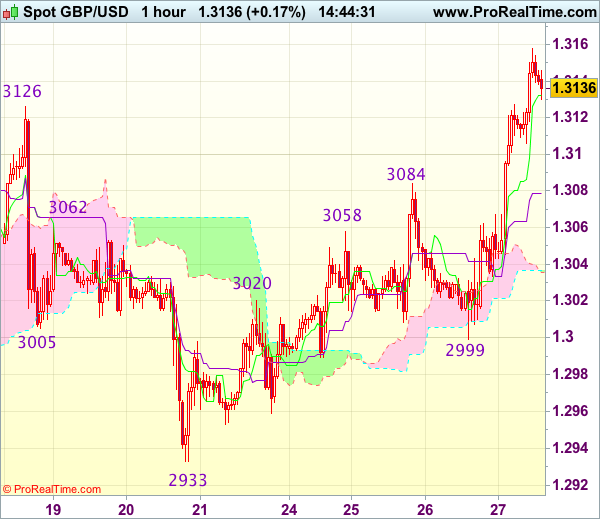
Currency pair GBP/USD
The GBP/USD broke above the resistance trend lines (dotted orange/red) with strong bullish momentum. This makes a bullish wave structure more likely and price could be heading towards the Fibonacci targets of wave 5 vs 1+3.
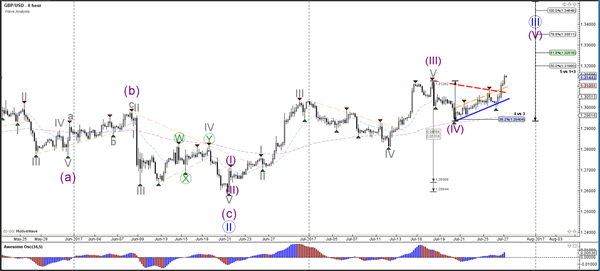
The GBP/USD seems to be in a wave 3 (grey) breakout. Price needs to reach the 161.8% Fibonacci target before confirming the development of a wave 3.