
Sample Category Title
Currencies: USD Rebound Slows Ahead Of Key US Data
Sunrise Market Commentary
- Rates: Core bonds still in wait-and-see modus
Well-filled calendar with US eco data, EMU countries' auctions and some central bank talks. We expect the important US eco-data to be mixed, which might keep the deadlock in core bonds intact ahead of the US payrolls. Key Bund support looms dangerously and the Bund look heavy, unable to take distance from it in past days. - Currencies: USD rebound slows ahead of key US data
Yesterday, the USD rebound slowed. Today, the focus is on the ADP report and on the US non-manufacturing ISM. We doubt that today's data will give a strong enough signal to support further USD gains. A strong payrolls report is probably needed to push EUR/USD below the 1.13 support
The Sunrise Headlines
- WS struggled to establish a clear direction as a tech rebound was offset by weakness in the energy sector. The market reaction to the Fed minutes was limited. Asian markets are trading mixed to slightly lower.
- The minutes of the June rate-setting meeting showed the US Fed divided over the exact timing of the balance-sheet wind down, September or December, but the general tone was hawkish despite a spate of weak inflation readings.
- Brent oil has stabilised around 48.20$/barrel after a significant drop yesterday that ended the longest winning streak this year.
- In the UN Security Council, the US cautioned it was ready to use force if needed to stop North Korea's nuclear missile program but said it preferred global diplomatic action. With or without Russia and China.
- Headline total US factory orders fell 0.8% in May (consensus -0.5% and -0.3% in April), but core orders and shipment activity gained modestly. The durable goods orders were bang on consensus at -0.8% (after -1.1% in April)
- German factory orders in May (1.0% M/M, and 3.7% Y/Y) were lower than consensus (1.9% M/M and 4.5% Y/Y) but higher than in April (-2.2% M/M and 3.3% Y/Y). Orders were driven by export demand for investment goods while orders for basic and consumer goods declined.
- The meeting of four Arab states to discuss the negative Qatari response to their demand list ended without further sanctions. The current boycott, that started after Qatar was accused of terrorism and allying with Iran, continues.
- The eco-calendar contains mostly US data with the ADP employment change, initial jobless claims and the ISM non-manufacturing. Also, ECB's Praet will speak in Paris and the ECB policy meeting details will be released.
Currencies: USD Rebound Slows Ahead Of Key US Data
US rebound slows ahead of key US data
Yesterday, the dollar initially extended the gradual rebound of the previous days, but the move did run into resistance later in the session. Strong EMU PMI's failed to support the euro. The Fed Minutes showed different views on the nature of the recent slowdown in inflation and on the timing to start the reduction of the balance sheet. There was some volatility in US bonds and in the dollar after the release of the report, but the broader picture didn't change. EUR/USD closed the session at 1.1352. USD/JPY finished the day at 113.26.
This morning, most Asian equity indices are trading with modest losses (on average about 0.5%). Signs of division within the Fed, yesterday's setback of the oil prices and ongoing geopolitical uncertainty on North-Korea is causing some investors caution. USD/JPY drifted back to the 113 area. EUR/USD is also ceding a few ticks and trades at around 1.1340. The trade-weighted dollar is slightly off yesterday's intraday correction top (96.25 from 96.51).
Today, the market focus will again be on the US data. The June ADP employment report & Challenger lay-offs and the weekly jobless claims precede tomorrow's key US payrolls. There is no one-on-one link between these data and the payrolls, but they could affect the markets' prepositioning. ADP private job growth is expected at 185,000. The last three months net payrolls gains amounted to 50K, 174K and 138K, well below the 255K, 173K and 253K of the ADP. We suspect that the payrolls underestimated the trend while ADP exaggerated job growth. Therefore, we see downside risks to the ADP report (190K expected), but upside risks to the payrolls (177K expected). Markets will probably handle a downward surprise in the ADP with caution. The June non-manufacturing ISM is expected to have eased slightly from 56.9 in May to a decent 56.5. Following an upward surprise in the manufacturing ISM, we put risks for the non-manufacturing one also on the upside.
Earlier this week, the dollar rebounded as investors anticipated good US data this week, but the rebound did run into resistance yesterday. The ‘division' that was apparent in yesterday's Fed minutes might cause some further investor caution on the dollar. The US currency probably needs really convincing data. We expect today's US data to be good, but markets/the dollar probably need confirmation from a strong payrolls report to extend any meaningful comeback So, some consolidation on the recent USD rebound might be in the cards today. Geopolitical tensions in Asia remain a wildcard for USD trading going into tomorrow's G20. This morning's equity performance in Asia also doesn't give a clear guidance for USD trading
Technical picture: USD looking for a bottom
A combination of hawkish ECB comments and weaker US eco data pushed EUR/USD last week above the 1.1300/66 resistance area with a new high at 1.1448. The next resistance is now the 1.15 area. Further out LT-correction tops are coming in at 1.1616/1.1714. A break would end the long consolidation period that followed the sharp decline of EUR/USD in 2014/early 2015. Such a key area will be difficult to break for now. A return below the 1.13 area would be first indication of a loss of upside momentum. 1.1119 is the next important support.
The USD/JPY rally ran into resistance in early May and the pair returned lower in the 108.13/114.37 range. The post-Fed USD rebound pushed the pair the 112.13 correction top last week, but follow-through gains remain modest. So, the jury is still out. A sustained break would improve the ST-picture. We remain cautious on further USD/JPY gains LT.
EUR/USD correcting off last week's top, but no clear technical signal yet. 1.13 support holds, for now
EUR/GBP
Sterling trading still waiting for a new driver
Yesterday, the UK services PMI eased slightly more than expected from 53.8 to 53.4 (53.5), but the deviation from consensus was too small to really affect sterling trading. EUR/GBP and cable trading was technical in nature or driven by the broader trends in the euro and the dollar. The gradual USD rebound pushed cable to the low 1.29 area, but the pair regained ground slightly as the dollar rally eased later on. Cable closed the session at 1.2934. BoE Saunders warned households should prepare for interest rates to go higher. However, his assessment brought little news for markets as he already voted for a rate hike last month. EUR/GBP finished the day at 0.8777.
Today, there are no important eco data in the UK and we are also not aware of any BoE speeches. The Brexit negotiations also moved a bit to the background as a driver for sterling trading. So, technical trading might prevail. Over the previous days, sentiment on sterling wasn't too bad. Short-term, we see EUR/GBP staying below the resistance of 0.8866/80 as markets are still digesting the recent decline of sterling (rise of EUR/GBP). The recent technical decline of EUR/GBP might still go a bit further.
From a technical point of view, EUR/GBP set a minor top north of the 0.8854/66 resistance (2017 top). A sustained break didn't occur, causing a correction on the recent EUR/GBP rebound. A return below the 0.8655 correction low would indicate easing pressure on sterling but such a break lower will be difficult. A EUR/GBP buy-on-dips approach remains favoured
EUR/GBP topside test rejected. A modest/temporary sterling comeback might continue
Trade Idea : EUR/USD – Buy at 1.1290
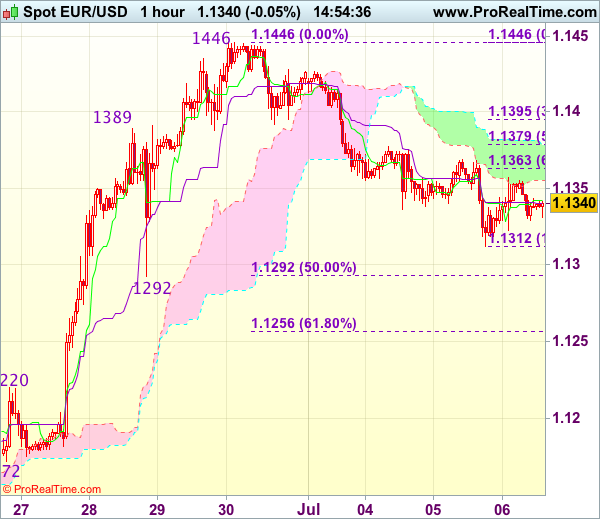
EUR/USD - 1.1351
Most recent candlesticks pattern : N/A
Trend : Near term up
Tenkan-Sen level : 1.1343
Kijun-Sen level : 1.1340
Ichimoku cloud top : 1.1378
Ichimoku cloud bottom : 1.1355
Original strategy :
Buy at 1.1290, Target: 1.1390, Stop: 1.1255
Position : -
Target : -
Stop : -
New strategy :
Buy at 1.1290, Target: 1.1390, Stop: 1.1255
Position : -
Target : -
Stop : -
Although the single currency recovered after finding support at 1.1312, reckon upside would be limited to 1.1375-80 and near term downside risk remains for the fall from 1.1446 top to bring retracement of recent rise to 1.1292 (previous support as well as 50% Fibonacci retracement of 1.1139-1.1446), however, reckon sharp fall below there should not be repeated and bring rebound later, above 1.1375-80 would signal low is formed, bring test of 1.1400-10, break there would suggest the pullback from 1.1446 has ended, then retest of this resistance would follow.
In view of this, we are inclined to buy euro on further corrective fall as 1.1292 (previous support as well as 50% Fibonacci retracement of 1.1139-1.1446) should limit downside, bring rebound. Below 1.1270 would abort and signal a temporary top is formed, bring correction to 1.1250-55 (61.8% Fibonacci retracement) first.
Trade Idea : USD/JPY – Stand aside
USD/JPY - 113.21
Most recent candlesticks pattern : N/A
Trend : Near term up
Tenkan-Sen level : 113.10
Kijun-Sen level : 113.29
Ichimoku cloud top : 113.07
Ichimoku cloud bottom : 112.86
New strategy :
Stand aside
Position : -
Target : -
Stop : -
Although the greenback resumed recent rise and rose to as high as 113.69 yesterday, lack of follow through buying and the subsequent retreat suggest consolidation below this level would be seen and weakness to 112.80-85 (38.2% Fibonacci retracement of 111.46-113.69) is likely, however, break of support at 112.74 is needed to signal top has been formed there, bring retracement of recent rise to 112.40-45, then 112.20 but reckon 111.95-00 would hold from here.
In view of this, would not chase this rise here and would be prudent to stand aside for now. Above said resistance at 113.69 would signal recent upmove is still in progress and may extend further gain to 114.00 but loss of momentum should prevent sharp move beyond 114.25-30.

ECB Changed Its Forward Guidance On Policy Rates
ECB Changed Its Forward Guidance On Policy Rates
Market movers today
Today at 13:30 CET in the euro area, the ECB minutes from the June meeting are due out, when the ECB changed its forward guidance on policy rates. These accounts have sometimes contained some interesting information but this time it is likely to be a bit outdated due to Mario Draghi's recent speeches. Jens Weidmann and Ewald Nowotny are due to discuss the future of the euro later in the afternoon.
In Germany, we estimate that factory orders rose 1.7% in May, slightly below consensus of 1.9%.
Ahead of the US jobs report for June tomorrow, the corresponding ADP report is due out at 14:15 CET, which, however, has overestmated actual employment growth in recent months. We estimate non-farm payrolls rose 180,000 in June. See our US Labour Market Monitor. June report likely to be stronger than in recent months, 5 July 2017.
US ISM non-manufacturing index is due out today at 16:00 and will shed light on growth in the service sector. ISM non-manufacturing is relatively high at the moment , suggesting the service sector is continuing to grow.
In Sweden, house prices for June are due out .
Selected market news
As expected, there was not much new in the FOMC minutes from the June meeting. The most interesting part of the minutes was the timing of the balance sheet run-off, as 'several preferred to announce a start to the process within a couple of months' while 'some' want to wait until later in the year. Overall, it supports our view that the Fed could make an announcement in September and start the actual run-off in Q4. See FOMC minutes: Fed likely to announce start of QT in September, 5 July 2017. With respect to inflation, the minutes say low inflation is likely to be 'transitory'. The Fed st ill has faith in the Phillips curve, which says that the tighter labour market should push up wage growth eventually. The problem is that tightness of the labour market is not the only factor determining wage growth, as second-round effects of the many years with inflation below 2% have hit wage growth. When employees expect this to remain low, they can live with low wage growth, as real wage growth may st ill be solid. See Strategy: Central banks consider leaving the party, 30 June 2017.
At last night 's meeting on North Korea in the US Security Council, the US ambassador Nikki Haley said that China plays a key role in 'preventing a catastrophe'. She argues that North Korea has escalated the conflict with its missile launch and that the US is prepared to use its 'considerable military forces' if necessary, although the US wants to start with trade sanctions initially. She threatened China implicitly, as she said the US will change its attitude on trade with countries trading with North Korea.
The G20 meeting starts tomorrow and there are many things to talk about : North Korea, Paris climate change deal, trade/protectionism, Ukraine and so on. CNN has a long list of T rump's disagreement with G20 counterparts and EU-Japan is expected to present its free trade deal (removing 99% of tariffs on traded goods) today.
Daily Technical Analysis: EUR/USD Bounces At 50% Fib But Needs Break To Confirm Wave 4-5
Currency pair EUR/USD
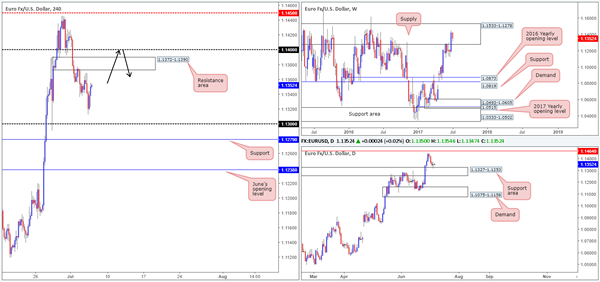
The EUR/USD break above resistance (red) could see price approach the Fibonacci targets of wave 5 (purple) which could complete wave 3 (green). Price is now close to broken resistance levels, which is indicated by the support zone (blue box).

The EUR/USD bounced at the 50% Fibonacci level of wave 4 (brown) but still needs to break above the resistance trend line (red) before an uptrend continuation is likely.

Currency pair USD/JPY
The USD/JPY uptrend seems to have completed 5 waves (orange) within wave C (brown) but an extension of the trend is always possible as long as price stays above the support trend line (blue). A bullish break above 114 could see price test 115 and perhaps 116.

The USD/JPY is trying to break a local support trend line (dotted blue) but price has a key psychological support level of 112.50 nearby which is a key break or bounce zone.

Currency pair GBP/USD
The GBP/USD bearish price action is starting to move correctively and a break above the resistance trend line (orange) could start an uptrend continuation towards the 423.6% Fibonacci target.

The GBP/USD failed to break below the 61.8% Fibonacci of wave 4 vs 3 and invalidate the wave 4 (purple). A break above resistance (orange/red) would indicate the potential for price to continue towards the Fibonacci targets.

Daily Technical Outlook And Review: EUR/USD, GBP/USD, AUD/USD, USD/JPY, USD/CAD, USD/CHF, DOW 30, GOLD
A note on lower timeframe confirming price action...
Waiting for lower timeframe confirmation is our main tool to confirm strength within higher timeframe zones, and has really been the key to our trading success. It takes a little time to understand the subtle nuances, however, as each trade is never the same, but once you master the rhythm so to speak, you will be saved from countless unnecessary losing trades. The following is a list of what we look for:
- A break/retest of supply or demand dependent on which way you're trading.
- A trendline break/retest.
- Buying/selling tails ... essentially we look for a cluster of very obvious spikes off of lower timeframe support and resistance levels within the higher timeframe zone.
- Candlestick patterns. We tend to only stick with pin bars and engulfing bars as these have proven to be the most effective.
We typically search for lower-timeframe confirmation between the M15 and H1 timeframes, since most of our higher-timeframe areas begin with the H4. Stops are usually placed 1-3 pips beyond confirming structures.
EUR/USD
EUR/USD prices are little changed this morning. As such, weekly flow remains loitering within the walls of a major supply zone drawn from 1.1533-1.1278 that has capped upside since May 2015. Daily action on the other hand, shows that the major connected with the top edge of a support area drawn from 1.1327-1.1253 during yesterday's trading, and chalked up a clear-cut indecision candle.
Having seen the daily candles recently challenge a support area, the likelihood of H4 price retesting the resistance area at 1.1372-1.1390 today is high. In addition to this, with the weekly chart suggesting that this market may continue to push lower, a trade from this H4 area may still be worthy of attention, even though we're bouncing off a daily zone.
Our suggestions: Given daily bulls may come into the picture today; this could force H4 flow to fake above the resistance area and tag in offers positioned around the 1.14 handle lurking above. Therefore, we would not recommend placing limit orders around the zone.
In light of the circumstances, we would only trade this market short if H4 price whipsawed above 1.1372-1.1390, tapped 1.14, and then closed back within the said area (a pin-bar formation). This move would trigger stops/breakout buyers' orders lurking above 1.1372-1.1390 and likely provide the big boys enough liquidity to short from 1.14, which is what we want to be a part of!
Data points to consider: US ADP non-farm employment change at 1.15pm, US Weekly unemployment claims and US trade balance figures at 1.30pm, US ISM non-manufacturing PMI and FOMC member Powell speaks at 3pm GMT+1.
Levels to watch/live orders:
- Buys: Flat (stop loss: N/A).
- Sells: 1.1372-1.1390 – Ideally looking for price to fake this area and connect with 1.14 before a sell is permitted (stop loss: beyond the fakeout candle's wick).
GBP/USD
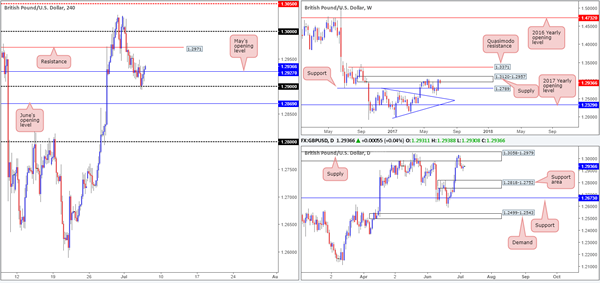
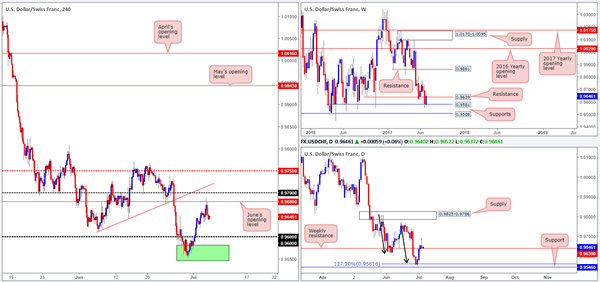
Despite yesterday's bounce off the 1.29 handle, as well as a recent close back above May's opening level at 1.2927, our team's bias remains firmly tilted to the downside. Our reasoning largely comes from the higher-timeframe picture. The weekly timeframe reveals that price is seen trading from supply pegged at 1.3120-1.2957. In addition to this, the pair is also seen interacting with a daily supply zone at 1.3058-1.2979, which is essentially a partner supply to the aforementioned weekly area.
In spite of the bigger picture indicating that further selling may be at hand, selling this market at the moment would involve shorting into H4 supports at 1.2927/1.29/1.2869.Technically speaking, the path south would only be clear for selling once June's opening level at 1.2869 is cleared. According to H4 structure, the 1.28 handle would then likely be the next hurdle on the hit list. Nevertheless, traders will need to be prepared for price to stall/reverse ahead of this number since let's remember that the top edge of a daily support area is located at 1.2818.
Our suggestions: A H4 close beyond 1.2869, followed up with a retest as resistance and a lower-timeframe confirming sell signal (see the top of this report) would, in our opinion, be enough to justify a sell in this market, targeting 1.2818, followed closely by the 1.28 handle.
Data points to consider: US ADP non-farm employment change at 1.15pm, US Weekly unemployment claims and US trade balance figures at 1.30pm, US ISM non-manufacturing PMI and FOMC member Powell speaks at 3pm GMT+1.
Levels to watch/live orders:
- Buys: Flat (stop loss: N/A).
- Sells: Watch for H4 price to engulf 1.2869 and then look to trade any retest seen thereafter ([waiting for a lower-timeframe confirming sell signal to form following the retest is advised] stop loss: dependent on where one confirms the level).
AUD/USD
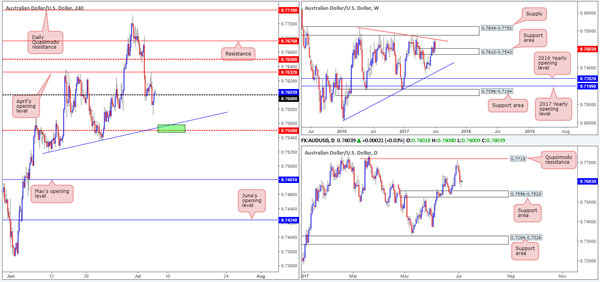
H4 bulls, as you can see, struggled to maintain a bullish presence above the 0.76 handle during the early hours of Wednesday's trade. This was, technically speaking, largely thanks to April's opening level at 0.7632, which sent the commodity currency aggressively lower going into the London segment, eventually taking out 0.76 and clocking a low of 0.7571.
Looking over to the bigger picture, however, it's clear to see that weekly price is currently interacting with a support area at 0.7610-0.7543. Daily action on the other hand shows space for price to continue pushing lower until we reach the support area formed at 0.7556-0.7523, which happens to be glued around the lower edge of the current weekly support area.
Our suggestions: In essence, we have the following picture:
H4 price now lurking back above 0.76. Can the bulls survive here?
Weekly flow shaking hands with a support area.
Daily movement showing room to push lower before support structure is in view.
Personally speaking, we'll hold fire for the time being and see if H4 price can touch gloves with the mid-level support at 0.7550, which converges nicely with a trendline support etched from the low 0.7519 (green area), before considering longs. This way, both the weekly and daily support areas will be in play!
Data points to consider: Australian Trade balance at 2.30am. US ADP non-farm employment change at 1.15pm, US Weekly unemployment claims and US trade balance figures at 1.30pm, US ISM non-manufacturing PMI and FOMC member Powell speaks at 3pm GMT+1.
Levels to watch/live orders:
- Buys: 0.7550 region ([waiting for a H4 bull candle – preferably a full, or near full-bodied candle –to form is advised] stop loss: ideally beyond the candle's tail).
- Sells: Flat (stop loss: N/A).
USD/JPY
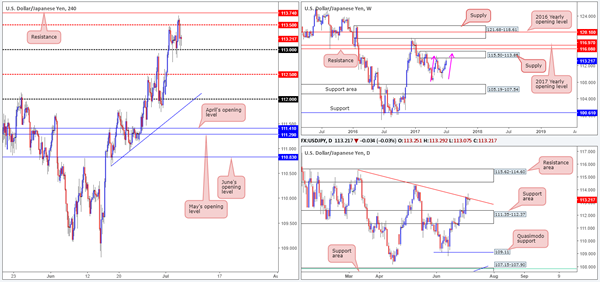
Recent developments on the USD/JPY show weekly price came within a cat's whisker of connecting with the underside of supply pegged at 115.50-113.85. Assuming that the unit connects with this area, it could also form a possible AB=CD correction completing around 115 (see pink arrows). Sliding down to the daily timeframe, nonetheless, we can see that the candles remain capped by the trendline resistance taken from the high 115.50. What's also notable from a technical perspective is yesterday's trading formed a clear-cut indecision candle here.
Bouncing over to the H4 timeframe, price is seen capped between the mid-level resistance at 113.50 and the 113 handle. Directly above this area sits a resistance level drawn from 113.74, and below 113, we do not see much in the way of support until the mid-level number 112.50.
Our suggestions: We do not want to risk trading short until we know that the market is located within the aforementioned weekly supply. What would be ideal here, however, is for the said weekly AB=CD formation to complete!
Data points to consider: US ADP non-farm employment change at 1.15pm, US Weekly unemployment claims and US trade balance figures at 1.30pm, US ISM non-manufacturing PMI and FOMC member Powell speaks at 3pm GMT+1.
Levels to watch/live orders:
- Buys: Flat (stop loss: N/A).
- Sells: Flat (stop loss: N/A).
USD/CAD
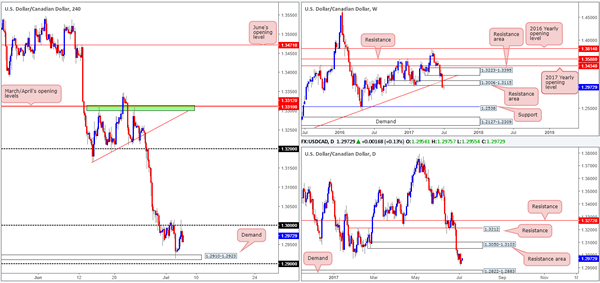
Trade update: remaining 30% of the short taken from 1.2989 was stopped out at breakeven.
Recent action shows that the USD/CAD pair extended its bounce from the H4 demand at 1.2910-1.2923 yesterday and ended the day challenging the large psychological number 1.30. Ultimately we do not expect the bulls to breach this level for a number of reasons. Firstly, this is a line watched by the majority of the market and seeing as it already held as resistance on Monday, we believe it is likely to continue holding firm. Secondly, 1.30 also denotes the underside of a recently broken weekly demand base at 1.3006 (now acting as a resistance area). In addition to this, the underlying trend is strongly pointing to the downside at the moment, and daily price shows space for the unit to continue lower until we reach demand pegged at 1.2822-1.2883.
Our suggestions: Put simply, our desk has come to a general consensus that 1.30 could, if retested for a third time today, be an area we may consider a sell from. To decide this, however, we would require a H4 bearish candle to form following the retest, preferably in the shape of a full, or near-full-bodied candle. The first take-profit target, assuming that a sell comes to fruition, would be the aforementioned H4 demand, followed closely by the 1.29 handle.
Data points to consider: US ADP non-farm employment change at 1.15pm, US Weekly unemployment claims and US trade balance figures at 1.30pm, US ISM non-manufacturing PMI and FOMC member Powell speaks at 3pm. Canadian Trade balance at 1.30pm GMT+1.
Levels to watch/live orders:
- Buys: Flat (Stop loss: N/A).
- Sells: 1.30 region ([waiting for a H4 bear candle – preferably a full, or near full-bodied candle –to form is advised] stop loss: ideally beyond the candle's wick).
USD/CHF
For those who have been following recent reports you may recall that our team was long from 0.9567. Our reasoning behind the position came down to the higher-timeframe picture. The green area shown on the H4 chart is comprised of a weekly support level at 0.9581 and a daily support level pegged at 0.9546. Initially, we had our stop beneath the green zone at 0.9544, but seeing as how the Swissy recently took off north, the stop was moved to breakeven. In addition to this, we also removed 70% of the position off the table once price struck weekly resistance at 0.9639.
The remaining 30% was held in the hope that H4 price would continue driving north and eventually shake hands with June's opening level at 0.9680. As you can see, this came to fruition during yesterday's sessions and we closed our position in full for a healthy profit. Well done to any of our readers who managed to stay on board with us here!
Our suggestions: With price now marginally trading above weekly resistance at 0.9639, along with daily price also printing a strong-looking selling wick yesterday, we are wary of trading this market at current price. Therefore, opting to stand on the sidelines may be the better path to take today.
Data points to consider: US ADP non-farm employment change at 1.15pm, US Weekly unemployment claims and US trade balance figures at 1.30pm, US ISM non-manufacturing PMI and FOMC member Powell speaks at 3pm GMT+1.
Levels to watch/live orders:
- Buys: Flat (stop loss: N/A).
- Sells: Flat (stop loss: N/A).
DOW 30
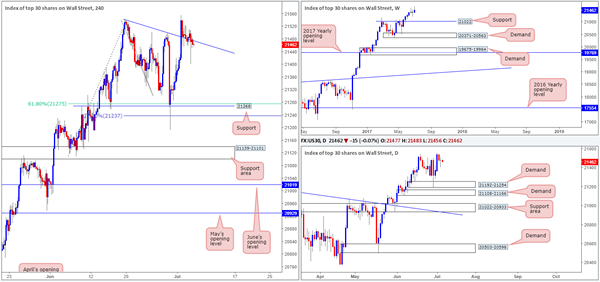
Once again, very little change was seen in the US equity market yesterday. The H4 candles continue to seesaw around the trendline support extended from the high 21541. So, with that in mind, much of the following analysis will be similar to Wednesday's report…
In Friday's report, we mentioned that our desk took a long trade at 21323, following the large H4 bull candle that formed off the H4 support level marked at 21268. What attracted us to this point was that the H4 level converged with a H4 61.8% Fib support level at 21275 taken from the low 21108 as well as a H4 127.2% Fib ext. point 21237 drawn from the high 21541 and also because of the daily demand at 21192-21254. Our stop-loss order has now been moved to breakeven and 50% of our position was taken off the table once price connected with the said H4 trendline. We have left the remaining 50% in the market to run as we believe that this index has the potential to punch much higher yet!
Our suggestions: Given our current long position, our desk is currently watching for the H4 trendline to show signs of strength. This could, given that the weekly, daily and H4 charts show absolutely no overhead resistance, also be a reasonable level to look for possible long opportunities.
Should price break into fresh highs today, however, we are going to move our stop-loss order up to the 21400 neighborhood.
Data points to consider: US ADP non-farm employment change at 1.15pm, US Weekly unemployment claims and US trade balance figures at 1.30pm, US ISM non-manufacturing PMI and FOMC member Powell speaks at 3pm GMT+1
Levels to watch/live orders:
- Buys: 21323 ([live] stop loss: breakeven).
- Sells: Flat (stop loss: N/A).
GOLD
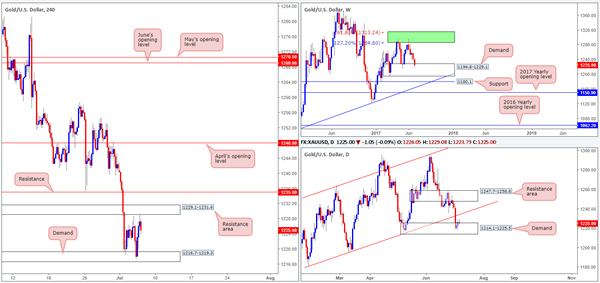
Over the last few sessions, we have seen H4 price put together a consolidation zone formed by a resistance area penciled in at 1229.1-1231.6 and a demand base coming in at 1216.7-1219.3. While traders who only focus on one timeframe may feel that this market is likely headed south due to the medium-term downtrend that we are currently in on the H4 timeframe, the higher-timeframe picture would suggest otherwise!
Scrolling over to the weekly timeframe, the buyers and sellers are seen battling for position around the top edge of a demand zone at 1194.8-1229.1. This demand has held price higher once already back in early May, so there's a solid chance that history may repeat itself here. In conjunction with the weekly timeframe, daily price also shows the yellow metal trading from a demand at 1214.1-1225.5, which happens to be positioned within the said weekly demand area.
While the H4 candles could remain bouncing from the H4 range extremes this week, we do not believe this consolidation will give way to the downside for reasons stated above.
As mentioned in yesterday's analysis, a level that has sparked some interest is the H4 resistance base penciled in at 1235.0, due to its connection with the daily trendline resistance seen extended from the low 1180.4. Still, shorting from this line would still entail one going against potential weekly buying power.
With that in mind, it would not be until a decisive H4 close above 1235.0 is seen, would our team consider buying as an option.
Our suggestions: Typically, we try to avoid trading against higher-timeframe flow. And selling 1235.0 would place us against potential weekly flow! Therefore, our desk is going to remain on the sidelines and wait and see if the H4 bulls can do us proud and close above 1235.0 for possible longs up to April's opening level at 1248.0.
Levels to watch/live orders:
- Buys: Watching for 1235.0 to be consumed on the H4 chart before buying becomes an option.
- Sells: Flat (stop loss: N/A).
European Open Briefing: Markets Had A Mixed Reaction To The FOMC Minutes
Global Markets:
- Asian stock markets: Nikkei down 0.60 %, Shanghai Composite lost 0.50 %, Hang Seng declined 0.30 %, ASX 200 fell 0.10 %
- Commodities: WTI Oil at $45.45 (+0.70 %), Brent Oil at $48.10 (+0.70 %), Gold at $1226 (+0.40 %), Silver at $16.05 (+0.90 %)
- Rates: US 10 year yield at 2.32, UK 10 year yield at 1.26, German 10 year yield at 0.47
News & Data:
- Australian Trade Balance (AUD) May: 2471M (exp 1000M; prev 555M)
- PBoC Fixes USDCNY Reference Rate At 6.7953 (prev fix 6.7922 prev close 6.8032)
Markets Update:
Markets had a mixed reaction to the FOMC minutes. The meeting minutes showed that the Fed members are increasingly split on the outlook for inflation. The US Dollar came slightly under pressure, and stocks declined as well. The focus is now on the US employment numbers on Friday. Weak numbers would put the Dollar under additional pressure.
Ahead of the NFP, further consolidation seems likely. In EURUSD, support at 1.1320 held and demand for the currency remains solid. A weak NFP print could easily send the EURUSD back above 1.14, and the next big resistance level above that lies at 1.16.
GBPUSD is stuck around 1.29. The upcoming Brexit negotiations continue to weigh on the Pound, and will prevent any larger rally. Resistance is noted ahead of 1.30 and then 1.3040/50.
The Australian Dollar didn't react too much to the AUS trade data which was released overnight. AUDUSD is consolidating around 0.76. The technical outlook is still mildly positive as long as it can keep above 0.75. A clear break below 0.75 would signal a correction to 0.72.
USDCAD is seeing a lot of volatility these days amid the swings in Oil prices. The pair recovered a bit overnight, as the decline in Oil put the CAD under pressure. The downtrend remains strong, and USDCAD is likely to run into strong selling interest ahead of 1.3050 and 1.31.
Upcoming Events:
- 08:15 BST – Swiss CPI
- 13:15 BST – US ADP Nonfarm Employment Change
- 13:30 BST – US Initial Jobless Claims
- 13:30 BST – Canadian Trade Balance
- 14:45 BST – US Services PMI
Crude Oil’s Recovery Could Get Ugly
Key Points:
- Global supply glut continues despite OPEC production deal.
- Technical analysis suggests further bearish pressure for crude oil prices.
- Watch for further price declines in the week ahead.
Crude oil has been the subject of endless speculation over the past month as the commodity has seemingly retreated in the face of a growing supply glut. Subsequently, many market commentators and pundits have provided forecasts in both directions for the embattled commodity. Therefore, let's take a look at the various arguments and consider what the most likely forward scenario for crude oil prices actually is.
The Fundamental View
If you talk to large institutional traders and research teams, most seem to see crude oil rallying back towards the $50.00 handle in the remainder of 2017. There is a definite view that the market is largely overestimating the impact of the current negative head winds and that the current round of pessimism must change over the medium term as the underlying fundamentals of demand continue to improve. In fact, demand might finally be starting to outstrip production if the latest IEA statistics are anything to go by. This is likely to be evidence that the OPEC production deal is starting to bite and could result in upward pressure on prices in the medium term.
However, there is scant evidence that OPEC is willing, able, and capable of doing what needs to be done to stabilise crude oil prices at a higher level. The fundamental view also largely discounts the fact that the rapid expansion of the U.S. Shale Oil Industry has irreparably changed the balance and global flow of oil. Subsequently, OPEC isn't the cartel of dominance that it once was and this is impacting their ability to control output at any level.
Additionally, the Baker Hughes U.S. Rig Count has continued to rise over the past few months despite crude oil prices having been heading in the other direction. This is ample evidence of the efficiencies that the shale oil operations have achieved in recent years and the fact that their marginal extraction costs have continued to drop. In fact, it was only this past week that saw an actual drop in the rig count was seen and it remains to be seen whether this will become a trend or is simply an anomaly.
The Technical View
From the technical perspective, crude oil has traded within a descending channel for the past few months and this doesn't appear to be changing any time soon. In fact, there has been ample evidence of numerous DMA “dead crosses” in the past month which have caught many retail traders by surprise and exposed. Subsequently, the best recover we have seen was the past few weeks where crude prices managed to climb by around $5.00/barrel before failing and recommencing a bearish leg. Subsequently, there seems to be little appetite by the wider market to support a robust bullish recovery. So it seems fairly unlikely that, as it presently stands, we will see a move back towards the $50.00 handle any time soon.
The Medium Term View
The advent of a wide range of Non-OPEC producers has fundamentally changed the fabric of the global oil market. The cartel is no longer the sole actor to consider in gauging production and output and this means that their production deals no longer have the same impact of years past. In addition, the rise of the U.S. Shale sector and their inexorable drive towards lower extraction costs and higher efficiencies now means that what was once “expensive” oil is now readily producible around current market prices.
The fact that we still have a significant oversupply of crude oil on the world markets is proof positive that the rebalancing process for the oil industry is not yet complete. In fact, there are some arguments to suggest that the OPEC production deal might have actually lengthened the process, and the pain, rather than allowing rapid rebalancing to occur.
Subsequently, the big take away is that shale oil is here to stay and likely to be a force to be reckoned with. Consequently, crude oil prices are unlikely to continue rising in the near term lest any such rise become self-defeating as additional U.S. rigs are returned to production. In fact, our near term modelling suggests that, instead of a challenge of the $50.00 handle, we might actually see a challenge to the key $40.00 level. Regardless, crude prices are stuck in a rut presently and this is unlikely to change over the medium term unless some rapid supply rebalancing occurs.
Australia’s Trade Surplus Sharply Widened In May
For the 24 hours to 23:00 GMT, the AUD slightly declined against the USD and closed at 0.7607.
LME Copper prices declined 0.5% or $29.0/MT to $5818.0/MT. Aluminium prices rose 0.5% or $9.5/MT to $1913.0/MT.
In the Asian session, at GMT0300, the pair is trading at 0.7600, with the AUD trading 0.09% lower against the USD from yesterday's close.
Earlier in the session, data revealed that Australia's seasonally adjusted trade surplus widened more-than-expected to a level of A$2471.0 million in May, amid a surge in exports and following a revised trade surplus of A$90.0 million in the previous month. Market anticipation was for the country's trade surplus to expand to A$1100.0 million.
The pair is expected to find support at 0.7570, and a fall through could take it to the next support level of 0.7540. The pair is expected to find its first resistance at 0.7631, and a rise through could take it to the next resistance level of 0.7662.
Going ahead, investors will focus on Australia's AiG performance of construction index for June, slated to release overnight.
The currency pair is showing convergence with its 20 Hr moving average and trading below its 50 Hr moving average.

Services Sector Activity Across The Euro-Zone Slowed Less Than Initially Estimated In June
For the 24 hours to 23:00 GMT, the EUR marginally declined against the USD and closed at 1.1351.
On the data front, the Euro-zone's final Markit services PMI fell less than initially estimated to a level of 55.4 in June, compared to a drop of 54.7 registered in the preliminary print. In the prior month, the PMI had recorded a level of 56.3. On the other hand, the region's seasonally adjusted retail sales grew more-than-expected by 0.4% on a monthly basis in May, compared to a rise of 0.1% in the prior month.
Separately, growth in Germany's services sector cooled less than initially estimated to a level of 54.0 in June, but remained at a five-month low level, while the flash estimate had indicated a fall to a level 53.7. In the previous month, the PMI had recorded a reading of 55.4.
The greenback traded mixed against a basket of major currencies, after minutes from the Federal Reserve's (Fed) June meeting showed that committee members are still divided over the outlook for US inflation and when to start reducing the balance sheet.
According to minutes, policymakers were not able to agree upon how soon to start winding down their $4.5 trillion balance sheet as some wanted to announce a start to the process by the end of August but others wanted to wait until later in the year. Further, a few members expressed concerns over subdued inflation but most officials voiced confidence that inflation will recover after recent soft readings.
On the economic front, the final durable goods orders eased 0.8% in May, revised from preliminary figures that had recorded a fall of 1.1%. Durable goods orders had recorded a revised drop of 0.9% in the prior month. Moreover, the nation's factory orders declined more-than-anticipated by 0.8% in May, compared to market consensus for a fall of 0.5%.
In the previous month, factory orders had fallen 0.3%. In the Asian session, at GMT0300, the pair is trading at 1.1338, with the EUR trading 0.11% lower against the USD from yesterday's close.
The pair is expected to find support at 1.1311, and a fall through could take it to the next support level of 1.1284. The pair is expected to find its first resistance at 1.1367, and a rise through could take it to the next resistance level of 1.1396.
Moving ahead, market participants will anxiously await the release of the European Central Bank's recent meeting minutes, slated in a few hours, to get cues on whether the bank is closer to begin scaling back its monetary stimulus. Additionally, the US ADP employment report, ISM non-manufacturing PMI and the initial jobless claims data, slated to release later in the day, will keep investors on their toes.
The currency pair is showing convergence with its 20 Hr moving average and trading below its 50 Hr moving average.
