Sample Category Title
GOLD Ready To Bounce Back, SILVER Bullish Consolidation With Medium-Term Bearish Move, CRUDE OIL Continued Bullish Consolidation.
GOLD Ready to bounce back.
RBNZ's medium-term momentum is positive. Hourly support is located at 1236 (26/06/2017 low). Stronger support is given at 1214 (09/05/2017 low). Expected to show renewed bullish pressures.
In the long-term, the technical structure suggests that there is a growing upside momentum. A break of 1392 (17/03/2014) is necessary ton confirm it, A major support can be found at 1045 (05/02/2010 low).
SILVER Bullish consolidation with medium-term bearish move.
Silver's selling pressures are strong despite ongoing bullish consolidation. Closest support is given at 16.29 (26/06/2017 low). Strong support is given at 16.06 (09/05/2017 low). Key resistance is given at a distance at 17.75 (06/06/2017 high). The road seems wide open for further decline.
In the long-term, the death cross indicates that further downsides are very likely. Resistance is located at 25.11 (28/08/2013 high). Strong support can be found at 11.75 (20/04/2009)
CRUDE OIL Continued bullish consolidation.
Crude oil is now consolidating higher since the commodity hit 11-month low. Support is given at 42.05 (21/06/2017 low). Expected to show renewed weakness.
In the long-term, crude oil has recovered after its sharp decline last year. However, we consider that further weakness are very likely. Strong support lies at 35.24 (05/04/2016) while resistance can now be found at 55.24 (03/01/2017 high).
ECB Sources Drag EUR Lower, But Can’t Hold It Down
The euro pulled back briefly yesterday, after media reports familiar with ECB sources suggested that markets misinterpreted ECB President Draghi's comments on Tuesday. Investors had interpreted Draghi's remarks as being on the hawkish side, but these reports said the speech was intended to be balanced.
Our own view is that the ECB appears to be uncomfortable with the elevated speculation regarding an eventual QE-exit, as a rapidly appreciating euro and rising euro area bond yields could weigh on inflation and make the Bank's job of bringing it back to target even harder. Overall, we still believe that the Bank is likely to continue shifting towards a more upbeat tone and that the euro's broader outlook remains positive. The market appears to share our view, considering that even though the euro tumbled on these reports, the currency quickly recovered all its losses to trade even higher in the following hours.
EUR/JPY has been in a rally mode the last few days, especially following the break above the long-term downside resistance line taken from the peak of the 7th of June 2015. We believe that following that break, the medium-term outlook of the pair has turned positive and that the move above 127.80 (S1) may have opened the way for the psychological zone of 130.00 (R1). Nevertheless, given that the rally appears overextended, we would stay careful that a corrective setback may be on the cards before the bulls decide to take charge again.
Carney boosts sterling; Queen's Speech in focus
The BoE Governor shifted to a somewhat hawkish tone yesterday, hinting that he could support a rate hike in the upcoming policy meetings. Carney said that the removal of monetary stimulus is likely to become necessary as the trade-off facing the MPC continues to lessen. He added that a hike may depend mainly on whether weaker consumption growth is offset by stronger business investment, and on whether wages begin to firm.
The result was a surge in the pound as these remarks may have caught investors by surprise, considering that just last week, Carney was perceived as dovish when he said “now is not the time to raise rates”. The question now is: Will the BoE actually hike? We think that much will depend on wage growth, which has been lackluster so far. Unless it picks up notably, any policy tightening seems unlikely, in our view. Having said that, the number of MPC members willing to support a hike appears to be increasing. McCafferty and Saunders already voted for a hike in June, while Haldane and now Carney both hint they could support one in coming months as well.
Turning to UK politics, the focus today may be on the Queen's Speech vote. Importantly, the Tory-DUP deal is now finalized. Thus, the 10 DUP MPs are expected to vote for the Speech, which implies Theresa May is likely to keep her job as PM. If all goes as planned and Parliament approves the Speech, political uncertainty in the UK could dissipate further, and market focus is likely to turn to headlines surrounding the Brexit negotiations. In this scenario, GBP could gain, but given that this is widely anticipated, any positive reaction may be modest. On the other hand, should lawmakers reject the Speech, GBP could tumble on the increased uncertainty over who will be the next PM, as well as the probable delay of the crucial EU-UK talks. Looking a few days ahead though, the prospect of a Labour government or another election could result in a stronger pound overall, as the likelihood of a hard Brexit will probably diminish.
GBP/USD skyrocketed on Wednesday following Carney's rhetoric to emerge above the key resistance (now turned into support) territory of 1.2850 (S2). Subsequently, it broke above the crossroad of the 1.2910 (S1) barrier and the downside resistance line taken from the peak of the 18th of May. In our view, this keeps the door open for further advances and a positive vote on the Queen Speech today may be the trigger for something like that. A clear break above 1.2975 (R1) is possible to open the way for our next resistance hurdle of 1.3015 (R2). In the unlikely scenario of the Speech being rejected, the pair may tumble back below 1.2910 (S1) and perhaps challenge the 1.2850 (S2) territory as a support this time.
As for today's economic data:
In Germany, the preliminary CPI rate for June is expected to have ticked down. Such a decline could hurt the euro somewhat, but we would like to stress that Germany reports only a headline, not a core, inflation rate. Thus, a small slide in this rate could be owed mainly to movements in the prices of volatile items, and may not necessarily be descriptive of underlying inflationary pressures in Eurozone's economic powerhouse.
From the US, we get the final estimate of GDP for Q1, but considering that Q2 is almost over, we think that these data are likely to be viewed as outdated and thus any reaction in USD may be limited.
EUR/JPY
Support: 127.80 (S1), 126.45 (S2), 125.70 (S3)
Resistance: 130.00 (R1), 132.10 (R2), 134.65 (R3)
GBP/USD
Support: 1.2910 (S1), 1.2850 (S2), .1.2795 (S3)
Resistance: 1.2975 (R1), 1.3015 (R2), 1.3050 (R3)
Daily Technical Analysis: USD/JPY Zig-Zag Uptrend But Watch For D H4 Resistance
The USD/JPY has been moving in a zig-zag pattern that indicates uptrend but at this point its close to ATR top/D H4 resistance. We can also see a bearish divergence so we might expect some pullback. The POC zone is 112.00-15 (38.2, D L4, EMA89, ATR pivot). If the price gets there we might see a bounce towards D H5 112.90. However if the price gets to ATR top/ D H5 we might see a rejection towards 112.20-00 again. So watch for both zones in terms of trading as the price might reject from both POC and D H5/ ATR top confluence.
Technical Outlook: WTI Hits Two-Week High As Recovery Extends Into Sixth Straight Day
WTI oil price hit two-week high at $45.22 on Thursday, after extension of Wednesday's strong rally cracked important barrier at $45.04 zone (Fibo 61.8% of $46.69/$42.04/falling 20SMA/19 June high). Oil price extends recovery rally from $42.04 low into a sixth day, after unexpected build in US crude inventories was offset by bigger than expected fall in gasoline inventories and report of the biggest weekly decline in domestic oil production since July 2016. Positive sentiment that has been established may drive the price higher on sustained break of $45.00 pivot. Fresh bullish extension would look for $45.59/84 (Fibo 76.4% of $46.69/$42.04/Fibo 38.2% of $51.98/$42.04) and may extend towards key short-term barrier at $46.69 (12 June lower top). Corrective dips should find support at $44.30 (4-hr cloud top), while stronger pullback is expected to hold above 10SMA (currently at $43.77) to keep near-term bullish structure intact).
Res: 45.22, 45.59, 45.84, 46.46
Sup: 44.74, 44.30, 44.00, 43.77

EUR/JPY Bullish Breakout, EUR/GBP Sideways Price Action, EUR/CHF Strengthening After Breaking Downtrend Channel.
EUR/JPY Bullish breakout.
EUR/JPY continues its increase after the pair surged and broke hourly resistance at 125.82 (16/05/2017 high). Hourly support is given at 122.56 (18/05/2017 low). Major support is given at 114.90 (18/04/2017 low).
In the longer term, the technical structure validates a medium-term succession of lower highs and lower lows. As a result, the resistance at 149.78 (08/12/2014 high) has likely marked the end of the rise that started in July 2012. Strong support at 94.12 (24/07/2012 low) looks nonetheless far away.
EUR/GBP Sideways price action.
EUR/GBP is trading mixed. Support can be found at 0.8652 (08/06/2017 low). Expected to show further consolidation.
In the long-term, the pair has largely recovered from recent lows in 2015. The technical structure suggests a growing upside momentum. The pair is trading above from its 200 DMA. Strong resistance can be found at 0.9500 psychological level.Sideways price action.
EUR/CHF Strengthening after breaking downtrend channel.
EUR/CHF's short-term bullish pressures are definitely on. The pair is riding higher within downtrend channel. Hourly support is located at a distance at 1.0792 (03/05/2017 low) while the pair is heading towards resistance given at 1.0987 (12/05/2017 high).
In the longer term, the technical structure is mixed. Resistance can be found at 1.1200 (04/02/2015 high). Yet,the ECB's QE programme is likely to cause persistent selling pressures on the euro, which should weigh on EUR/CHF. Supports can be found at 1.0184 (28/01/2015 low) and 1.0082 (27/01/2015 low).
Trade Idea: GBP/USD – Buy at 1.2870
GBP/USD – 1.2962
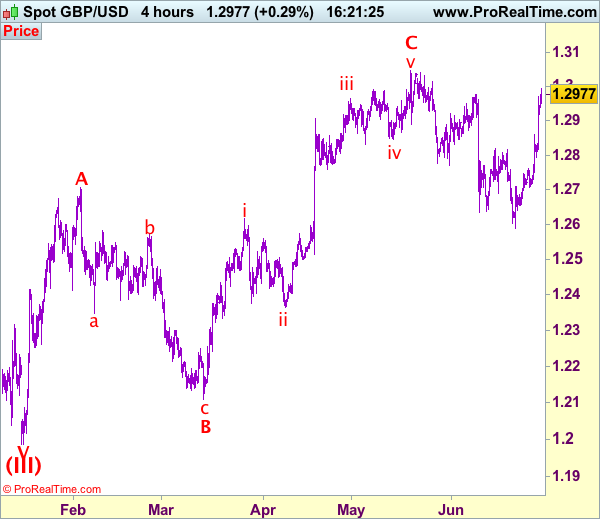
Recent wave: Wave V of larger degree wave (III) has ended at 1.1986 and major correction has commenced from there for gain to 1.3000 and 1.3140-50
Trend: Near term down
Original strategy :
Buy at 1.2760, Target: 1.2910, Stop: 1.2700
Position: -
Target: -
Stop: -
New strategy :
Buy at 1.2870, Target: 1.3020, Stop: 1.2810
Position: -
Target: -
Stop:-
As sterling has eased after surging briefly above 1.3000 level, suggesting consolidation below intra-day resistance at 1.3007 would be seen and pullback to 1.2900-10 is likely, however, reckon previous resistance at 1.2861 would turn into support and limit cable’s downside, bring another rise later, above said resistance at 1.3007 would extend the rise from 1.2589 low towards recent high at 1.3048 which is likely to hold on first testing.
Our preferred count on the daily chart is that cable's rebound from 1.3500 (wave (A) trough) is unfolding as a wave (B) with A ended at 1.7043, followed by triangle wave B and wave C as well as wave (B) has ended at 1.7192, the subsequent selloff is the larger degree wave (C) which is still unfolding with minor wave (III) of larger degree wave 3 ended at 1.1986, hence wave (IV) correction is in progress which could either be a triangle wave (IV) of a complex formation but upside should be limited to 1.3500 and price should falter well below 1.4000, bring another decline in wave (V) of 3 for weakness to 1.1500, then 1.1200.
On the downside, whilst initial pullback to 1.2900-10is likely, reckon 1.2861 (previous resistance turned support) and bring such a rise. Below support at 1.2794 would abort and signal top is formed instead, risk further fall to 1.2750, then towards 1.2706 support.
Trade Idea: GBP/JPY – Buy at 144.30
GBP/JPY - 145.80
Recent wave: Medium term low formed at 120.50 and (A)-(B)-(C) major correction has commenced with (A) leg ended at 148.45, hence wave (B) is unfolding for retreat to 131.00-10.
Trend: Near term down
Original strategy:
Buy at 142.60, Target: 144.50, Stop: 142.00
Position: -
Target: -
Stop: -
New strategy :
Buy at 144.30, Target: 146.30, Stop: 143.70
Position: -
Target: -
Stop:-
As sterling has retreated after rising to 146.45, suggesting minor consolidation below this level would be seen and pullback to 145.00-10 is likely, however, reckon previous resistance at 144.20 would turn into support and limit downside, bring another rise later, above said resistance at 146.45 would extend the erratic rise from 138.70 low to 147.10 (previous resistance) but price should falter below recent high at 148.10.
In view of this, would not chase this rise here and we are looking to buy sterling on subsequent pullback as previous resistance at 144.20 should limit downside and bring another rise. Below 143.90-00 would defer but only break of support at 143.30 would signal top is formed instead, bring correction to 142.90-00.
Our preferred count is that larger degree wave V with circle is unfolding from 251.12 with wave (I) 219.34, (II): 241.38 and wave (III) is subdivided into 1: 192.60, 2: 215.89 (23 Jul 2008) and wave 3 ended at 118.87 earlier in 2009. The correction from there to 162.60 is wave 4 which itself is a double three and is labeled as first a-b-c ended at 151.53, followed by wave x at 139.03, 2nd a ended at 162.60, 2nd b at 146.75 and 2nd c leg of wave 4 ended at 163.00. Therefore, the decline from 163.00 to 116.85 is now treated as wave 5 which also marked the end of larger degree wave (III), hence wave (IV) major correction has commenced for retracement of the wave (III) from 241.38 and upside target at 183.95-00 (50% Fibonacci retracement of the wave (II) from 241.38) had been met, a drop below 160.00 would suggest wave (IV) has ended at 195.85, bring decline in wave (V) for initial weakness to 130 (already met) and 120.

USD/CHF Weakening, USD/CAD Heading Towards Strong Support, AUD/USD Sideways Price Action Around 0.7600.
USD/CHF Weakening.
USD/CHF keeps on pushing lower. Hourly resistance can be found at 0.9771 (09/06/2017 high). Strong resistance is given at 1.0107 (10/04/2017 high). Hourly support is given at 0.9561 (intraday low). Expected to show continued bearish pressures.
In the long-term, the pair is still trading in range since 2011 despite some turmoil when the SNB unpegged the CHF. Key support can be found 0.8986 (30/01/2015 low). The technical structure favours nonetheless a long term bullish bias since the unpeg in January 2015.
USD/CAD Heading towards strong support.
USD/CAD is way into bearish mode. Strong support is given at 1.2969 (31/01/2017 low). Expected to show continued weakness towards.
In the longer term, the pair lies in a bullish channel since a year. Strong resistance is given at 1.4690 (22/01/2016 high). Long-term support can be found at 1.2461 (16/03/2015 low).
AUD/USD Sideways price action around 0.7600.
AUD/USD #39;s technical structure is bullish since early May. The pair is heading towards strong resistance at 0.7750 (21/03/2017 high).
In the long-term, we are waiting for further signs that the current downtrend is ending. Key supports stand at 0.6009 (31/10/2008 low) . A break of the key resistance at 0.8295 (15/01/2015 high) is needed to invalidate our long-term bearish view.
EUR/USD Strong Short-Term Bullish Momentum, GBP/USD Pushing Higher, USD/JPY Strengthening.
EUR/USD Strong short-term bullish momentum.
EUR/USD is trading higher. The pair is trading above former strong resistance given at 1.1300 (09/11/2017 high). Hourly support can be found at 1.1076 (18/05/2017 low). Stronger support lies at 1.0842 (11/05/2017 low). Expected to show continued short-term strength.
In the longer term, the momentum is clearly negative. We favour a continued bearish bias towards parity. Key resistance holds at 1.1714 (24/08/2015 high) while strong support lies at 1.0341 (03/01/2017 low).
GBP/USD Pushing higher.
GBP/USD's momentum is higher than expected and the pair is now monitoring resistance give at 1.3046 (18/05/2017 high). Hourly support is given at 1.2589 (21/06/2017 low). Hourly resistance at 1.2818 (14/06/2017 high) has been broken. Expected to show further continued buying pressures.
The long-term technical pattern is even more negative since the Brexit vote has paved the way for further decline. Long-term support given at 1.0520 (01/03/85) represents a decent target. Long-term resistance is given at 1.5018 (24/06/2015) and would indicate a long-term reversal in the negative trend. Yet, it is very unlikely at the moment.
USD/JPY Strengthening.
USD/JPY has finally broken resistance given at 112.13 (24/05/2017 high). Hourly support can be found at 110.65 (16/06/2017 low). Stronger support is located at 108.13 (17/04/2017 low). Expected to show continued pressures.
We favor a long-term bearish bias. Support is now given at 96.57 (10/08/2013 low). A gradual rise towards the major resistance at 135.15 (01/02/2002 high) seems absolutely unlikely. Expected to decline further support at 93.79 (13/06/2013 low).
Technical Outlook: AUDUSD At 3-Month High, Further Upside Favored
The Aussie dollar hit three-month high on Thursday in extension of previous day's strong rally, driven by higher commodity prices and ultra-hawkish comments regarding interest rates from former RBA board member on Thursday.
Fresh bullish extension dented former high of 30 Mar at 0.7379 and may extend gains on firm break higher, driven by bullish technical studies and sentiment.
The pair is currently riding on the fifth wave of five-wave cycle from 0.7328 (09 May low) which could travel to 0.7720, according to the wave principles and may extend towards key med-term barriers at 0.7749 (21 Mar peak) and 0.7778(08 Nov 2016 high).
Former high of 14 June at 0.7635, also session low, marks solid support, with ascending daily Tenkan-sen (currently at 0.7608) underpinning the action.
Res: 0.7680, 0.7700, 0.7720, 0.7749
Sup: 0.7651, 0.7635, 0.7608, 0.7588