Sample Category Title
GBP/USD Analysis: Approaches Critical Point
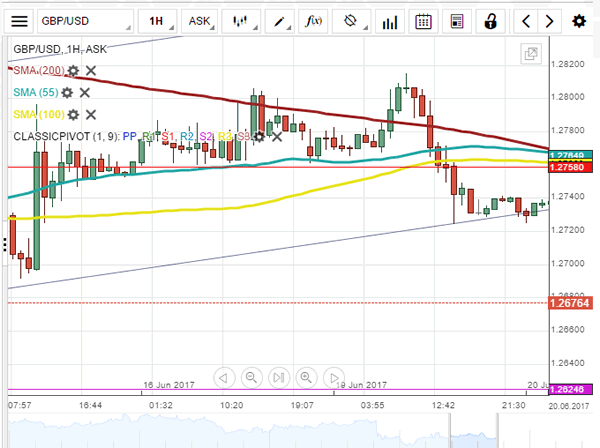
Monday did not favour the Pound, as the Cable once again fell under the monthly S1. However, support was found near 1.2725, namely the ascending channel's support line. The Sterling risks breaking this trend-line if supply at the monthly S1 is strong enough for such an occurrence. Technical indicators support the possibility of the negative outcome today, but the British currency could still receive a boost and outperform the Greenback. Consequently, the GBP/USD pair would then be able to finally stabilise above the tough resistance cluster, which rests circa 1.2770. In turn, a close above this zone is likely to allow the Cable to continue recovering until all post-parliamentary election losses are erased.
USD/JPY Analysis: Attempts To Break Through 111.80
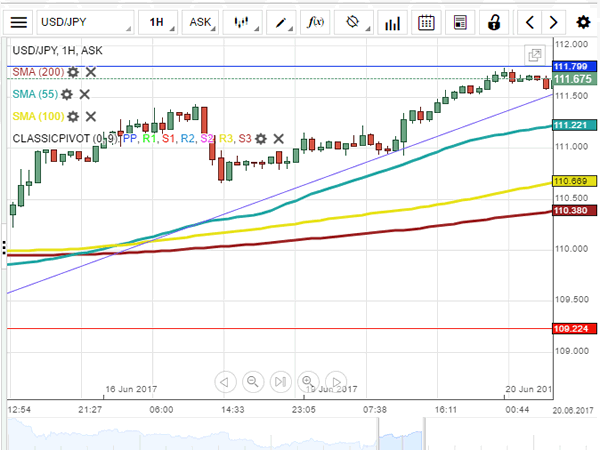
As was anticipated, the US Dollar was able to outperform the Japanese Yen on Monday. Further gains could be limited by the 111.80 level, namely the monthly PP, which could result in the recently acquired up-trend to be broken. A successful surge above the mentioned pivot point is expected to prolong the given pair's bullish momentum and put the monthly R1 at 113.35 into perspective. Technical studies, however, are unable to confirm the possibility of such an outcome, thus, we should not rule out the bearish scenario—a break of the up-trend. Even though the pair is supported by a number of significant levels, downside risks persist amid political and fundamental uncertainties. Ultimately, the pair could slide back to 109.22 if the up-trend gets pierced today.
Trade Idea: EUR/JPY – Buy at 123.80
EUR/JPY - 124.36
Recent wave: wave v of (C) ended at 94.12 and major correction in wave A has ended at 149.79
Trend: Near term up
Original strategy:
Buy art 123.40, Target: 125.40, Stop: 122.80
Position: -
Target: -
Stop: -
New strategy :
Buy art 123.80, Target: 125.30, Stop: 123.20
Position: -
Target: -
Stop:-
As the single currency has continued moving higher, suggesting the rise from 122.40 (last week’s low) is still in progress and bullishness remains for this move to extend further gain to 125.00, however, break of resistance at 125.31 is needed to retain upside bias and signal correction from 125.82 has ended at 122.40, bring subsequent rise towards this level which is likely to hold on first testing due to overbought condition.
In view of this, would not chase this rise here and we are looking to buy euro on dips as 123.80 should limit downside and bring another rebound later. Below 123.30-35 would defer and suggest first leg of rebound from 122.40 has ended instead, risk further weakness to 122.90-00 but price should stay well above said support at 122.40, bring another rebound later.
Our latest preferred count is that wave (ii) is ABC-X-ABC which ended at 123.33 and wave (iii) is unfolding with wave iii ended at 100.77, followed by wave iv at 111.57 and wave v as well as the wave (iii) has ended at 97.04, followed by wave (iv) at 111.43 and wave (v) has ended at 94.12 which is also the end of the larger degree v, this also implied the major wave (C) has also ended there, hence major correction has commenced from there with (A) leg unfolding in its lower degree wave c which has possibly ended at 145.69. Under this count, A-B-C wave (B) has commenced with A leg ended at 136.23, wave B at 143.79 and wave C has possibly ended at 149.79.
Our larger degree count is that the decline from 139.26 is wave (C) and is sub-divided into a diagonal triangle i-ii-iii-iv-v with wave i - 105.44, wave ii- 123.33, wave iii - 97.03, wave iv - 111.43, followed by the final wave v as well as the end of wave (C) at 94.12, this also mark the bottom of larger degree wave B. Under this count, major rise in wave C has commenced as an impulsive wave with minor wave III ended at 145.69, wave V is still in progress for further gain to 150.00. Having said that, this so-called wave V could well be the first leg of larger degree 5-waver wave C and this wave C should bring at least a retest of wave A top at 169.97 (July 2008).

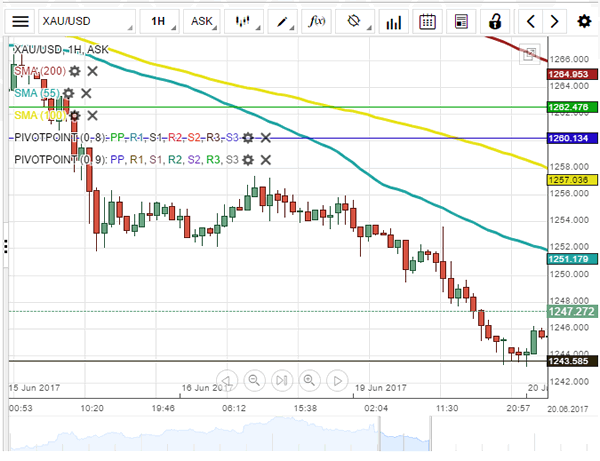
Gold Analysis: Finds Support
On the hourly charts, which are drawn by the Dukascopy analysts, it can be observed that the weekly S1 at 1,243.59 has done its job in providing support to the yellow metal's price. However, the commodity price has still not reached the lower trend line of the long term ascending channel pattern. On Tuesday morning and throughout the rest of the day the trend line is set to remain below the 1,240 mark, which means that the price could still decline. In addition, the 55-hour SMA is approaching the bullion from the upside near the 1,250 mark. The simple moving average could provide the needed force to push the price lower. On the other hand the metal could continue to trade almost flat and also reach the mentioned trend line.
Reserve Bank Of Australia Expresses Concerns Over Housing Market And Employment
'The RBA is getting more concerned about the outlook for consumption and, just as it didn't get too depressed by the rise in the unemployment rate to 5.9 percent earlier this year, it won't get too excited by the fall to 5.5%.' - Paul Dales, Capital Economics
The Reserve Bank of Australia remained concerned over employment and the housing market, official data released on Tuesday showed. The Central bank said that real estate prices were surging in Sydney and Melbourne but noted that price pressures started to ease to some extent, minutes of the Bank's last meeting when policymakers kept interest rates unchanged at 1.50% revealed. Apart from that, the RBA said that employment growth improved significantly over the past several months, while the number of hours worked dropped. The Bank held its meeting before employment data for May was released and showed that the jobless rate fell to a four-year low of 5.5% and the economy gained new jobs for the third consecutive month. Policymakers expressed concerns over housing debt, as it offset household earnings. The RBA stated that weak pay growth would unlikely rebound in the near future and, therefore, consumer spending is expected to remain weak. Despite the weak Q1 performance, policymakers said that economic growth would likely pick-up in the upcoming quarters.
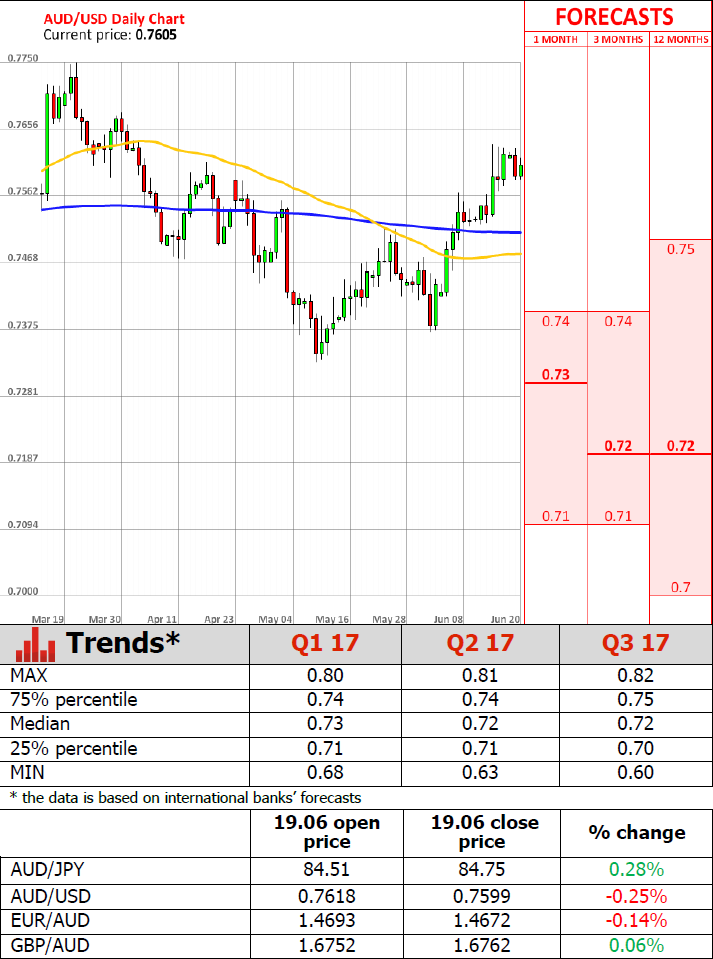
Trade Idea: AUD/USD – Buy at 0.7595
AUD/USD – 0.7617
Recent wave: Wave 5 ended at 1.1081 and major correction has commenced for fall to 0.7000 and then towards 0.6500-10
Trend: Near term up
Original strategy :
Buy at 0.7525, Target: 0.7670, Stop: 0.7465
Position: -
Target: -
Stop: -
New strategy :
Buy at 0.7595, Target: 0.7745, Stop: 0.7535
Position: -
Target: -
Stop:-
As aussie has maintained a firm undertone, suggesting recent upmove would resume after consolidation, above indicated resistance at 0.7636 would confirm and extend the rise from 0.7329 towards previous resistance at 0.7680 but loss of momentum should limit upside to chart resistance at 0.7750 and price should falter below 0.7785-90.
In view of this, we are looking to buy aussie on dips as 0.7590-95 should limit downside and bring another rise. Below 0.7560-65 would defer and suggest top is possibly formed, bring correction to 0.7515-20, break there would provide confirmation, then correction to 0.7490-95 and possibly towards support at 0.7457 would be seen later.
On the 4-hour chart, the move from 0.8066 is the wave 5 with i: 0.8860, ii: 0.8315, wave iii is an extended move ended at 1.0183, iv: 0.9706 and wave v has ended at 1.1081 (also the top of entire wave 5). The subsequent selloff is the major correction which is unfolding as ABC-X-ABC and 2nd A leg has ended at 0.8848, followed by a-b-c wave B which ended at 0.9758, hence, 2nd C wave is now in progress and indicated downside target at 0.7000 and 0.6950 had been met, so further fall to 0.6710-20 cannot be ruled out.

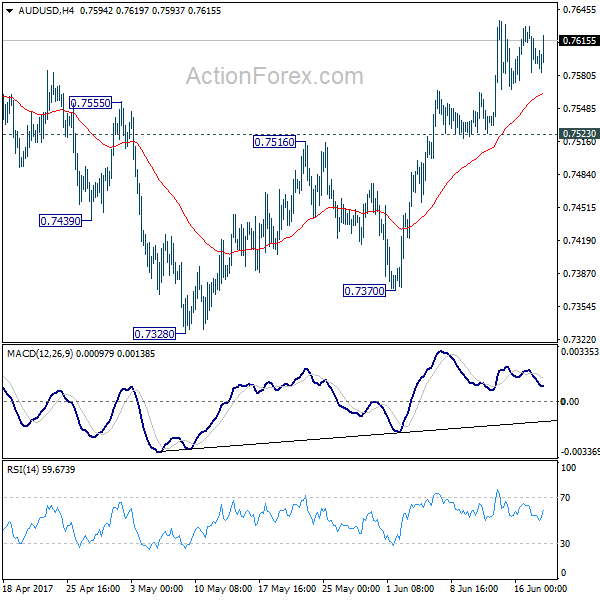
AUD/USD Daily Outlook
Daily Pivots: (S1) 0.7578; (P) 0.7604; (R1) 0.7622; More....
No change in AUD/USD's outlook. With 0.7523 minor support intact, further rise is still expected for 0.7748 resistance and above. At this point, there is no clear sign of range breakout at. Hence, we'd be cautious on topping again as it approaches medium term fibonacci level at 0.7849. Meanwhile, break of 0.7523 will argue that rebound from 0.7328 is possibly completed. In that case, intraday bias will be turned back to the downside for 0.7370 support.
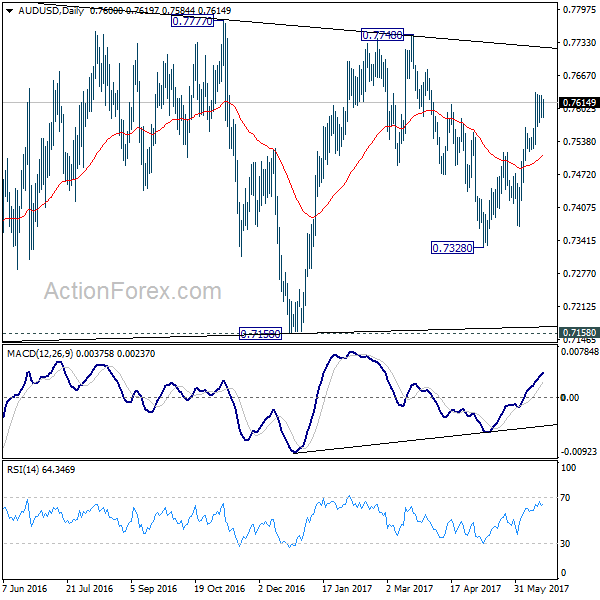
In the bigger picture, we're still treating price actions from 0.6826 low as a corrective pattern. And, as long as 38.2% retracement of 0.9504 to 0.6826 at 0.7849 holds, long term down trend from 1.1079 is expected to resume sooner or later. Break of 0.6826 low will target 0.6008 key support level. However, firm break of 0.7849 will indicate that rise from 0.6826 is developing into a medium term rebound, rather than a sideway pattern. In such case, stronger rise should be seen to 55 month EMA (now at 0.8116) and above.
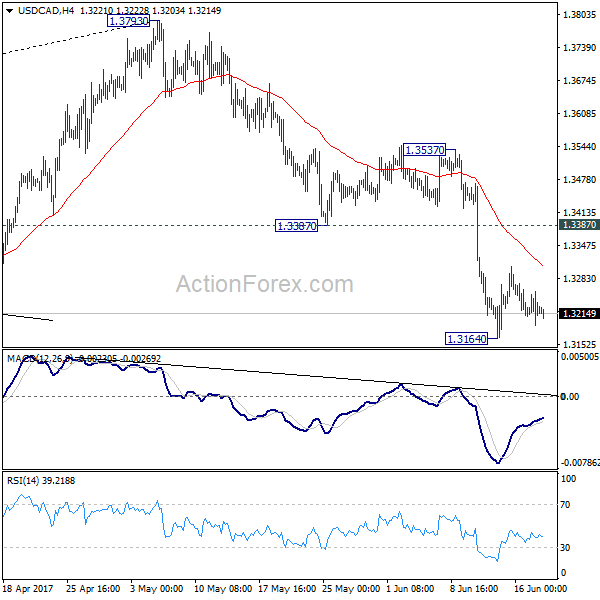
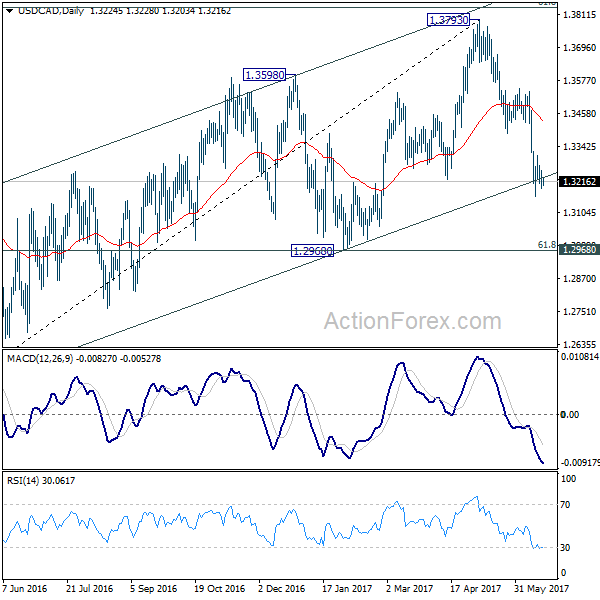
USD/CAD Daily Outlook
Daily Pivots: (S1) 1.3187; (P) 1.3222; (R1) 1.3253; More....
USD/CAD's consolidation from 1.3164 temporary low is still in progress and intraday bias remains neutral. Another recovery could be seen. But upside should be limited by 1.3387 support turned resistance and bring fall resumption. We're holding on to the view that corrective rise from 1.2460 has completed at 1.3793 already. Below 1.3164 will target 1.2968 cluster support, 61.8% retracement of 1.2460 to 1.3793 at 1.2969.
In the bigger picture, price actions from 1.4689 medium term top are seen as a correction pattern. The first leg has completed at 1.2460. Rise from 1.2460 is seen as the second leg and has completed at 1.3793, ahead of 61.8% retracement of 1.4689 to 1.2460 at 1.3838. Break of 1.3222 should now indicate the start of the third leg while further break of 1.2968 should confirm. In that case, USD/CAD should decline through 1.2460 support to 50% retracement of 0.9406 to 1.4869 at 1.2048.
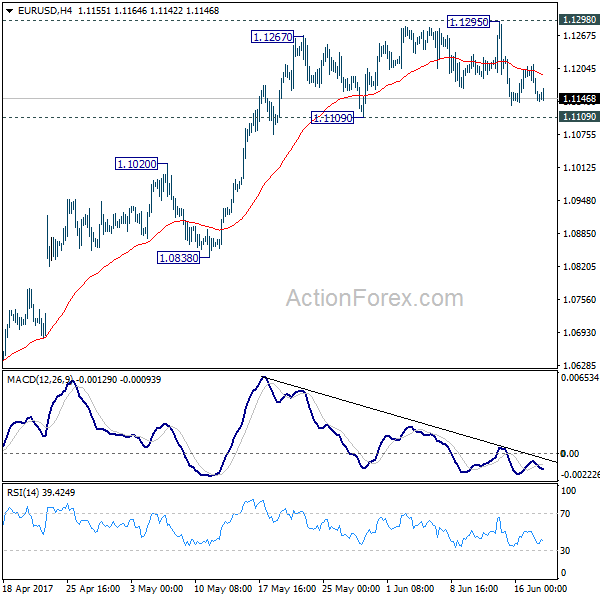
Technical Outlook: EURUSD – Weakening Daily Technicals Increase Downside Risk
The Euro fell near recent lows at 1.1130/40 zone after recovery attempts were repeatedly capped by 20SMA and hawkish comments from Fed policy maker William Dudley boosted the dollar.
Monday's long red daily candle and 10/20SMA bear cross weigh on near-term action which puts last week's low at 1.1132 and more significant 1.1121/09 supports (Fibo 38.2% of 1.0839/1.1295 upleg / 30 May low) under renewed pressure.
Fresh near-term bears were so far contained by bull-trendline, connecting 1.1109/1.1132 lows and rising daily Kijun-sen, however, negative near-term studies and daily technicals gaining bearish momentum, see risk of further weakness.
Firm break below 1.1121/09 pivots is required to signal bearish resumption and open next targets at 1.1067 and 1.1013 (Fibo 50% and 61.8% retracement of 1.0839/1.1295 upleg respectively).
Limited upside action is seen as focus is turning lower, with extended upticks expected to stay below widening hourly cloud (cloud base is currently at 1.1178).
Falling 10SMA is maintaining downside pressure.
Alternative scenario needs bullish acceleration and close above 20SMA / daily Tenkan-sen (1.1207/13 respectively) to neutralize rising downside risk.
Res: 1.1165, 1.1178, 1.1193, 1.1207
Sup: 1.1140, 1.1132, 1.1121, 1.1109
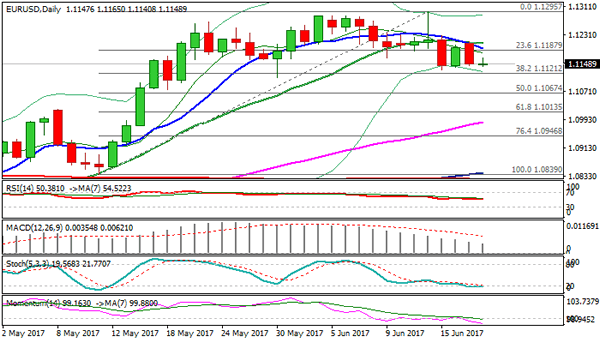
EUR/USD Daily Outlook
Daily Pivots: (S1) 1.1122; (P) 1.1167 (R1) 1.1192; More....
EUR/USD continues to trade in consolidative trading in range of 1.1109/1295. Intraday bias remains neutral at this point. Focus stays on 1.1298 key resistance. Decisive break there will carry larger bullish implication and target 1.1615 resistance next. On the downside, break of 1.1109 support will indicate short term topping and rejection from 1.1298. In such case, intraday bias will be turned to the downside for 1.0838 support.
In the bigger picture, the case for medium term reversal continues to build up with EUR/USD staying far above 55 week EMA (now at 1.0932). Also, bullish convergence condition is seen in weekly MACD. Focus will now be on 1.1298 key resistance. Rejection from there will maintain medium term bearishness and would extend the whole down trend from 1.6039 (2008 high). However, firm break of 1.1298 will indicate reversal. In such case, further rally would be seen back to 1.2042 support turned resistance next.