
Sample Category Title
Technical Outlook: USDJPY – Downside Remains At Risk While Tenkan-Sen/200 SMA Cap, FOMC In Focus
The pair is struggling to sustain gains above 110.00 handle, with falling 10SMA continuing to cap and keeping the downside at risk. Overall bearish structure supports the notion as the price stays below key barriers at 110.41 (daily Tenkan-sen) and 110.59 (200SMA). Return below Monday's low at 109.62 would attract key support at 109.11 (07 June low). Last Friday's high at 110.81 (reinforced by 20SMA) marks pivotal barrier and break here would sideline persisting downside risk. Outcome of FOMC meeting is expected to trigger stronger movements and signal near-term direction.
Res: 110.35, 110.41, 110.59, 110.81
Sup: 109.95, 109.62, 109.38, 109.11
What Is Gold’s Next Move After US FED Interest Rate Decision on 14th June, 2017?
Technical analysis chart of Gold with Volume and On Balance Volume indicators, and support and resistance lines, may give guidance as to the direction Gold may take a!er FED Interest rate decision.
The recent fall in price over the last three days does not have support from volume and this suggests a bounce should be expected here or very soon. Additionally, there is strong, bullish support for Gold's price at about 1,260. These support the idea of upwards movement a!er the FED Interest rate decision.
However, the latest and now most important signal comes from On Balance Volume breaking below support. This is bearish.
Given that a technical analysis approach would expect Gold to move mostly in the direction of least resistance and away from greatest support, the expectation is for Gold to breakout upwards. But because of On Balance Volume's bearish signal, any upside movement is expected to be relatively short lived.
Elliott Wave Analysis: BTCUSD Trading In Final Stages Of An Impulse
Bitcoin is unfolding an impulsive pattern to the upside, which means that red wave 4 correction has ended around the 1800 mark. We now see a five wave impulsive movement which unfolded in black wave 3 and found a top near the 3000 level. Wave 3 can so be completed and recent pullback could represent black wave 4 correction. That said, if wave 4 correction is completed then we can expect a new recovery to follow into the final black wave 5, but if price contniues from current levels lower, then it can be safe to say, that a top has been already placed and that a depeer correction can be in progress.
BTCUSD, 4H
Technical Outlook: AUDUSD – Fresh Bulls Probe Again Above 100SMA
The Aussie dollar rallied in early European trading, boosted by weaker US dollar and overall solid Chinese data and broke above descending daily cloud top at 0.7539. Fresh bulls are pressuring key near-term barriers at 0.7555/65 (100SMA/top of five-day congestion). Sustained break here is needed to signal continuation of the bull-leg from 0.7369 (02 June trough), which is also the third wave of five-wave cycle from 0.7328 (09 May low), towards targets at 0.7588 (Fibo 61.8% of 0.7749/0.7328 descend) and 0.7604 (FE 123.6% of wave C).
Failure to clear 0.7555/65 pivots would signal prolonged congestion, with key near-term support at 0.7525 (200SMA) expected to hold dips and keep intact overall bullish structure.
Fed's decision due later today is expected to give firmer direction signals.
Res: 0.7565, 0.7588, 0.7604, 0.7632
Sup: 0.7539, 0.7525, 0.7506, 0.7490
Trade Idea: GBP/USD – Sell at 1.2850
GBP/USD – 1.2755
Recent wave: Wave V of larger degree wave (III) has ended at 1.1986 and major correction has commenced from there for gain to 1.3000 and 1.3140-50
Trend: Near term up
Original strategy :
Sell at 1.2820, Target: 1.2620, Stop: 1.2880
Position: -
Target: -
Stop: -
New strategy :
Sell at 1.2850, Target: 1.2650, Stop: 1.2910
Position: -
Target: -
Stop:-
Cable’s rebound after holding above indicated support at 1.2635 (last week’s low) has retained our view that further consolidation above this level would be seen and another bounce to 1.2800-05 cannot be ruled out, however, reckon upside would be limited to 1.2845-50 and bring another decline, below 1.2680 would bring test of said support at 1.2635, break there would extend recent decline from 1.3048 for retracement of recent upmove to 1.2600 but downside should be limited to 1.2550 and reckon previous support at 1.2515 would hold from here.
Our preferred count on the daily chart is that cable's rebound from 1.3500 (wave (A) trough) is unfolding as a wave (B) with A ended at 1.7043, followed by triangle wave B and wave C as well as wave (B) has ended at 1.7192, the subsequent selloff is the larger degree wave (C) which is still unfolding with minor wave (III) of larger degree wave 3 ended at 1.1986, hence wave (IV) correction is in progress which could either be a triangle wave (IV) of a complex formation but upside should be limited to 1.3500 and price should falter well below 1.4000, bring another decline in wave (V) of 3 for weakness to 1.1500, then 1.1200.
On the upside, expect recovery to be limited to 1.2800-05 and 1.2850 should hold, bring another decline. Above 1.2860-70 would defer and suggest low is possibly formed instead, risk a stronger rebound towards 1.2900 but price should falter well below this week’s high at 1.2978 and bring another decline later.

Trade Idea: GBP/JPY – Sell at 141.50
GBP/JPY - 140.65
Recent wave: Medium term low formed at 120.50 and (A)-(B)-(C) major correction has commenced with (A) leg ended at 148.45, hence wave (B) is unfolding for retreat to 131.00-10.
Trend: Near term up
Original strategy:
Sell at 141.30, Target: 139.30, Stop: 141.90
Position: -
Target: -
Stop: -
New strategy :
Sell at 141.50, Target: 139.50, Stop: 142.10
Position: -
Target: -
Stop:-
As sterling found good support at 138.70 earlier this week and has staged a strong rebound, retaining our view that further consolidation above this level would be seen and corrective bounce to 141.00-10 cannot be ruled out, however, reckon upside would be limited and renewed selling interest should emerge around 141.40-50, bring another decline later, below 139.40-50 would bring another test of said support at 138.70 but break there is needed to signal the decline from 148.11 top has resumed and may extend further weakness to 138.45-50.
In view of this, would not chase this fall here and we are looking to sell sterling again on further subsequent recovery as upside should be limited to 141.40-50 and bring another decline. Above 141.90-00 would defer and risk rebound to 142.40-50 but said resistance at 142.75 should limit upside and bring another selloff later.
Our preferred count is that larger degree wave V with circle is unfolding from 251.12 with wave (I) 219.34, (II): 241.38 and wave (III) is subdivided into 1: 192.60, 2: 215.89 (23 Jul 2008) and wave 3 ended at 118.87 earlier in 2009. The correction from there to 162.60 is wave 4 which itself is a double three and is labeled as first a-b-c ended at 151.53, followed by wave x at 139.03, 2nd a ended at 162.60, 2nd b at 146.75 and 2nd c leg of wave 4 ended at 163.00. Therefore, the decline from 163.00 to 116.85 is now treated as wave 5 which also marked the end of larger degree wave (III), hence wave (IV) major correction has commenced for retracement of the wave (III) from 241.38 and upside target at 183.95-00 (50% Fibonacci retracement of the wave (II) from 241.38) had been met, a drop below 160.00 would suggest wave (IV) has ended at 195.85, bring decline in wave (V) for initial weakness to 130 (already met) and 120.

EUR/CHF Elliott Wave Analysis
EUR/CHF : 1.0852
EUR/CHF: Major wave 5 trough ended at 0.8426 and correction has commenced from there for subsequent gain towards 1.1400-1.1500.
As the single currency has remained under pressure after breaking previous support at 1.0866, suggesting the fall from 1.0988 is still in progress and marginal weakness from here cannot be ruled out, however, a daily close below previous support at 1.0792 is needed to signal recent rise has ended and extend the fall from 1.0988 towards previous minor resistance at 1.0720. Looking ahead, only a drop below 1.0720 would suggest top is formed instead, risk weakness towards said support at 1.0656 first.
To recap our preferred count, the decline from 1.6828 (end wave (B)) is labeled as the beginning of wave (C) which should unfold as an impulsive move with 1: 1.5326, 2: 1.6377 and wave 3 is sub-divided into (i): 1.4300, (ii): 1.5880 and wave (iii) is still unfolding with (1): 1.4577, (2): 1.5448 and wave (3) is an extended 3rd with i: 1.5006, ii: 1.5383, wave iii: 1.3073, then wave iv ended at 1.3925 and wave v at 1.3073, wave (4) ended at 1.3925 and wave (5) has ended at 1.2765 which also marked the low of wave (iii) and wave (iv) has ended at 1.3835 and wave (v) as well as larger degree wave 3 has ended at 1.0075. The selloff from 1.2650 signals wave 4 has ended there and we are taking a view that the wave 5 could also have ended 0.8426, hence consolidation is seen with mild upside bias for rebound to 1.1000 first, then towards 1.1400.
On the upside, above 1.0875-80 wold bring recovery to 1.0920 but break there is needed to signal low is formed, bring test of 1.0949 resistance, only a daily close above there would signal the pullback from 1.0988 has ended and bring retest of this level. Looking ahead, above said resistance at 1.0988 would confirm recent rise has resumed and extend further gain to another previous resistance at 1.1001, break there would signal the upmove from 1.0622 low (2016 low) is still in progress for headway to 1.1018, then 1.1050 but reckon resistance at 1.1107 would limit upside and price should falter well below 2016 high at 1.1129.
Recommendation: Hold long entered at 1.0905 for 1.1105 with stop below 1.0805.

The long-term downtrend started from 1.9626 (Apr 1985) to 1.4166 (Sep 1995) is treated as wave (A) with A:1.6285 (Dec 1987), B: 1.9342 (May 1992) and C: 1.4166, then wave (B) ended at 1.6828 with A: 1.7147 (Feb 1997), B: 1.4398 (Sep 2001), C: 1.6828 (Nov 2007), therefore, wave (C) is now in progress with the breakdown indicated as above. This wave (C) already met indicated downside target at 1.1455/60 and 1.1300, it could have ended at 0.8426, consolidation with mild upside bias is seen for gain to 1.1000 and later towards 1.2000.

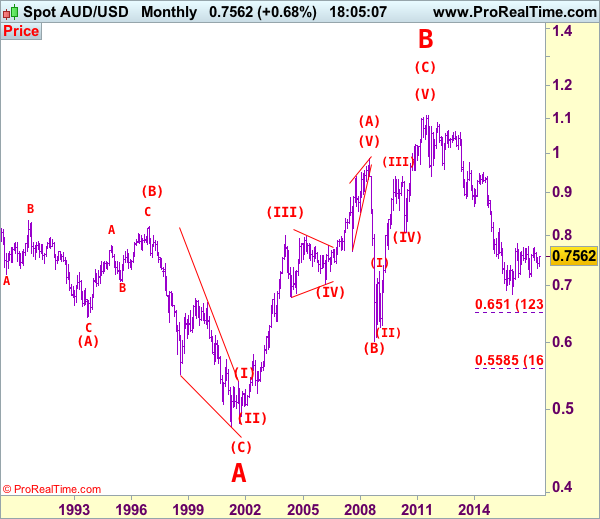
AUD/USD Elliott Wave Analysis
AUD/USD – 0.7559
AUD/USD – Wave 5 of C and (B) has possibly ended at 1.1081
As aussie has continued trading with a firm bias after recent strong rebound above previous resistance at 0.7518, adding credence to our view that the fall from 0.7750 has ended at 0.7329 and mild upside bias is seen for further gain towards resistance at 0.7611, however, break there is needed to retain bullishness and signal the fall from 0.7750 has ended there, bring further gain towards another previous resistance at 0.7680 but price should falter below said resistance at 0.7750.
We are keeping our count that top has been formed at 1.1081 (wave 5 of V) and major correction (A-B-C-X-A-B-C) has commenced, indicated downside targets at 0.7945 (61.8% Fibonacci retracement of entire rise from 0.6007-1.1081) and 0.7750 had been met and downside bias is seen for further weakness to 0.6800, then 0.6700 but reckon 0.6500 would hold from here.
Our preferred count is that the rally from 0.6007 to 0.7270 (7 Jan 2009) is marked as wave A, the retreat to 0.6248 (2 Feb 2009) is wave B and the subsequent upmove is labeled as wave C with wave (iii) and wave (iv) ended at 0.8265 and 0.7700 respectively and wave (v) as well as 3 ended at 0.9407, then wave 4 ended at 0.8066 (instead of 0.8578). The wave 5 has met our indicated projection target of 1.1060 and could ended at 1.1081, this level is now treated as the peak of wave (C) as well as larger degree wave B, hence major fall in wave C has commenced, our initial downside target at psychological support at 0.7000 has just been met and further weakness to 0.6500 would be seen later.
On the downside, whilst pullback to 0.7500 cannot be ruled out, reckon downside would be limited to 0.7455-60 and bring another rise later. Only below support at 0.7415 would abort and suggest top is possibly formed, bring weakness towards said strong support at 0.7372 which is likely to hold from here. Looking ahead, a break below this support is needed to signal the rebound from 0.7329 has ended and revive bearishness for retest of this level later.
Recommendation: Turn long at 0.7470 for 0.7670 with stop below 0.7370.

Our alternate count on the daily chart treated the top formed in 2008 at 0.9851 could be a larger degree wave I and was followed by a deep and sharp correction in wave II to 0.6007 and wave III is unfolding from there.
The long-term uptrend started from 0.4775 (2 Apr 2001) with an impulsive structure. Wave I is labeled as 0.4775 to 0.9851 (15 Jul 2008), wave II has ended at 0.6007 (Oct 2008) and wave III is still in progress which may extend further gain to 1.1265.
Technical Outlook: Cable – Extended Recovery Tests Daily Cloud Top
Cable remains at the front foot and extends recovery in early Wednesday's trading, testing key barriers at 1.2793 (daily cloud top / 55SMA). Fresh acceleration higher on extended profit-taking was boosted by bullish Outside Day pattern which was formed on strong rally on Tuesday. The pair may extend corrective rally on sustained break above 1.2793/1.2806 resistance zone (which includes daily Tenkan-sen at 1.2806) towards next pivots at 1.2841/47 (daily Kijun-sen/Fibo 61.8% of 1.2977/1.2638). The pair is awaiting today's events, UK jobs data (jobless claims are expected to rise in May, while average earnings and unemployment rate are forecasted unchanged) and the outcome of FOMC policy meeting as well as Thursday's UK Retail Sales and results of BOE MPC meeting for fresh signals.
Res: 1.2793, 1.2806, 1.2847, 1.2882
Sup: 1.2738, 1.2695, 1.2638, 1.2622
Currencies: Can Fed Put A Floor For The Dollar?
Sunrise Market Commentary
- Rates: Market moving towards the Fed?
If the Fed holds on to the blueprint of its rate path and communicates about the start of the balance sheet run-off in H2 2017, it should confirm last week's technical bottoming out on US yield markets (failed tests 5-y (1.69%), 10-yr (2.17%) and 30-yr (2.82%) and could start a new up-leg in yields. - Currencies: Can Fed put a floor for the dollar?
Today's Fed decision might decide how the recent USD stalemate will be broken. The market is positioned for a soft Fedmessage. If the Fed sticks to its normalization approach, there might be room for a USD rebound. The sterling self-off eased yesterday after higher UK inflation data. Some further GBP rebound is possible, but we don't expect the move to go far.
The Sunrise Headlines
- Asian equities were mixed this morning, with solid gains in Australia and New Zealand offset by China, where markets weakened despite data showing resilience in retail sales (+10.7%) and industrial output (+6.5%).
- The dollar holds on to its two-day decline as traders seek clarity on US Fed's policy plans for further tightening and for balance sheet unwinding after today. Markets expectations on a rate hike today are at 97%
- WTI oil price fell to trade near $46 after the American Petroleum Institute said U.S. oil stockpiles increased last week.
- UK PM Theresa May is under growing pressure to abandon the hard Brexit as she tries to get a deal with the Northern Ireland's DUP. Time pressure is rising as negotiations with the EU are due to begin next Monday.
- Schaeuble and Macron yesterday both stated a reversal of Brexit is possible during entire negotiating period.
- Attorney general Sessions testified to lawmakers that he had not colluded with Russia during the '2016 presidential campaign. He also refused to elaborate on conversations with Trump concerning this issue and the Comey-firing.
- The main event on the eco-calendar today is the Fed's policy meeting. For the US, the CPI and retail sales are major releases,… but the timing ahead of the FOMC may dampen reactions.
Currencies: Can Fed Put A Floor For The Dollar?
Dollar discounting too much Fed softness?
Yesterday, USD/JPY gained only a few ticks as global equities recovered from the tech correction and as core bond yields rose a few basis points. EUR/USD held a tight range close to and mostly just north of 1.12 as there was little news to give direction and as investors awaited the Fed . EUR/USD finished the day at 1.1211. USD/JPY closed at 110.07.
Overnight, Asian indices are trading mixed despite yesterday's WS rebound. China underperforms, despite Chinese close to expectations. Oil struggles not to fall back to the recent lows (Brent at $48.30). USD/JPY is holding a tight range near 110. EUR/USD is going nowhere in the 1.12 area. Bank of Canada Governor Poloz said that the rate cuts have done their job, reinforcing the short squeeze of the CAD. USD/CAD dropped to the low 1.32 area.
Today, the US eco calendar is well filled. CPI Inflation (0.0% M/M and 2.0% Y/Y) and retail sales (0.1% M/M headline) are expected modestly. A negative surprise, especially in inflation, may cause some nervousness going into the FOMC decision and be a slightly USD negative intra-day. However, investors are unlikely to start a strong directional move just hours before the FOMC decision. The Fed will raise its policy rate by 25 bps. Markets will scrutinize the Fed rate cycle outlook (new dots), the Fed plans to reduce the balance sheet and the press conference of Fed's Yellen. (see fixed income part). A softening in the Fed stance is not excluded, but the median dot seem robust for 2017/18 and some risks exists for a slightly lower 2019 median. Markets might see the dots moving in the direction of the markets as a potential repeat of the 2015/16 scenario. Even so, our basic hypothesis is that both interest rate markets and the dollar discounted already enough Fed softness. We don't expect a sharp comeback of the dollar, but the Fed has to be surprisingly soft to trigger sustained USD losses . We maintain the working hypothesis that a break of EUR/USD above Trump highs (1.1300/66) remains difficult. Such a scenario might also be slightly supportive for USD/JPY. However, the yen was well bid of late. The reaction of equities is a wild card (will the Fed give some kind of soft warning on equity valuations?). Markets might also be cautious ahead of Friday's BOJ decision. We remain cautious on the USD/JPY upside
Technical picture
The USD/JPY rally ran into resistance in early May. A mini sell-off pushed the pair below the previous top (112.20), making the short-term picture negative and driving the pair further down in the 108.13/114.37 range. At the end of last week, the USD/JPY decline slowed, but there is no convincing sign of a U-turn yet. Early May, EUR/USD failed to break below the 1.0821/1.0778 support (gap). Poor US data and US political upheaval propelled EUR/USD north of the 1.1023 range top. The pair reached a short-term correction top at 1.1268. There was a minor break after disappointing US payrolls, but no sustained follow-through gains occurred. The Trump top/correction top at 1.1300/1.1366 is next resistance. USD sentiment will have be very negative to clear this hurdle. A return below 1.1023 would indicate that the upside momentum has eased.
EUR/USD: Will topside be better protected after Fed decision?
EUR/GBP
Sterling sell-off slows, at least temporary
Sterling selling eased yesterday. Political uncertainty remains high, but the battle for Theresa May's political survival became less aggressive than it was over the previous days. Sterling started a bottoming-out process. Mid-morning, UK inflation (May) rose more than expected, from 2.7% to 2.9%. UK bond yields rose and sterling slightly regained ground. EUR/GBP dropped below 0.88 and closed the session at 0.8790. Cable rebounded to the mid 1.27 area.
UK labour market data will be published today. They will be overshadowed by political developments. Wage date might still have some impact on sterling. Especially soft AHE might convince markets that it will be very difficult for the BoE to raise rates anytime soon. On the political scene, May still tries to find support for a minority government. She also faces a growing number of calls for a soft Brexit, showing internal problems within her own conservative party. The political Gordian knot isn't solved yet. Yesterday, we indicated that the pressure on sterling might temporary ease, but the picture remains fragile.
From a technical point of view, EUR/GBP broke above 0.8774 resistance and tested the 0.8854 area (2017 top) on Friday. A real break didn't occur. A retest of that area is possible. A break beyond opens the way to the 0.90 area. A return below the 0.8655 correction low would be an indication that the pressure on sterling is easing.
EUR/GBP: first test of 2017 top rejected, but sterling remains in the defensive