
Sample Category Title
Daily Technical Outlook And Review: EUR/USD, GBP/USD, AUD/USD, USD/JPY, USD/CAD, USD/CHF, DOW 30, GOLD
A note on lower timeframe confirming price action...
Waiting for lower timeframe confirmation is our main tool to confirm strength within higher timeframe zones, and has really been the key to our trading success. It takes a little time to understand the subtle nuances, however, as each trade is never the same, but once you master the rhythm so to speak, you will be saved from countless unnecessary losing trades. The following is a list of what we look for:
- A break/retest of supply or demand dependent on which way you're trading.
- A trendline break/retest.
- Buying/selling tails ... essentially we look for a cluster of very obvious spikes off of lower timeframe support and resistance levels within the higher timeframe zone.
- Candlestick patterns. We tend to only stick with pin bars and engulfing bars as these have proven to be the most effective.
We typically search for lower-timeframe confirmation between the M15 and H1 timeframes, since most of our higher-timeframe areas begin with the H4. Stops are usually placed 1-3 pips beyond confirming structures.
EUR/USD
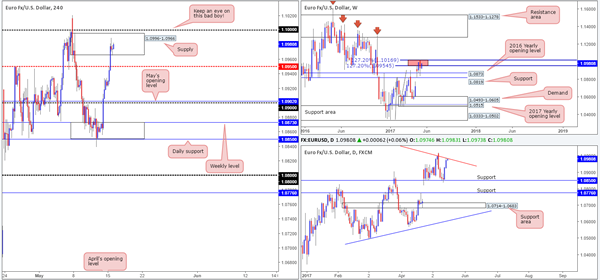
The US dollar, as you can see, continued to sag against the EUR during Monday's trade. The H4 candles easily cleared the mid-level hurdle 1.0950, and are now seen flirting with supply coming in at 1.0996-1.0966. While the bears have registered some interest within this boundary, we feel the large psychological handle 1.10 is far superior. Apart from this number likely being watched by the majority of the market, it not only sits within the upper limits of two weekly 127.2% Fib extensions at 1.1016/1.0954 (red zone) taken from the lows 1.0340/1.0493, it also converges closely with a daily trendline resistance extended from the high 1.1616.
Our suggestions: Since 1.10 was recently tested; it could very well have been weakened. For that reason, waiting for a reasonably sized H4 bearish rotation candle to form (preferably a full-bodied candle) is recommended before pulling the trigger. Should this idea come to fruition, we'd be looking to reduce risk to breakeven around the 1.0950ish region, and look to liquidate 50% of our position. 1.09 would likely be our final destination given how closely it's connected with the 2016 yearly opening level at 1.0873 (see weekly chart).
Data points to consider: EUR Flash GDP and German ZEW economic sentiment at 10am. US housing data at 1.30pm GMT+1.
Levels to watch/live orders:
- Buys: Flat (stop loss: N/A).
- Sells: 1.10 ([waiting for a reasonably sized H4 bear candle, preferably a full-bodied candle, to form before pulling the trigger is advised] stop loss: ideally beyond the candle's wick).
GBP/USD
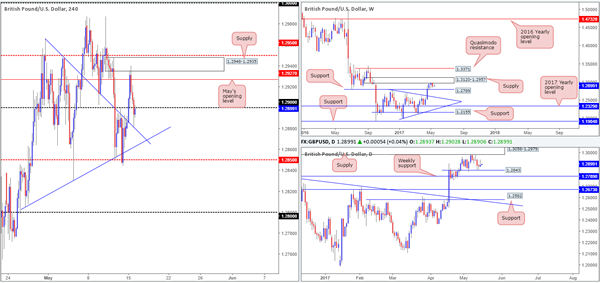
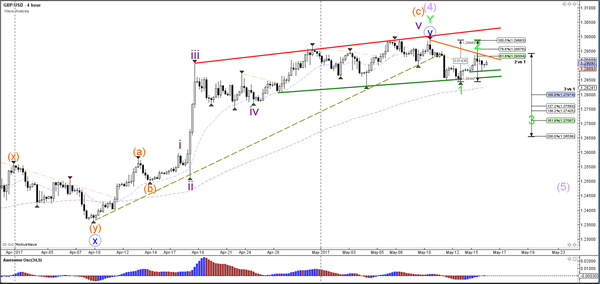
During the course of yesterday's sessions, we saw the GBP push higher in early trading. The H4 candles whipsawed through May's opening level at 1.2970 and connected beautifully with supply penciled in at 1.2948-1.2935. It was here that upside momentum began to diminish, forcing the unit to end the day closing back below the 1.29 handle and test a trendline support taken from the high 1.2965.
Over on the bigger picture, weekly action is currently lurking mid-range between supply at 1.3120-1.2957 and support marked at 1.2789. Meanwhile, daily price, after printing a rather substantial selling wick yesterday, is seen hovering above support at 1.2843.
Our suggestions: As far as H4 structure is concerned right now, we're somewhat restricted by the current H4 trendline support and the 1.29 handle. However, we still feel downside is the more favored route this morning. Given the response seen at weekly supply last week and daily price showing room to drive down to at least 1.2843, the H4 mid-level hurdle at 1.2850 will likely be the next barrier on the hit list.
At the time of writing, our team's focus remains on looking for a decisive H4 close beyond 1.2850/H4 trendline support. A close beyond this angle, followed with a retest as well as a lower-timeframe sell signal (see the top of this report for ideas on how to use the lower timeframes for entry) would, in our opinion, be enough confirmation to sell (intraday), targeting the 1.28 neighborhood (sits just above the aforementioned weekly support level).
Data points to consider: UK Inflation data at 9.30am. US housing data at 1.30pm GMT+1.
Levels to watch/live orders:
- Buys: Flat (stop loss: N/A).
- Sells: Watch for H4 price to engulf 1.2850 and then look to trade any retest seen thereafter ([waiting for a lower-timeframe sell signal to form following the retest is advised] stop loss: dependent on where one confirms this level).
AUD/USD
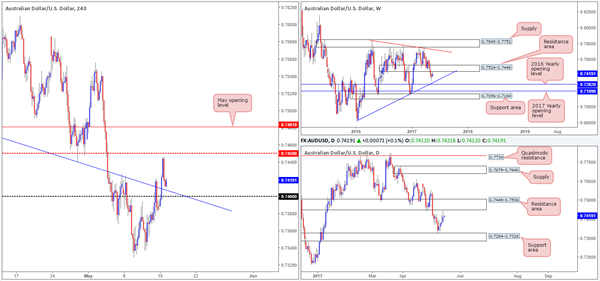
In recent trading, the Aussie H4 candles aggressively advanced higher and convincingly wiped out the trendline resistance extended from the low 0.7475. While this is considered a bullish cue on this scale, it's advised to remain cognizant of the overall picture here. The weekly timeframe shows price recently touched base with the underside of a resistance area at 0.7524-0.7446, which has been in motion since mid-2016. In addition to this, the daily timeframe also reveals that price came within touching distance of a resistance area at 0.7449-0.7506: essentially the same zone as the weekly area.
Our suggestions: Entering long on a retest of the current H4 trendline is attractive – even more so considering that it converges closely with the 0.74 handle. However, as tempting as this may be, we would feel incredibly uncomfortable buying this market knowing that we are trading nearby two higher-timeframe resistance areas, and, not to mention, that the overall momentum of this market has been southbound since Feb 2017. So, right now, we are more than happy to sit on the sidelines today.
Data points to consider: Australian Monetary policy meeting minutes at 2.30am. US housing data at 1.30pm GMT+1.
Levels to watch/live orders:
- Buys: Flat (stop loss: N/A).
- Sells: Flat (stop loss: N/A).
USD/JPY
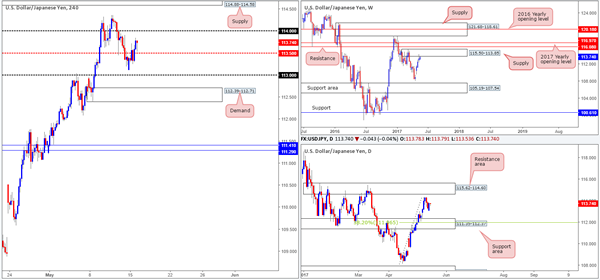
Kicking this morning's report off with a look-see at the weekly timeframe, we can see that the candles are currently kissing the underside of a supply zone drawn from 115.50-113.85. Should this area hold firm, the next downside target, apart from the weekly low of 108.13, is the support area coming in at 105.19-107.54. Daily price on the other hand, shows that the unit is trading mid-range between a resistance area at 115.62-114.60 and a support area at 111.35-112.37 (holds a 38.2% Fib support at 111.96 marked from the low 108.13).
Over on the H4 chart, price reclaimed the mid-level hurdle 113.50 yesterday and has therefore likely opened up the path north to the 114 handle. 114, in our opinion, could be a zone to watch seeing as how it's positioned within the walls of the said weekly supply. With that being said however, there's a chance that the unit may trade beyond this number up to the supply zone at 114.88-114.58, since then we'd have not only the current weekly supply in play, but also the aforementioned daily resistance area as well (the H4 supply is glued to the underside of this daily zone).
Our suggestions: However tempting a short from 114 may be, we favor the H4 supply seen above it at 114.88-114.58 for shorts this week for reasons stated above in bold.
Data points to consider: US housing data at 1.30pm GMT+1
Levels to watch/live orders:
- Buys: Flat (stop loss: N/A).
- Sells: 114.88-114.58 ([given the higher-timeframe confluence surrounding this zone, a trade from here without additional confirmation is valid] stop loss: 114.90).
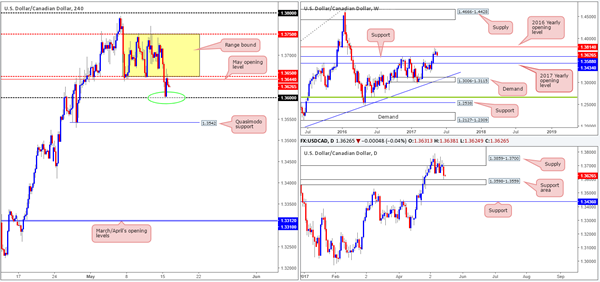
USD/CAD
The ongoing rally seen over in the oil market has forced the USD/CAD to break below the current H4 range between 1.3750/1.3650 and come within a few pips of the 1.36 handle. As highlighted in Monday's report, 1.36 was extremely attractive for longs considering that it merged closely with the top edge of a daily support area at 1.3598-1.3559 and nearby weekly support coming in at 1.3588. Well done to any of our readers who managed to net some green pips here!
The bounce from 1.36, however, is struggling to expand. Not only do we have the underside of the current H4 range in motion at 1.3650, we also have May's opening level at 1.3644. While we're reasonably confident that the H4 candles will eventually push back into the aforementioned range, it might not occur before seeing a deeper (fakeout) retest of 1.36. This would, of course, firmly bring the higher-timeframe supports into the action!
Our suggestions: Watch for H4 price to aggressively test the 1.36 boundary. A whipsaw of this number would be ideal! This would likely force H4 price back into the current range, and with a little bit of luck, touch the upper edge of the consolidation. Thus, the risk/reward here is rather attractive!
Data points to consider: US housing data at 1.30pm GMT+1.
Levels to watch/live orders:
- Buys: Watch for a fakeout of the 1.36 region (stop loss: ideally beyond the rejection candle's tail).
- Sells: Flat (stop loss: N/A).
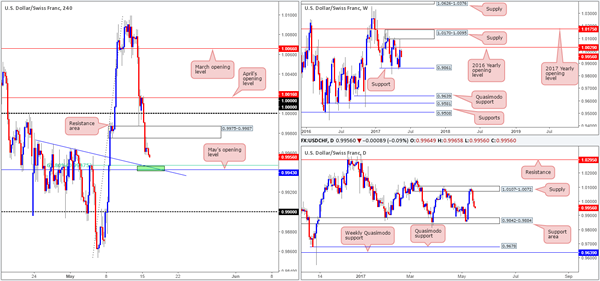
USD/CHF
With the EUR/USD recently clocking fresh highs, it was of no surprise to see the Swissy trading lower this morning. Parity (1.0000) did initially hold as support in the early hours of yesterday's segment, but gave way after H4 price failed to sustain gains beyond April's opening level at 1.0016. This, as you can see, found price breaking through demand at 0.9975-0.9987 and opening up downside to May's opening level at 0.9943 (merges with a trendline support taken from this high 0.9974 and a H4 61.8% Fib support at 0.9947 etched from the low 0.9853).
Both the weekly and daily charts show that further downside is likely upon us. The next downside hurdle in line is the daily support area coming in at 0.9842-0.9884, which happens to house weekly support at 0.9861 within its boundaries. Unfortunately, we missed the retest of the recently broken H4 demand, which was something our desk noted to keep an eye on!
Our suggestions: While we're expecting H4 price to bounce from the 0.9943 neighborhood today (green zone), we do not expect much more than an intraday move, since let's not forget that the higher timeframes indicate lower prices are likely. So, therefore, one could look to play the 0.9943 area today on the basis of the H4 confluence, but be sure to be aggressive with trade management and reduce risk as soon as possible. Personally, we do not see this unit bouncing higher than 0.9975: the underside of the recently broken H4 demand.
In the event that a decisive H4 close beyond the green H4 zone is seen, this would very likely open the runway down to the 0.99 handle, which is positioned a few pips above the said daily support zone! As a result, shorts could be an option should price retest 0.9943 as resistance.
Data points to consider: US housing data at 1.30pm GMT+1.
Levels to watch/live orders:
- Buys: Small bounce from the 0.9943 region is possible ([waiting for a lower-timeframe confirming signal to form is advised [see the top of this report] stop loss: dependent on where one confirms this area).
- Sells: Watch for H4 price to engulf 0.9943 and then look to trade any retest seen thereafter ([waiting for a reasonably sized H4 bearish candle to form following the retest is advised, preferably in the shape of a full-bodied candle] stop loss: ideally beyond the candle's wick).
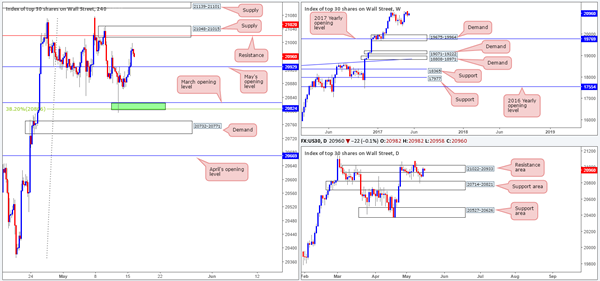
DOW 30
US equities climbed higher during Monday's segment in response to a rally in financial shares. This brought daily action back up to within the walls of a resistance area formed at 21022-20933. As we explained in Monday's analysis, this resistance zone, quite simply, looks worn out, as on two occasions we've seen the unit surpass its upper boundaries. This – coupled with weekly price showing the index lurking around record highs at 21170, we may eventually see this unit pop higher.
Swinging across to the H4 timeframe, we have May's opening level seen below at 20929 which may provide support in this market today. To the upside, there's the supply barrier coming in at 21048-21015 that intersects nicely with resistance at 21020.
Our suggestions: Entering long at May's opening level, although upside is slightly favored right now, would be dicey. Buying into a daily resistance area, despite the overall trend pointing northbound, is just something we cannot permit. By the same token, shorting at the current H4 supply barrier, although it converges with resistance and is plotted nearby the said daily resistance area, is just too much of a risk for our team given the strength the buyers have shown since the beginning of the year. To that end, opting to stand on the sidelines may be the better path to take today.
Data points to consider: US housing data at 1.30pm GMT+1.
Levels to watch/live orders:
- Buys: Flat (stop loss: N/A).
- Sells: Flat (stop loss: N/A).
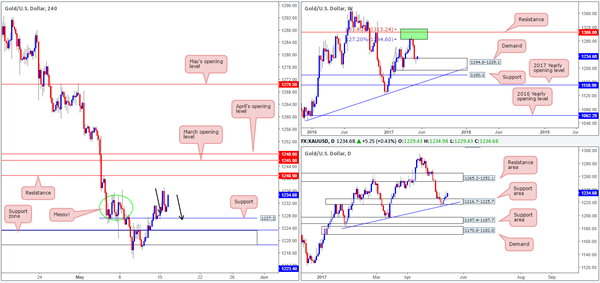
GOLD
As the dollar continues to pile lower, the yellow metal continues to make headway! H4 price marginally spiked above a rather messy area marked with a green circle at 1236.0/1228.0. This is a fantastic sign for the bulls, since not only is the market trading within a weekly demand pegged at 1194.8-1229.1, it is also trading nicely from a daily support area at 1216.7-1225.7 (strengthened by a trendline support extended from the low 1180.4).
Despite the market advertising bullish strength right now, there's a cautionary point to consider: the nearby H4 resistance positioned at 1240.9, followed closely by March/May's opening levels at 1245.9/1248.0.
Our suggestions: Right now, we do not see a strong enough level to base a long from unfortunately. What would be ideal, however, is if the H4 candles printed a 1:1 correction (see black arrows) from current price down to support at 1227.2. A trade from this area would, as long as it was supported by a reasonably sized H4 bull candle (preferably a full-bodied candle), be somewhere our desk would look to go long from and target the above noted H4 resistances.
Levels to watch/live orders:
- Buys: 1227.2 region ([waiting for a reasonably sized H4 bull candle, preferably a full-bodied candle, to form before pulling the trigger is advised] stop loss: ideally beyond the candle's tail).
- Sells: Flat (stop loss: N/A).
Daily Technical Analysis: EUR/USD Bullish Momentum Versus 78.6% Of Wave-2
Currency pair EUR/USD
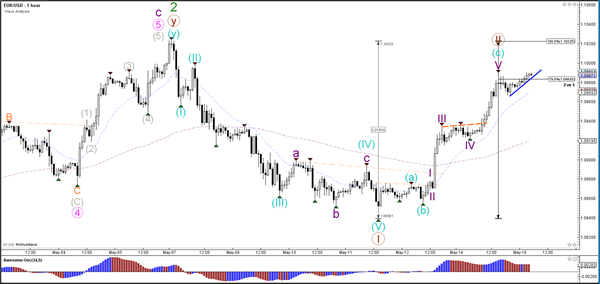
The EUR/USD is challenging the 78.6% Fibonacci level of wave 2 (brown) and the round resistance level of 1.10. A bearish reversal could complete wave 2 (brown) and start a wave 3 whereas as bullish break above the 100% level would invalidate wave 2.
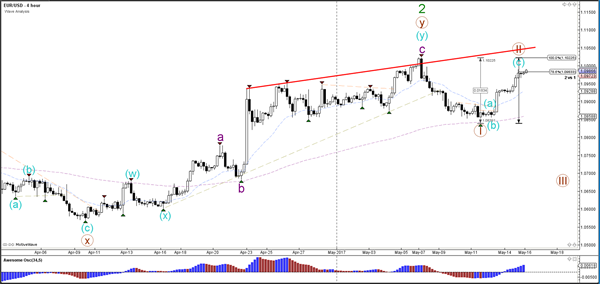
The EUR/USD could be building an ABC (blue) zigzag within wave 2 (brown) if price stays below the 100% level.
Currency pair USD/JPY
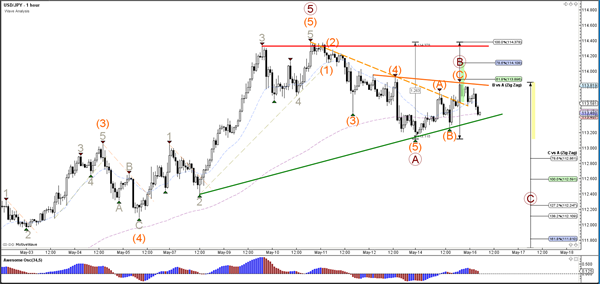
The USD/JPY is struggling to break above the resistance Fibonacci levels of wave B (brown) because the bearish break below support (dotted blue) could indicate the start of a larger bearish ABC correction (brown).
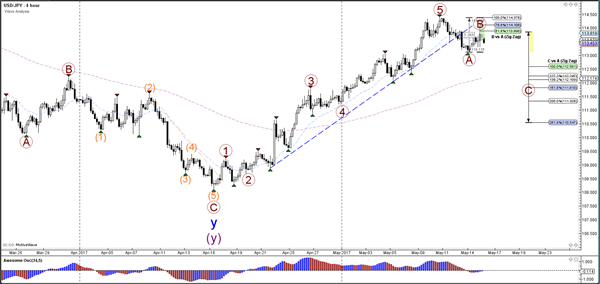
The USD/JPY will need to break below the support trend line (green) before a wave C (brown) continuation becomes more likely. A break above resistance (orange) could see price challenge the 78.6% Fib.
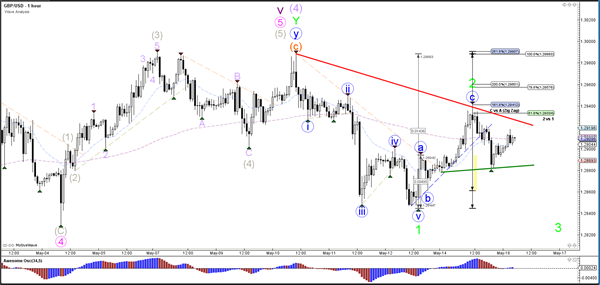
Currency pair GBP/USD
The GBP/USD stopped at the 61.8% Fibonacci level of wave 2 (green). A break below the support trend lines (green) could start a larger bearish correction whereas a break above resistance (orange) could see price testing the 78.6% Fib.
The GBP/USD break above the 100% Fib invalidates the wave 2 (green) structure.
Market Morning Briefing: The Combination Of Weaker Than Expected
STOCKS
Dow (20981.94, +0.41%) could test immediate horizontal resistance near 21200 in the coming sessions before coming off to lower levels near 20800. Near term expected to remain sideways.
Dax (12807.04, +0.29%) is trading near resistances seen on the 3-day and Weekly candles. If that holds, we may expect a corrective dip in the coming sessions. Else there could be some sideways movement for 2-3 sessions before testing 13000 on the upside.
Shanghai (3068.50, -0.70%) came back to lower levels after testing 3080 on the upside, indicating that the bears could possibly dominate the price action for the coming sessions. In that case, an immediate recovery may not be on the cards and we could expect a fall towards 3045 in the near term.
Nikkei (19876.27, +0.03%) looks bullish in the longer term. The current sideways movement within 20010-19700 could be there for a few more sessions before the index finally shoots up towards 20250 and higher.
Nifty (9445.40, +0.47%) is not willing to see any downside correction now and seems to be in a rather consolidation mode within 9400-9500, where immediate support and resistance levels are seen near 9350 and 9500 respectively. Looking at the longer term charts, it looks bullish but we need price confirmation on a break above 9500.
COMMODITIES
Recent weakness in Dollar index had boosted Bullion near their key resistance areas. Gold (1234) is trading above its support of 1230. Recent trading range could be 130-1260. We will remain bearish on gold while it is trading below 1260 but chances of a short term bounce back towards its interim resistance can't be ruled out.
We were expecting a bounce back in Silver towards 16.90 levels since 11th May onward as the scrip was highly oversold and yesterday Silver (16.63) made a intraday high of 16.73. Current trading range could be 15.70-16.90. The bias will remain bearish while silver is trading below 17.50 levels.
Copper (2.52) has found resistance at 2.54 levels. Only above 2.55, higher resistances of 2.60 can come into consideration. In the medium term 2.44 are going to be a strong support now but a close below that could open up 2.40-35 leves as well.
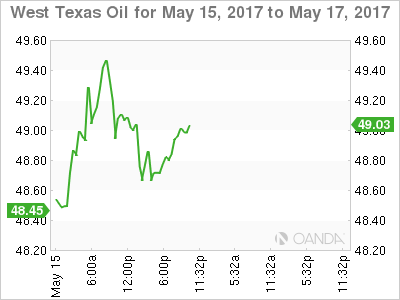
Brent (52.01) and WTI (49.04) both had moved higher in line with our expectation. They are within their trading ranges of 51-52.80 and 47.15-49.31 respectively. We have U.S weekly crude inventory tomorrow at 8:00 pm which could help to determine the future path but the bias will remain bearish while Brent and WTI are trading within 53 and 51 levels respectively.
FOREX
The combination of weaker than expected US macro data and the increasing possibility of political stability returning in Europe keeps the G-10 majors strong against the Dollar. Rupee rallies on the back of encouraging inflation and IIP data (new series).
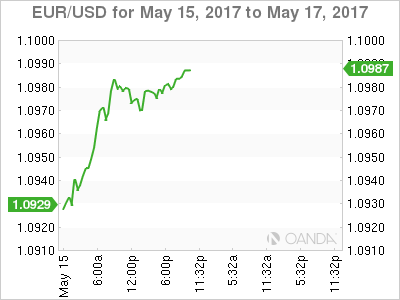
Euro (1.0985) is close to the old resistance of 1.10 once again on the back of a surprise win for the German Chancellor Merkel's party which suggests a possible easing of political risks. The break above the interim resistance of 1.0950 has boosted the chances of a rise above 1.10, bringing 1.1130-1.1200 into consideration. EURJPY (124.64) managing to sustain above 1.24.10-00 would be beneficial for the general strength of Euro.
A break above 1.10 for Euro may weaken Dollar Index (98.82) considerably, which has already tested our support of 98.85 and a successful Euro breakout may push Dollar down towards the long term support of 98.00.
Dollar Yen (113.43) has been holding above the immediate support of 113.10 for the last 2 sessions but the chances of sideways consolidation in the range of 113-115 or a silghtly broader range of 112-115 must be considered now.
Pound (1.2907) continues trading sideways in the range of 1.2800-1.3000 as expected and it may go on for another couple of sessions. With the medium term trend still up, a retest of the interim support of 1.2840-30 by the end of the week may trigger a sharp bounce.
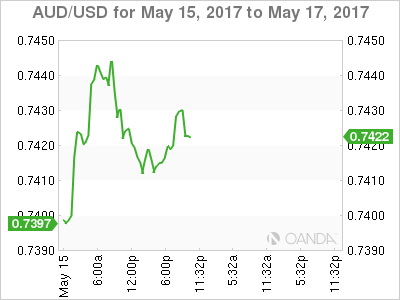
Aussie (0.7411) tried but failed to rally above the resistance of 0.7425 once more. The larger downtrend is expected to resume for the target/support of 0.7300-0.7290 any day now as the weakness persists below 0.7500 which may cap any short covering rally.
Dollar Rupee (64.06) has broken and closed below the support of 64.25 to signal fresh downside momentum. It is Oversold in the near term, and it may take some time to break below 64.00-63.90. Once the break happens, of course, further decline towards 63.50 will come into picture.
INTEREST RATES
The German yields are almost stable near resistance levels and could come off in the near term while the US yields are stable near previous levels.
The UK yields have bounced a bit looks overall bearish for the longer term. The 10-5Yr UK differential is moving up and could test levels near 0.69% before coming off sharply.
The 10 Yr GOI yields (6.8065%) has come off in line with our expectation as the resistance near 7% has held well so far. The yield could come down towards 6.75% in the coming sessions before bouncing back to higher levels.
The Japan yields have broken above immediate resistances on the 10Yr (0.05%) and the 5Yr (-0.11%). Both the 5Yr and the 10Yr looks bullish for the near term.
Oil-Oil Is The Word
Oil-Oil is the Word
The risk-off tone that was consuming early trade yesterday gave way to a wave of investor optimism seemingly taking solace from Chinese President Xi's Global infrastructure pledge and world oil markets which rocketed higher on the OPEC supply cut extension news. The Russian and Saudi plan to extend production cuts until the end of Q1 next year that was the real showstopper resulting in a massive rally on Crude and dragging energy producing stocks along for the ride.Global equities optimism soared with China markets touching March highs, European stocks extending their post-French election rally, Tokyo was up on weaker Yen, and US equity indices continued their march toward record territory
The oil patch news overshadowed yesterday's China data trifecta, which saw all the headlines miss market expectations. Growth in industrial production slowed to 6.5% you from 7.6%, retail sales slowed to 10.7% yoy from 10.9% you, and fixed asset investment slowed to 8.9% yoy from 9.2% yoy previously. Both commodity and regional markets would have traded softer on the China data miss, but investors were willing to overlook this soft patch as yesterday's WTI gusher topped $ 49.60 per barrel a backed by China's infrastructure pledge
Amidst all the Oil Patch optimism, shale oil producers indeed capped overnight momentum when the US Department of Energy came out with a forecast that US shale production would increase by 122,000 barrels per day, next month. WTI dropped to $48.95/b where it closed and has consolidated in early Asia. I suspect we have not seen the last of the shale gang as ongoing concerns over the clash of OPEC and. Shale will continue as near-term battle lines get drawn
Australian Dollar
Commonwealth currencies continued squeezing higher overnight benefiting from surging crude prices. While the highly oil correlated Canadian dollar is taking up much of the highlight reel, the Aussie did manage to consolidate its gains above the .74 handle as the massive Oil price rally underpinned global commodity prices in general. Relatively strong overnight session for the Aussie, but this picture looks all too familiar, so I expect the market to be very cautious and on guard for a significant AUD short squeeze
While specs have been tentatively fading the overnight AUDUSD moves, convictions are not very strong. With the US Treasury yields mired in range trade mentality, and a June US rate hike all but priced in, it comes down to a near-term commodity play for the Aussie with Commonwealth dealers overly focused on oil prices.
Nevertheless, today's RBA minutes and Thursdays employment data will be this week's national focal point.
The market was in short cover mode entering the RBA statement as WTI started ticking higher, but as for the RBA , while it was highly unlikely the RBA would provide us with a significant shift in deliberation, and on cue, the Australian Central Bank steers steady the policy course, so back to the commodity watch.
But Thursday's employment report will be closely watched to see if the recent string buoyant employment reports extends. Another robust print would have investors discounting early year weakness which could see the Aussie move toward the .75 handle
Euro
The Euro had and inspiring session amidst the risk-friendly environment.While there was an absence of EU data, equity inflow and a market-friendly outcome for Angela Merkel in the critical state of North Rhine-Westphalia has been moderately Euro supportive. But overall the US dollar is still sensitive from Friday's US data disappointment and given that there is little more than second tier US economic data on this weeks calendar the US dollars response could be weak, and there may be further downside to playing out.
EM Asia
With Oil driving sentiment and underpinning commodities, emerging market was back in focus rallying on both higher commodity prices and buoyant risk sentiment.
The local view is certainly joyous on the back of President Xi's Global infrastructure pledge, but traders are also taking note of the Pboc Q1 Monetary Policy Report which should ease some of the angst around Mainlands interest rate policy. While mainland administrators are dogged about deleveraging the speculative elements within the financial system, credit to the real economy is not a concern and had not slowed, apparently
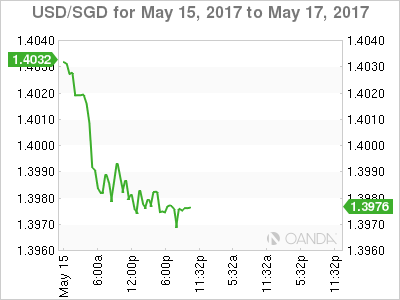
The two highlight currencies overnight were the SGD and KRW. The SGD closed below major support of 1.4000 and consolidated around 1.3975 awaiting the next USD catalyst
USD/CAD Testing Support While Still Inside Bullish Channel
Just another support/resistance level working in both directions for traders to manage their risk around, this time on USD/CAD.
Take a look at the level highlighted on the daily chart below:
USD/CAD Daily:
I've removed the USD/CAD bullish channel because it's obviously trending upward, and the only thing that matters right now is the horizontal level.
Keeping in mind that we want to always be trading in either the direction of the higher time frame level, or in this case the massive daily bullish trend. As you can tell, we are starting to paint a picture as to why we should be looking at getting long.
Depending on how aggressive you are as a trader, you have a multitude of levels to choose to manage your risk around across all time frames.
USD/CAD Canadian Dollar Higher After Oil Jump On OPEC Deal Extension
The Canadian dollar started the week on a good note regaining some lost ground versus the US dollar. The loonie traded higher on Monday after Saudi Arabia and Russia backed an extension of the oil production cut agreement. The Organization of the Petroleum Exporting Countries (OPEC) made a deal with other major producers last year and started cutting in 2017. The deal was for only six months, but not an extension taking it to March 2018 has been backed by Russia. The Canadian dollar has a correlation of 0.75 with oil prices.
The surge in oil prices took place at the same time that the US dollar is failing to get traction after political turmoil after U.S. President Donald Trump fired FBI director Commey. In Canada the Home Capital Group story is getting less play as even the Bank of Canada (BoC) Governor said the problems are contained. Resale prices were 1.7 percent lower in April according to the Canadian Real Estate Association in what could be a sign that prices are finally cooling in Canada with listings growing by 36 percent in the same month in the Greater Toronto Area. Listing were up 10 percent nationally also pointing to a shift from a sellers to a buyers market.
The USD continues to have the support of the U.S. Federal Reserve. Fed members kept talking up the chances of more rate hikes this year. They market is pricing in a 73.8 percent probability of a rate hike in June according to the CME’s Fedwatch tool. Economic data has been mixed with the latest retail sales and inflation numbers released on Friday disappointed by not meeting forecasts, but are still moving in the right direction.
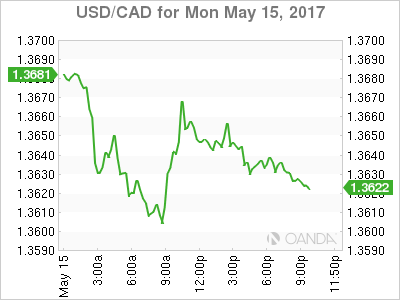
The USD/CAD lost 0.483 percent on Monday trading. The price of the currency pair is trading at 1.3646 after comments from Russia and Saudi Arabia boosted the price of crude. The Canadian dollar has faced an uphill battle in 2017. The combative tone of the Trump administration towards NAFTA and trade imbalances with the US has put the loonie under pressure. Oil prices have struggled to break free of the downward pressure caused by lack of demand and ramping production from non-OPEC members like the US and Canada. Interest rates are expected to keep going higher in the US while the Bank of Canada (BoC) is not anticipated to hike rates until 2018 leaving a growing gap between the two that will favour the USD.
The currency went below the 1.37 price level, but in order to continue appreciating versus the USD, the CAD has to find additional support from economic fundamental. The releases later this week of retail sales and inflation data will be crucial to guide the direction of the Canadian dollar.
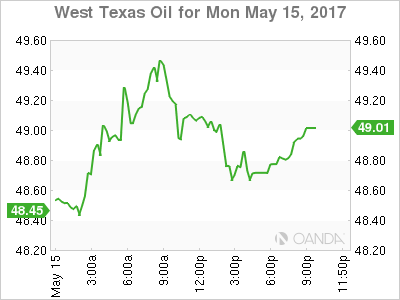
The price of energy surged 2.832 percent on the last 24 hours. West Texas is trading at $49.06 following the OPEC deal comments. The apparent deal between Russia and Saudi Arabia to extend the OPEC deal into 2018 is a huge shot in the arm for crude prices that have struggled with stagnant demand and increasing production from US shale producers.
Russian participation was a question mark as the six month deal is near the end. Private companies had to meet the Russian Minister of Energy as the first six months of the year are not as crucial as the second half. The weak dollar and the deal extension will keep crude in current levels until there are signs that demand is still soft as per the weekly US crude inventories to be released on Wednesday.
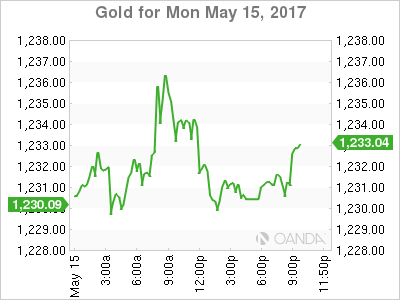
Gold rose 0.246 percent. The price of the yellow metal is trading at $1,231.05 after risk aversion triggered by the situation on North Korea and the political instability in the US have investors looking for a safe haven. The missile test in North Korea just after the Japanese PM had praised the Trump administration for its handling of the situation has made gold more attractive to investors looking for safety.
Commodities in general were higher after China added $100 billion to its infrastructure spending
Market events to watch this week:
Sunday, May 14
6:45 pm NZD Retail Sales q/q
10:00 pm CNY Industrial Production y/y
Monday, May 15
9:30 pm AUD Monetary Policy Meeting Minutes
Tuesday, May 16
4:30 am GBP CPI y/y
8:30 am USD Building Permits
6:45pm NZD PPI Input q/q
Wednesday, May 17
4:30 am GBP Average Earnings Index 3m/y
8:30 am CAD Manufacturing Sales m/m
10:30 am USD Crude Oil Inventories
9:30 pm AUD Employment Change
9:30 pm AUD Unemployment Rate
Thursday, May 18
4:30 am GBP Retail Sales m/m
8:30 am USD Unemployment Claims
Friday, May 19
8:30 am CAD CPI m/m
8:30 am CAD Core Retail Sales m/m
Don’t Count Out OPEC
Not all markets are equal and while it's tempting to doubt OPEC, the oil market has a way of breaking the rules. The Canadian dollar was the top performer Monday on a rally in crude while the yen lagged. Kuroda speaks later. A new Premium Video will be posted ahead of the Tuesday London session.
Oil ministers from Saudi Arabia and Russia sent crude prices nearly $2 higher on Monday by saying they hoped to extend the current quotas until March 2018. An extension to year end had been generally expected and there were rumours of a longer or larger production curb so it wasn't entirely a shock but it certainly provided a jolt.
Along with crude rising, USD/CAD dropped to 1.3600 from 1.3675. Then disappointment set in, crude and CAD both cut the moves in half. The temptation is to now bet against OPEC. They've shown their hand so when the moves come it shouldn't be a surprise.
But we're reminded of two big previous OPEC announcements. The most-recent one was on November 30 when OPEC first announced a supply cut agreement. By the time it was announced it had already leaked and been rumored for at least a week. And yet when the headlines finally hit, oil jumped. The gains continued in the next two weeks as crude climbed more than 10%.
It's not the first time that oil waited for the official OPEC word before moving. In December 2015 OPEC left quotas unchanged. It was even less of a surprise and had been wholly telegraphed. Yet crude fell a whopping 5% that day and a total of 33% by mid-January.
It could be that oil hedgers wait until the official announcement before they pull the trigger. It could be something else, but there is enough history to show that betting on something being 'priced in' to oil is a risk.
The OPEC meeting is May 25.
In the near-term, the Asia-Pacific calendar is generally light but it's punctuated by an appearance from Kuroda at a WSJ meeting at 0455 GMT. USD/JPY above 113.00 is close to the BOJ's sweet spot so he may avoid commentary on the yen.
Gold Steady Against Dollar, Markets Await Construction Reports
Gold has ticked higher in the Monday session. Currently, spot gold is trading at $1229.85 in the North American session. On the release front, the Empire State Manufacturing Index disappointed with a reading of -1.0, short of the forecast of 7.2 points. On Tuesday, construction numbers will be in focus, with the release of Building Permits and Housing Starts.
US numbers ended on the week on a mixed note. US consumer spending and inflation numbers fell short of estimates. CPI came in at 0.2%, short of the estimate of 0.3%. Core CPI, which excludes the most volatile items, posted a small gain of 0.1%, shy of the estimate of 0.2%. Retail Sales came in at 0.3%, compared to the forecast of 0.5%. Retail Sales rose 0.4%, short of the estimate of 0.6%. There was better news from consumer confidence, as the strong reading of 97.7 beat the forecast of 97.0 points. These numbers underscored a troubling trend where strong consumer confidence has failed to translate into increased consumer spending.
Donald Trump's firing of FBI director James Comey has stunned lawmakers and set off a political firestorm in Washington. Trump has been accused of triggering a constitutional crisis and undermining the rule of law. Comey had been conducting an investigation into possible collusion between Trump and Russia during the presidential campaign, so predictably, Comey's dismissal has raised suspicions that Trump is trying to impede the investigation by firing Comey. The crisis could heat up further, with calls in Congress to appoint an independent investigator into Trump's connections with Russia. This latest political storm has yet to shake up the markets, but a prolonged crisis could paralyze Washington and delay Trump's agenda of tax reform and increased fiscal spending.
Sterling Edges Higher, Markets Eye UK CPI
GBP/USD has posted slight gains in the North American session. In North American trade, GBP/USD is trading slightly above the 1.29 level. On the release front, there are no British economic events. Prime Minister Theresa May will take part in a Facebook Q&A session. In the US, the Empire State Manufacturing Index disappointed with a reading of -1.0, short of the forecast of 7.2 points. On Tuesday, the UK will release CPI and other inflation indicators. Over in the US, construction numbers will be in focus, with the release of Building Permits and Housing Starts.
All eyes are on British inflation indicators, which will be released on Tuesday. CPI, the primary gauge of consumer inflation, continues to move upwards, and the markets are expecting a strong gain of 2.6% in the April report. Last week, the BoE minutes indicated that if inflation is higher than predicted, it might have to respond by raising interest rates. The BoE stated in its minutes that it expected living standards to drop, as it downgraded its forecast for average earning growth to 2%, down from 3% in February. On the inflation front, the BoE raised its projection for inflation in Q1 to 2.7%, compared to 2.4% in February. According to the central bank, these forecasts were based on a "smooth" Brexit (which is by no means guaranteed, especially with the bad blood between the EU and Prime Minister Theresa May).
US numbers ended on the week on a mixed note. US consumer spending and inflation numbers fell short of estimates. CPI came in at 0.2%, short of the estimate of 0.3%. Core CPI, which excludes the most volatile items, posted a small gain of 0.1%, shy of the estimate of 0.2%. Retail Sales came in at 0.3%, compared to the forecast of 0.5%. Retail Sales rose 0.4%, short of the estimate of 0.6%. There was better news from consumer confidence, as the strong reading of 97.7 beat the forecast of 97.0 points. These numbers underscored a troubling trend where strong consumer confidence has failed to translate into increased consumer spending.
Donald Trump's firing of FBI director James Comey could have been viewed as yet another controversial move by the temperamental president, but the firing has set off a political firestorm in Washington. Trump has been accused of triggering a constitutional crisis and undermining the rule of law. Comey had been conducting an investigation into possible collusion between Trump and Russia during the presidential campaign, so predictably, Comey's dismissal has raised suspicions that Trump is trying to impede the investigation by firing Comey. The crisis could heat up further, with calls in Congress to appoint an independent investigator into Trump's connections with Russia. This latest political storm has yet to shake up the markets, but a prolonged crisis could paralyze Washington and delay Trump's agenda of tax reform and increased fiscal spending.
European Elections Dominate Euro Performance
- Sterling strengthens again after Bank of England statement
- European elections dominate Euro performance
- Disappointing data and rising oil prices weaken the US Dollar
- Chinese Inflation fails to fell commodity currencies
Pound picks up despite mixed signals
Despite the negativity coming from the Bank of England's UK growth downgrade and the release of lukewarm manufacturing and industrial sector data, the Pound has picked up, following an initial fall. We are expecting Retail Inflation, Employment and Retail Sales data this week, with a mixed bag of forecasts, so there is more volatility in store for Sterling throughout the week. Keep a close eye on the Pound's performance against its key currency partners over the coming days.
Elections dominate European focus
Election activity is the key focus for Europe and the Euro right now, with the spotlight on Germany. The success of Angela Merkel's party in North Rhine-Westphalia could be positive for the Euro, as the chance that Merkel will retain her chancellorship could give the Euro and the Eurozone a little confidence boost. Otherwise, there is little data expected this week, except the latest Eurozone Gross Domestic Product (GDP) figures and European Central Bank (ECB) Minutes.
USD-Euro one to watch...
Rising oil prices have taken their toll on the US Dollar, following further oil production restrictions. However, a member of the Federal Reserve hinted that there would be another two interest rate increases in 2017, which served to balance the USD's fortunes.
There is not a huge amount of data to come out of the US this week, other than Housing and Industrial Production results. The EUR-USD rate will be one to watch over the coming days and weeks.
China and the commodity currencies
The Australian and New Zealand Dollars were largely unaffected by muted Chinese Inflation data, but there will be a number of Australian and New Zealand data releases this week, which may have an impact.
Canadian Dollar could weaken if forecasts correct
Towards the end of this week, we will get the Canadian Retail and Inflation figures, predicted to be poor, and this could have a negative effect on the Canadian Dollar. If you are selling or planning to sell Canadian Dollars, it would be a good time to assess your risk and look to protect your rate by trading before the data is released or making use of a Stop Loss Order or Forward Contract. Speak to your currency consultant for further guidance.