Sample Category Title
GBP/JPY Daily Outlook
Daily Pivots: (S1) 145.94; (P) 146.46; (R1) 147.25; More....
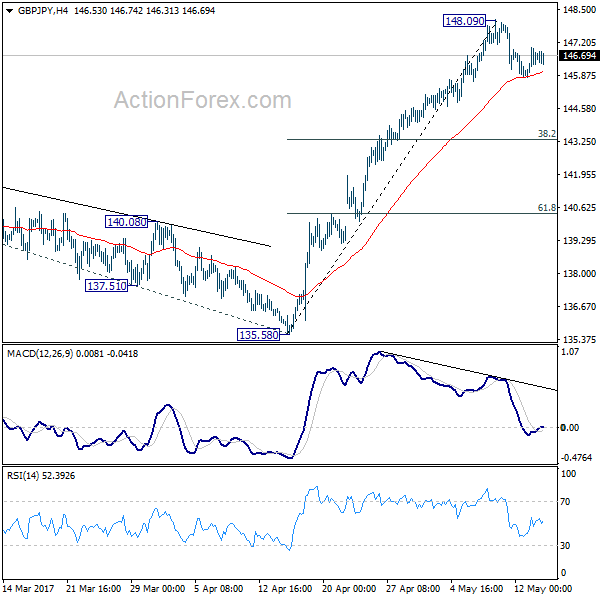
GBP/JPY is still bounded in consolidation below 148.09 short term top. Intraday bias remains neutral for the moment and deeper pull back cannot be ruled out. But in that case, we'd expect downside to be contained by 38.2% retracement of 135.58 to 148.09 at 143.31 and bring rise resumption. Break of 148.42 resistance will target 150.42 long term fibonacci level first. Break there will pave the way to 100% projection of 122.36 to 148.42 from 135.58 at 161.64.
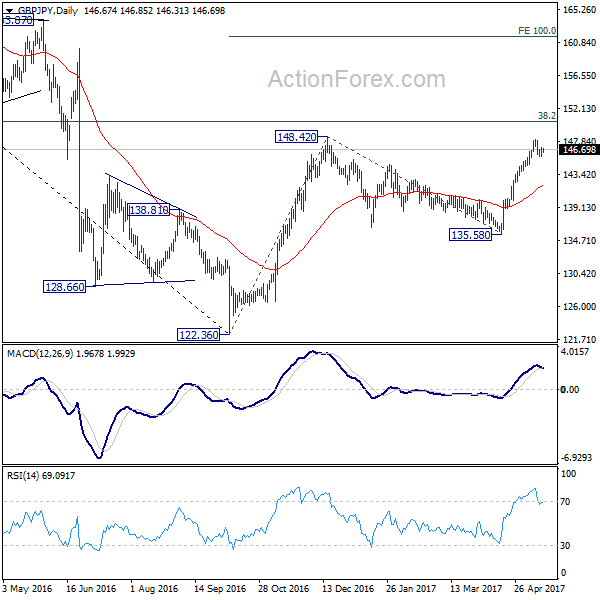
In the bigger picture, based on current momentum, rise from 122.36 bottom should be developing into a medium term move. Break of 38.2% retracement of 195.86 to 122.36 at 150.42 should pave the way to 61.8% retracement at 167.78. This will now be the favored case as long as 135.58 support holds.
RBA Minutes Pack Few Surprises
The minutes of the latest RBA policy meeting contained no surprises and more or less reflected the meeting statement. There was little in the minutes to suggest that there may be a change in policy anytime soon, which is consistent with our view that the RBA is likely to keep its powder dry in the foreseeable future. Given that we got no new information with regards to the Bank's forward guidance, the Australian dollar moved little at the release. Perhaps the most noteworthy point in the minutes was that officials remain worried about the labor and housing markets. Given the Bank's focus on the labor market, we think that the next major market mover for the Aussie is likely to be the employment report for April, due out during the Asian morning Thursday. Besides Australian data, we think that much of AUD's forthcoming direction is also likely to be decided by the path of iron ore prices, investors' risk sentiment, as well as incoming Chinese data, considering Australia's heavy trade exposure to the world's second largest economy.
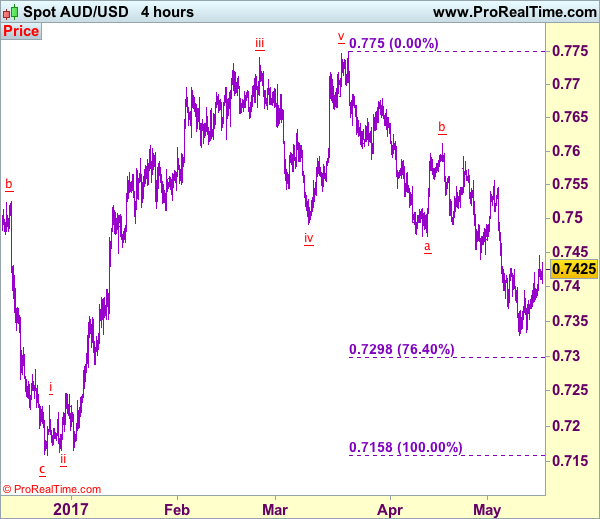
AUD/USD traded lower yesterday ahead of the minutes, and moved little on their release. Given that the rate is still trading below the downtrend line taken from the peak of the 30th of March, we believe that the short-term trend remains negative. Nevertheless, we see the possibility for the pair to turn up again and continue correcting north. A break above 0.7450 (R2) could confirm the case and is possible to open the way for a test near the crossroad of the 0.7490 (R3) hurdle and the aforementioned downtrend line. The catalyst for more upside corrective extensions may be Thursday's employment data, where the net change in employment is expected to stay positive even following the previous month's remarkable surge.
Today's highlights:
During the European day, the main event will probably be the release of the UK CPI data for April. The forecast is for both the headline and the core rates to have risen notably, something supported by the nation's services PMI for the month, which indicated that service firms raised their prices charged at the fastest pace since 2008. Even though something like that could bring the pound under renewed buying interest, we stick to our guns that the Bank of England is likely to remain on hold in the foreseeable future should the data evolve more or less in line with its expectations. What's more, we think that sterling's forthcoming direction over the next weeks is likely to be decided primarily by news surrounding the upcoming General Election, rather than developments regarding monetary policy.
GBP/USD traded in a consolidative manner yesterday and during the early European morning Tuesday, it is trading near the 1.2900 (S1) barrier. Bearing in mind that the pair has been oscillating between the key support of 1.2850 (S2) and the psychological zone of 1.3000 (R2) since the 27th of April, we consider the short-term outlook to be neutral for now. Nevertheless, accelerating CPIs today could encourage the bulls to target the 1.2950 (R1) zone, where a decisive break may trigger extensions towards the round figure of 1.3000 (R2).
From Germany, we get the ZEW survey for May. The consensus is for both the expectations and the current conditions indices to have risen. This would probably be an encouraging development for ECB policymakers, as it could signify that the bloc's economic powerhouse continues to perform at a robust pace. We also get Eurozone's trade balance for March and the second estimate of Q1 GDP. From the US, we get building permits, housing starts, and industrial production, all for April.
We have only one speaker on the agenda: ECB Executive Board member Benoit Coeure.
AUD/USD
Support: 0.7400 (S1), 0.7375 (S2), 0.7330 (S3)
Resistance: 0.7430 (R1), 0.7450 (R2), 0.7490 (R3)
GBP/USD
Support: 1.2900 (S1), 1.2850 (S2), 1.2770 (S3)
Resistance: 1.2950 (R1), 1.3000 (R2), 1.3050 (R3)
GBP/USD Elliott Wave Analysis
GBP/USD – 1.2930
GBP/USD – Wave 4 is unfolding as an (A)-(B)-(C) and could have ended at 1.7192
Although the British pound eased after rising to 1.2991 earlier and minor consolidation below this level would be seen, reckon downside would be limited to 1.2830-35 and renewed buying interest should emerge above support at 1.2757, bring another rise later, above said resistance would confirm the erratic rise from 1.1986 low has resumed for retracement of medium term decline to psychological resistance at 1.3000, then 1.3050-55, however, loss of near term upward momentum should prevent sharp move beyond 1.3100 and price should falter below 1.3140-50 (38.2% Fibonacci retracement of 1.5018-1.1986), risk from there has increased for a retreat later.
Our preferred count on the daily chart is that cable's rebound from 1.3500 (wave (A) trough) is unfolding as a wave (B) with A ended at 1.7043, followed by triangle wave B and wave C as well as wave (B) has possibly ended at 1.7192, below support at 1.4232 would add credence to this count, then further fall to 1.4000 level would follow but reckon downside would be limited to 1.3655 support and price should stay above previous support at 1.3500.
On the downside, whilst initial pullback to 1.2830-35 cannot be ruled out, reckon downside would be limited to 1.2757 support and previous resistance at 1.2706 would turn into support and contain downside, bring another rise later. Only below previous resistance at 1.2616 (tentatively wave i top) would abort and suggest top is possibly formed, risk weakness to 1.2550-60 but break of 1.2500 support is needed to provide confirmation.
Recommendation: Buy at 1.2760 for 1.3000 with stop below 1.2660.
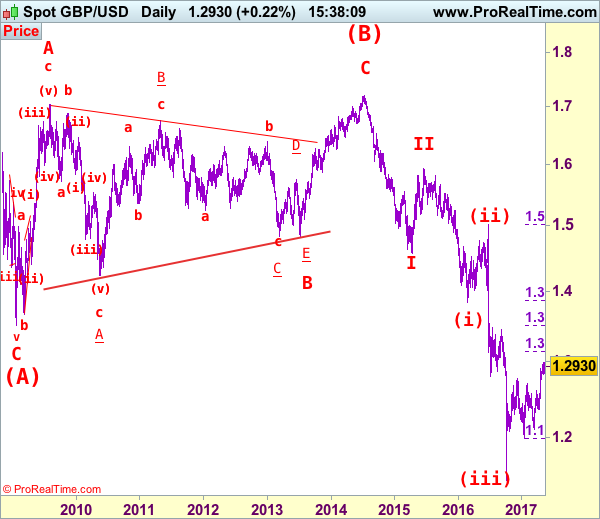
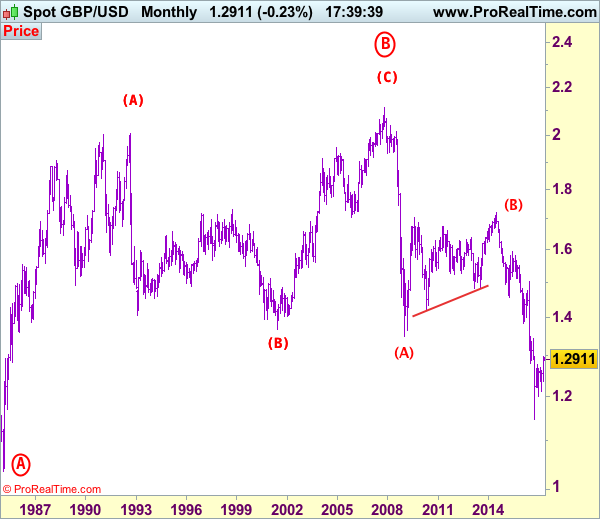
Longer term - Cable's rise from 1.0520 (Feb 1985) to 2.0100 (September 1992) is seen as [A], the decline to 1.3682 is labeled as (B) and (C) wave rally has ended at 2.1162 (9 Nov, 2007) which is also the top of larger degree wave B with circle. The selloff from there is a 5-waver with wave (A) ended at 1.3500 (23 Jan 2009), wave (B) itself is labeled as A: 1.6733, triangle wave B: 1.4813 and wave C as well as top of wave (B) ended at 1.7192 (2014), hence the selloff from there is an impulsive wave (C) with wave I : 1.4566, wave II 1.5930, an extended wave III is unfolding and already exceeded our downside target at 1.3500 and 1.3000, hence weakness to 1.2500 and possibly 1.2000 cannot be ruled out, however, price should stay well above psychological level at 1.0000.
Technical Outlook: Cable Is Steady Above 1.2900 Ahead Of UK Inflation Data
Cable regained strength and accelerated above 1.2900 handle in early European session on Tuesday, awaiting release of UK inflation data. Monday's pullback from upside rejection at 1.2938 was contained by rising 20SMA at 1.2879, keeping broader bullish bias intact. Daily bulls are back to full capacity on today's rally above 10SMA/daily Tenkan-sen (1.2915/08), signaling possible attack at psychological 1.3000 barrier for break above near-term 1.2830/1.2987 congestion. Annualized inflation for April is seen accelerating in April according to the forecast at 2.6%, compared to 2.3% in March, while monthly figure is expected to stay unchanged at 0.4%. Core CPI is also seen higher, as forecast for April lies at 2.2%, up from 1.8% in March. Release at forecasted levels or upside surprise would be supportive for sterling for probe above psychological 1.3000 and test of another strong barrier, base of thick weekly cloud, currently at 1.3032. On the other side, weaker than expected inflation numbers would put the pound under fresh pressure and risk break below pivotal support at 1.2830 (04 May low).
Res: 1.2946, 1.2986, 1.3000, 1.3032
Sup: 1.2915, 1.2889, 1.2877, 1.2843
EUR/JPY Daily Outlook
Daily Pivots: (S1) 124.04; (P) 124.46; (R1) 125.30; More...
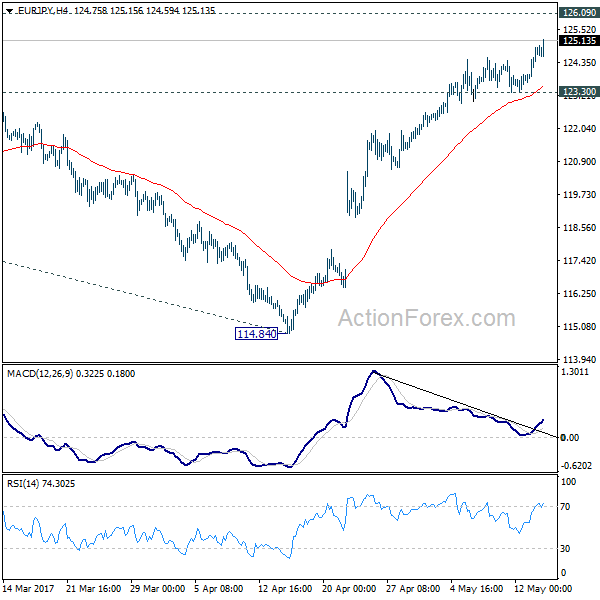
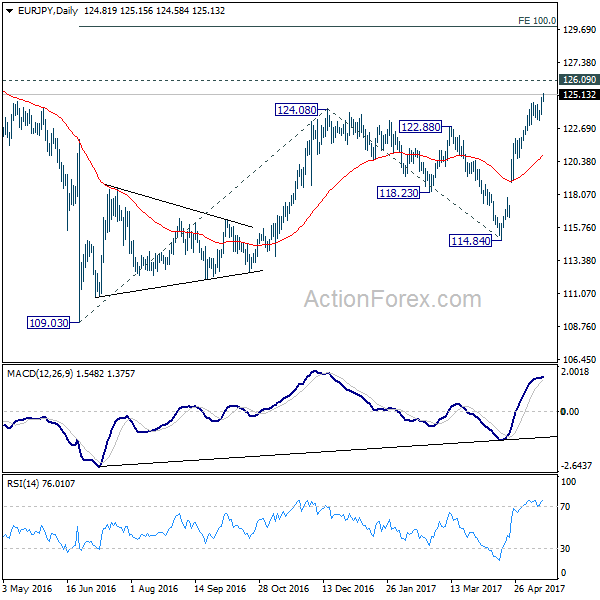
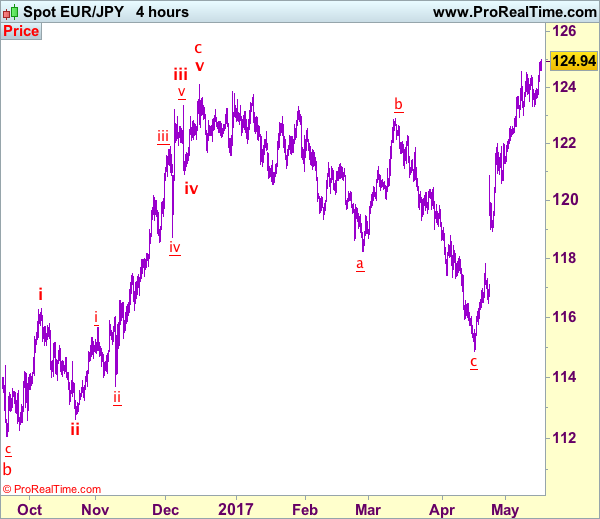
EUR/JPY's rally resumed by taking out 124.53 and reaches as high as 125.15 so far. Intraday bias is back on the upside. Current rise from 114.84 is part of the medium term rebound from 109.03 and should target 126.09 resistance first. Decisive break there will extend the rise to 100% projection of 109.03 to 124.08 from 114.84 at 129.89. On the downside, break of 123.30 support is needed to indicate short term topping. Otherwise, outlook will stay bullish in case of retreat.
In the bigger picture, focus is back on 126.09 support turned resistance. Decisive break there will confirm completion of the down trend from 149.76. And in such case, rise from 109.20 is at the same degree and should target 141.04 resistance and above. Meanwhile, rejection from 126.09 and break of 114.84 will extend the fall from 149.76 through 109.20 low.
Euro Surges Broadly With Optimism on the Economy, UK CPI Watched
While oil prices and Canadian Dollar took headlines, it's indeed the Euro that's the outstanding one in the early part of the week. The common currency resumed recent rally against dollar is back above 1.1 handle. Markets are getting more optimistic that subsiding political risks in the Eurozone clear up uncertainties over economic outlook. And recent solid economic data also pointing to better momentum in the recovery. If the developments continue, it's more likely that finally see the start of the end of ECB's stimulus after the current asset purchase program ends at the end of the year. But for sure, it's still too early to confirm anything, at least not before new staff economic projections from ECB to be published in June.
For now in short term, Euro is staying firm technically. EUR/USD took out 1.1020 to resume recent rise from 1.0339. Such rally is still seen as a correction, but there is room for more upside in near term for 1.1058 projection level. Outlook in Euro in crosses is actually more bullish. EUR/GBP's break of 0.8529 today confirms resumption of rise from 0.8312 and further rally should be seen to 0.8786/8851 resistance zone at least. EUR/JPY also resumed recent rise from 109.20 and should be target 126.09 resistance. EUR/AUD's is still kept below 1.4909 resistance but recent rise looks set to resume for 1.5094 resistance next.
BoJ Kuroda: Quite sure of enough tools for stimulus exit
BoJ Governor Haruhiko Kuroda said today that there "may be some challenging issues" regarding stimulus exit. But he is "quite sure" that the central bank has "enough tools" to manage it. Meanwhile, Kuroda also noted there will be lessons to be learned from Fed's normalization of policies. But he also emphasized that "the United States is the United States, Japan is Japan. At this stage, we're not exiting." There has been much concern over the size of BoJ's balance, in particular that it already took out 40% of JGBs in the markets. But Kuroda talked it down and said there are still 60% left and there won't be "any constraint" to the so called Yield Curve Control. Release from Japan, Tertiary industry index dropped -0.2% mom in March.
RBA Minutes: Reiterated concerns on housing and labor
The RBA minutes for the May meeting contained little news but reiterated policymakers' the importance of the property market and the labor market conditions in its policy decision. The stance to leave the monetary policy unchanged was obviously due to the perceived uncertain outlook in these two areas. As noted in the concluding statement in the minutes, 'the board continued to judge that developments in the labour and housing markets warranted careful monitoring'. More in RBA Reaffirmed Importance Of Housing And Labor Markets On Decision-Making, Defends The Trend Of Rising Part-Time Workers.
UK CPI a major focus today
Looking ahead, UK CPI is a major focus in European session. Headline CPI is expected to accelerate to 2.6% yoy in April. Last week's BoE meeting argues that the central bank will hold their hands before conclusion of Brexit negotiations. But we'd be eager to see how surging inflation reading would stretch MPC members' tolerance. UK will also release RPI, PPI and house price index. From Eurozone, GDP is expected to show 0.5% qoq growth in Q1. German ZEW economic sentiment and Eurozone trade balance will also be released. US will release housing starts and building permits, as well as industrial production later in the day.
EUR/JPY Daily Outlook
Daily Pivots: (S1) 124.04; (P) 124.46; (R1) 125.30; More...
EUR/JPY's rally resumed by taking out 124.53 and reaches as high as 125.15 so far. Intraday bias is back on the upside. Current rise from 114.84 is part of the medium term rebound from 109.03 and should target 126.09 resistance first. Decisive break there will extend the rise to 100% projection of 109.03 to 124.08 from 114.84 at 129.89. On the downside, break of 123.30 support is needed to indicate short term topping. Otherwise, outlook will stay bullish in case of retreat.
In the bigger picture, focus is back on 126.09 support turned resistance. Decisive break there will confirm completion of the down trend from 149.76. And in such case, rise from 109.20 is at the same degree and should target 141.04 resistance and above. Meanwhile, rejection from 126.09 and break of 114.84 will extend the fall from 149.76 through 109.20 low.
Economic Indicators Update
| GMT | Ccy | Events | Actual | Forecast | Previous | Revised |
|---|---|---|---|---|---|---|
| 1:30 | AUD | RBA Minutes | ||||
| 4:30 | JPY | Tertiary Industry Index M/M Mar | -0.20% | 0.10% | 0.20% | |
| 8:00 | EUR | Italian GDP Q/Q Q1 P | 0.20% | 0.20% | ||
| 8:30 | GBP | CPI M/M Apr | 0.40% | 0.40% | ||
| 8:30 | GBP | CPI Y/Y Apr | 2.60% | 2.30% | ||
| 8:30 | GBP | Core CPI Y/Y Apr | 2.30% | 1.80% | ||
| 8:30 | GBP | RPI M/M Apr | 0.40% | 0.30% | ||
| 8:30 | GBP | RPI Y/Y Apr | 3.40% | 3.10% | ||
| 8:30 | GBP | PPI Input M/M Apr | 0.00% | 0.40% | ||
| 8:30 | GBP | PPI Input Y/Y Apr | 17.00% | 17.90% | ||
| 8:30 | GBP | PPI Output M/M Apr | 0.20% | 0.40% | ||
| 8:30 | GBP | PPI Output Y/Y Apr | 3.40% | 3.60% | ||
| 8:30 | GBP | PPI Output Core M/M Apr | 0.20% | 0.30% | ||
| 8:30 | GBP | PPI Output Core Y/Y Apr | 2.50% | 2.50% | ||
| 8:30 | GBP | House Price Index Y/Y Mar | 5.30% | 5.80% | ||
| 9:00 | EUR | Eurozone Trade Balance (EUR) Mar | 18.8B | 19.2B | ||
| 9:00 | EUR | German ZEW (Economic Sentiment) May | 22 | 19.5 | ||
| 9:00 | EUR | German ZEW (Current Situation) May | 82 | 80.1 | ||
| 9:00 | EUR | Eurozone ZEW (Economic Sentiment) May | 29.1 | 26.3 | ||
| 9:00 | EUR | Eurozone GDP Q/Q Q1 P | 0.50% | 0.50% | ||
| 12:30 | USD | Housing Starts Apr | 1.26M | 1.22M | ||
| 12:30 | USD | Building Permits Apr | 1.27M | 1.27M | ||
| 13:15 | USD | Industrial Production Apr | 0.40% | 0.50% | ||
| 13:15 | USD | Capacity Utilization Apr | 76.30% | 76.10% |
GBP/JPY Elliott Wave Analysis
GBP/JPY – 144.85
GBP/JPY – Wave 5 as well as wave (III) has possibly ended at 116.85
As sterling has eased after rallying to 148.10 last week, suggesting consolidation below this level would be seen and pullback to 145.50-60 cannot be ruled out, however, reckon 144.65-75 would limit downside and bring another rise later, above said resistance at 148.10 would bring test of previous chart resistance at 148.55, however, break of this A leg top is needed to confirm early upmove from 120.50 low has resumed and extend gain to 149.00-10, then towards psychological resistance at 150.00 which is likely to hold on first testing.
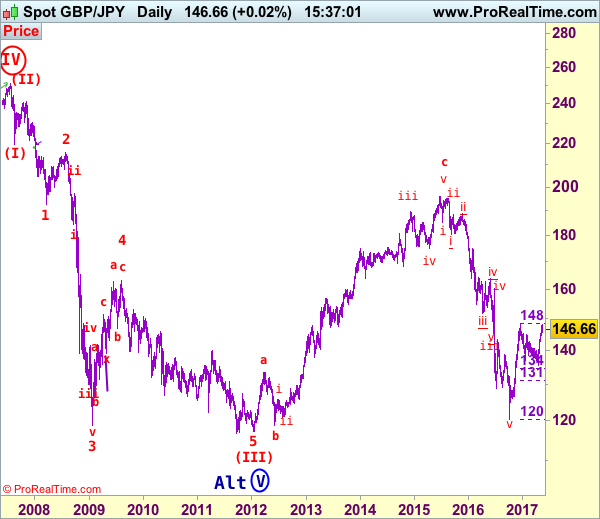
Our preferred count is that larger degree wave V with circle is unfolding from 251.12 with wave (I) 219.34, (II): 241.38 and wave (III) is subdivided into 1: 192.60, 2: 215.89 (23 Jul 2008) and wave 3 ended at 118.87 earlier in 2009. The correction from there to 162.60 is wave 4 which itself is a double three and is labeled as first a-b-c ended at 151.53, followed by wave x at 139.03, 2nd a ended at 162.60, 2nd b at 146.75 and 2nd c leg of wave 4 ended at 163.00. Therefore, the decline from 163.00 to 116.85 is now treated as wave 5 which also marked the end of larger degree wave (III), hence wave (IV) major correction has commenced for retracement of the wave (III) from 241.38 and upside target at 183.95-00 (50% Fibonacci retracement of the wave (II) from 241.38) had been met, a drop below 160.00 would suggest wave (IV) has ended at 195.85, bring decline in wave (V) for initial weakness to 130 (already met) and 120.
On the downside, whilst initial pullback to 145.50-60 is likely, reckon downside would be limited to 144.65-75 and bring another upmove later. Below 143.80 would defer and risk correction to 143.00 but downside should be limited to 142.30-35 and price should stay above previous resistance at 142.10-15, bring another rise later. Only a daily close below 142.10-15 would abort and signal top is formed instead, bring correction to 141.50, then 141.00 but price should stay above another previous resistance at 140.35 and bring another rise later.
Recommendation: Buy sterling at 144.70 for 147.70 with stop below 143.70.
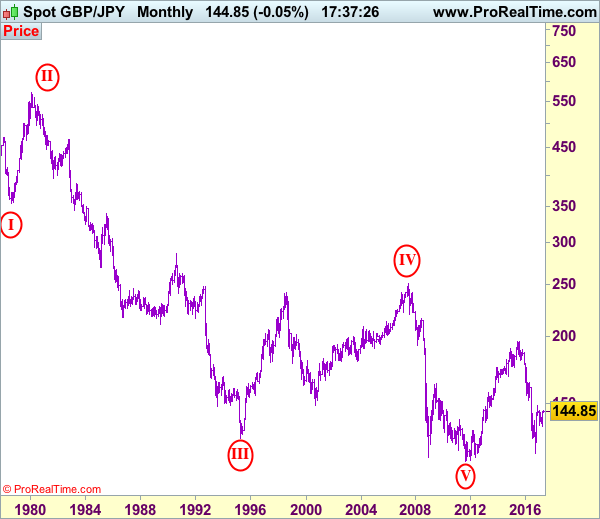
The long-term downtrend from 570.99 (29 Feb 1980) is labeled as an impulsive wave with III with circle ended at 129.77 (20 Apr 1995) and the corrective rebound to 251.12 (20 Jul 2007) is treated as wave IV with circle and the wave V with circle selloff from 251.12 has possibly ended at 116.80 (almost reached our indicated target at 116.00) and major correction has commenced from there and indicated upside target at 183.90-00 (50% Fibonacci retracement of 251.10-116.85) had been met, reckon upside would be limited to 199.80-90 (61.8% Fibonacci retracement) and bring wave (V) decline in later part of 2017.
Trade Idea: EUR/JPY – Stand aside
EUR/JPY - 125.05
Recent wave: wave v of (C) ended at 94.12 and major correction in wave A has ended at 149.79
Trend: Near term up
Original strategy:
Sold at 124.00, stopped at 124.55
Position: - Short at 124.00
Target: -
Stop: - 124.55
New strategy :
Stand aside
Position: -
Target: -
Stop:-
As the single currency has continued moving higher after breaking indicated resistance at 124.55, signaling recent upmove is still in progress and may extend further gain to 125.45-50, then 125.75-80, however, near term overbought condition should limit upside to 126.00-10 and price should falter below 126.50, risk from there has increased for a retreat to take place later.
In view of this, would not chase this rise here and would be prudent to buy euro on subsequent pullback. Below 124.55-60 would bring minor correction to 124.00-10 but downside would be limited to 123.60-65 and the single currency should stay well above support at 123.32, bring another rally later this week.
Our latest preferred count is that wave (ii) is ABC-X-ABC which ended at 123.33 and wave (iii) is unfolding with wave iii ended at 100.77, followed by wave iv at 111.57 and wave v as well as the wave (iii) has ended at 97.04, followed by wave (iv) at 111.43 and wave (v) has ended at 94.12 which is also the end of the larger degree v, this also implied the major wave (C) has also ended there, hence major correction has commenced from there with (A) leg unfolding in its lower degree wave c which has possibly ended at 145.69. Under this count, A-B-C wave (B) has commenced with A leg ended at 136.23, wave B at 143.79 and wave C has possibly ended at 149.79.
Our larger degree count is that the decline from 139.26 is wave (C) and is sub-divided into a diagonal triangle i-ii-iii-iv-v with wave i - 105.44, wave ii- 123.33, wave iii - 97.03, wave iv - 111.43, followed by the final wave v as well as the end of wave (C) at 94.12, this also mark the bottom of larger degree wave B. Under this count, major rise in wave C has commenced as an impulsive wave with minor wave III ended at 145.69, wave V is still in progress for further gain to 150.00. Having said that, this so-called wave V could well be the first leg of larger degree 5-waver wave C and this wave C should bring at least a retest of wave A top at 169.97 (July 2008).
Trade Idea: AUD/USD – Buy at 0.7370
AUD/USD – 0.7425
Recent wave: Wave 5 ended at 1.1081 and major correction has commenced for fall to 0.7000 and then towards 0.6500-10
Trend: Near term down
Original strategy :
Buy at 0.7300, Target: 0.7500, Stop: 0.7240
Position: -
Target: -
Stop: -
New strategy :
Buy at 0.7370, Target: 0.7520, Stop: 0.7320
Position: -
Target: -
Stop:-
Aussie’s rebound after falling to 0.7329 suggests a temporary low is possibly formed there and consolidation with mild upside bias is seen for further gain to 0.7470-75, then 0.7500-10 but break of latter level is needed to add credence to this view, bring subsequent rise towards resistance at 0.7556 which is likely to hold from here due to near term overbought condition.
In view of this, we are looking to buy aussie on dips as 0.7360-70 should limit downside. A break of said support at 0.7329 would abort and signal recent decline is still in progress for weakness to 0.7295-00 (76.4% retracement of 0.7158-0.7750), however, loss of downward momentum should prevent sharp fall below 0.7300 and reckon 0.7245-50 would remain intact, bring another rebound later.
On the 4-hour chart, the move from 0.8066 is the wave 5 with i: 0.8860, ii: 0.8315, wave iii is an extended move ended at 1.0183, iv: 0.9706 and wave v has ended at 1.1081 (also the top of entire wave 5). The subsequent selloff is the major correction which is unfolding as ABC-X-ABC and 2nd A leg has ended at 0.8848, followed by a-b-c wave B which ended at 0.9758, hence, 2nd C wave is now in progress and indicated downside target at 0.7000 and 0.6950 had been met, so further fall to 0.6710-20 cannot be ruled out.
NY Manufacturing Activity Declines, US Dollar Stays Subdued
The latest monthly manufacturing activity report released by the New York Fed yesterday showed that the Empire State Manufacturing index slipped into negative territory, posting a reading of -1.0. The data missed expectations of 7.2 and indicated a third consecutive month of decline after data rose to a two-year high at 18.7 in February.
Both new orders and shipments fell while the labor market indicators pointed to only a modest increase during the month of May. The US dollar index fell through the day which saw the EURUSD maintain the bullish momentum from last Friday. The ICE futures, US dollar index fell 0.3% to close at 98.91.
Looking ahead, the economic calendar today will see the inflation figures from France and Italy while the UK will be releasing the monthly inflation figures which suggest that consumer prices might have accelerated at a pace of 2.6% in April. The inflation data will be followed by flash GDP numbers from the eurozone.
From the US building, permits and industrial production numbers will keep the markets busy later in the afternoon.
EURUSD intraday analysis
EURUSD (1.0986): EURUSD maintained its bullish gains yesterday with theprice now within reach of testing the 1.1000 resistance level. However, the current gains are still seen as a retracement unless we see a strong breakout above 1.1000 region. This will potentially set the stage for further gains to the upside. However, in the event of a reversal near 1.1000 resistance level, we could expect EURUSD to slip back towards the support that was established at 1.0863 - 1.0854 level. A break down below this region will then confirm a move towards 1.0750 - 1.0740 region.
USDJPY intraday analysis
USDJPY (113.51): The USDJPY managed to maintain some bullish momentum yesterday, but the daily chart shows a hidden bearish divergence that has formed. This indicates that USDJPY could be looking to slide towards 112.50 in the near term where support could be established ahead of a renewed bullish momentum. On the 4-hour chart, resistance is seen holding up at 114.00 - 113.78 region which was tested once again yesterday. Thiscould possibly signal a move towards the support level at 112.50.
XAUUSD intraday analysis
XAUUSD (1233.44): Gold prices attempted to push higher yesterday, but price managed to rise to a 7-day high at 1237.26 before pushing back lower. The failure to post any pullback towards 1221.47 regionis, however, indicative that the rally cannot be sustained further unless gold prices break out higher above 1235.00 and establish support at one of the higher levels. Resistance is seen coming in at 1250.00 which remains the upside target, while to the downside, the declines could be limited towards 1221.47 - 1221.00 region.