Sample Category Title
USD/CHF Strong Weakness, USD/CAD Weakening, AUD/USD Pushing Higher Within Symmetrical Triangle.
USD/CHF Strong weakness.
USD/CHF continues to push lower after monitoring of resistance given at 1.0107 high (10/04/2017 high). Support is located at 0.9856 (23/04/2017 low). Expected to continue going lower.
In the long-term, the pair is still trading in range since 2011 despite some turmoil when the SNB unpegged the CHF. Key support can be found 0.8986 (30/01/2015 low). The technical structure favours nonetheless a long term bullish bias since the unpeg in January 2015
USD/CAD Weakening.
USD/CAD is declining declined after failing to reach 1.3800 before bouncing back. Hourly support can be found at 1.3411 (24/04/2017 high) then 1.3353 (20/01/2017 high). Expected to show bearish pressures as the pair remains broke support at 1.3530 (27/04/2017 low).
In the longer term, there is a golden cross with the 50 dma crossing the 200 dma indicating further upside pressures. Strong resistance is given at 1.4690 (22/01/2016 high). Long-term support can be found at 1.2461 (16/03/2015 low).
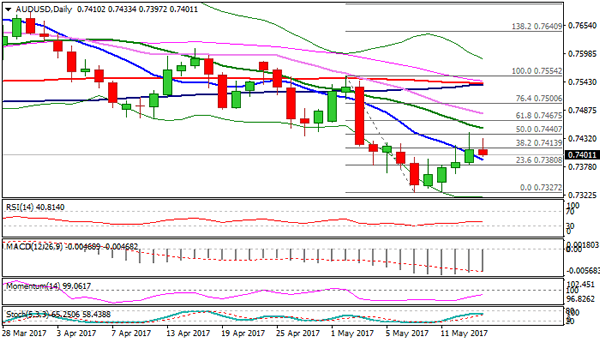
AUD/USD Pushing higher within symmetrical triangle.
AUD/USD has paused above key support at 0.7339 (intraday low). As long as prices remain below the resistance at 0.7608 (17/04/2017 high), the short-term technical structure is negative. Key resistance stands at 0.7681 (30/03/2017 high). Expected to show further weakness.
In the long-term, we are waiting for further signs that the current downtrend is ending. Key supports stand at 0.6009 (31/10/2008 low) . A break of the key resistance at 0.8295 (15/01/2015 high) is needed to invalidate our long-term bearish view.
Daily Technical Analysis: EURUSD, GBPUSD, USDJPY, USDCHF
EURUSD
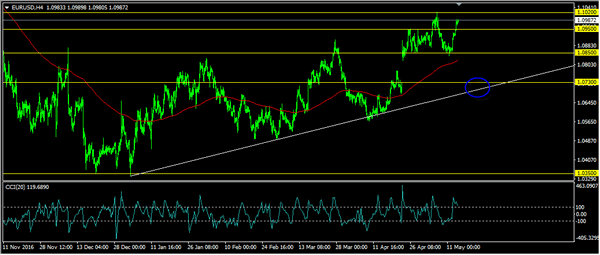
The EURUSD had a bullish momentum yesterday broke above 1.0950, topped at 1.0989. The bias remains bullish in nearest term testing 1.1020. A clear break and daily close above that area would expose 1.1120 region. Immediate support is seen around 1.0950. A clear break below that area could lead price to neutral zone in nearest term testing 1.0900 but key support remains at 1.0850. A clear break below 1.0850 could trigger further bearish pressure testing the pre-gap level at 1.0730 and the trend line support as you can see on my H4 chart below, which is a good place to buy. Overall I remain neutral.
GBPUSD
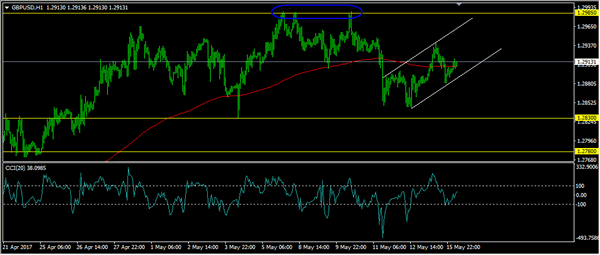
The GBPUSD was indecisive yesterday. The bias is neutral in nearest term. The triple top bearish scenario remains valid, but price is now moving inside a minor bullish channel as you can see on my H1 chart below after unable to break below 1.2830 support area. Immediate support is seen around 1.2885. A clear break below that area could trigger further bearish pressure testing 1.2830 but key support remains at 1.2780 which remains a good place to buy. Overall I remain bullish but need a clear break above 1.2985 to continue the bullish scenario.
USDJPY
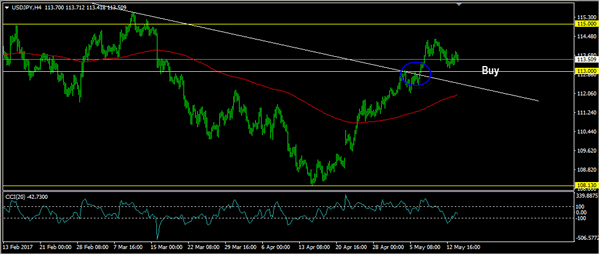
The USDJPY regained its bullish momentum yesterday topped at 113.85. The bias is bullish in nearest term testing 114.35. A clear break and daily close above that area would expose 115.00 region. Immediate support is seen around 113.40. A clear break below that area could lead price to neutral zone in nearest term testing 113.00 region which remains a good place to buy with a tight stop loss.
USDCHF
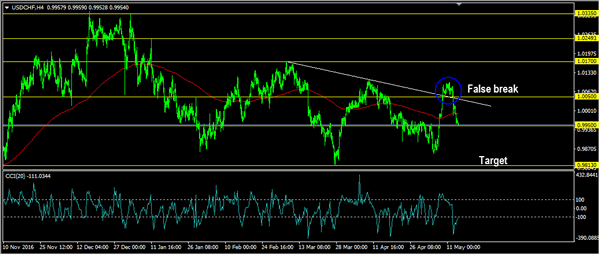
The USDCHF had a bearish momentum yesterday bottomed at 0.9957 and hit 0.9952 earlier today in Asian session. The bias is bearish in nearest term as a part of the false breakout bearish scenario as you can see on my H4 chart below, targeting 0.9813 region. Immediate resistance is seen around 0.9985. A clear break above that area could lead price to neutral zone in nearest term testing 1.0020 region. Overall I remain neutral.
Euro Punches Past 1.10 As Eurozone GDP Matches Forecast
The euro continues to gain ground in the Tuesday session, and EUR/USD is currently trading at 1.1040. On the release front, Eurozone Flash GDP climbed 0.5%, matching the forecast. German ZEW Economic Sentiment disappointed, as the reading of 20.6 fell short of the forecast of 22.3 points, There was better news from Eurozone ZEW Economic Sentiment, which jumped to 35.1, easily beating the forecast of 29.1 points. In the US, today's key events are Building Permits and Housing Starts. On Wednesday, the eurozone releases Final CPI, which is expected to rise to 1.9%.
Market forecasts for Eurozone growth were on the money, as Flash GDP came in at 0.6% in the first quarter of 2017. This figure was slightly higher than Preliminary GDP back in April, which showed a gain of 0.5%. The eurozone continues to show improved numbers in 2017, boosted in no small part by the German economy, which also expanded 0.6% in the first quarter. The well-respected ZEW Economic Sentiment surveys, which gauge optimism among investors and analysts, were a mixed bag for May. The German indicator improved to 20.6, short of expectations. What was more surprising was the unexpected jump from the Eurozone indicator, which improved to 35.1, its strongest level in almost two years. With the eurozone showing stronger growth, has inflation kept up? We'll get an indication on Wednesday, with the release of Eurozone Final CPI, which is expected to rise to 1.9%. Stronger inflation levels will increase pressure on the ECB to consider tapering its ultra-loose monetary policy. Germany, for one, is finding that ultra-low interest rates is hampering growth, and wants Brussels to adopt a tighter monetary policy.
Washington remains abuzz over Comeygate, which has put the Trump administration on the defensive. There was more bad news for President Trump on Tuesday, with a report in the Washington Post that Trump had shared confidential intelligence reports with Russia's foreign minister at a meeting last week. The White House has denied the report, but clearly damage control remains a top priority for Trump, and the euro has taken advantage, pushing past 1.10, as EUR/USD is trading at 6-month highs. The markets are concerned that Trump will be so busy trying to put out political firestorms, that his agenda of increased fiscal spending and tax reform will stall. This could send the dollar to lower levels as investors look for alternatives to investing in dollar assets
EUR/USD Bullish Breakout, GBP/USD Bullish Pressures, USD/JPY Consolidation Phase.
EUR/USD Bullish breakout.
EUR/USD is trading higher. Resistance at 1.1023 (07/05/2017 high) has been broken. Hourly support has been given at 1.0842 (11/05/2017 low). Strong support is now given at 1.0682 (21/04/2017 base) and key support can be found at 1.0494 (22/02/2017 low). Expected to continue growing higher.
In the longer term, the death cross late October indicated a further bearish bias. The pair has broken key support given at 1.0458 (16/03/2015 low). Key resistance holds at 1.1714 (24/08/2015 high). Expected to head towards parity.
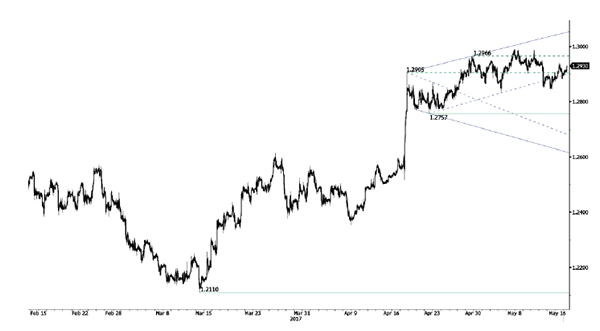
GBP/USD Bullish pressures.
GBP/USD is trading mixed. Hourly resistance is given at 1.2989 (07/05/2017 high). Hourly support can be found at 1.2757 (21/04/2017 low). An unlikely break of this support would indicate further weakness. Expected to push higher.
The long-term technical pattern is even more negative since the Brexit vote has paved the way for further decline. Long-term support given at 1.0520 (01/03/85) represents a decent target. Long-term resistance is given at 1.5018 (24/06/2015) and would indicate a long-term reversal in the negative trend. Yet, it is very unlikely at the moment.
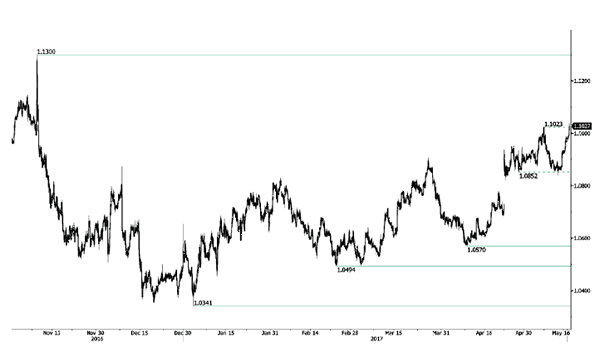
USD/JPY Consolidation phase.
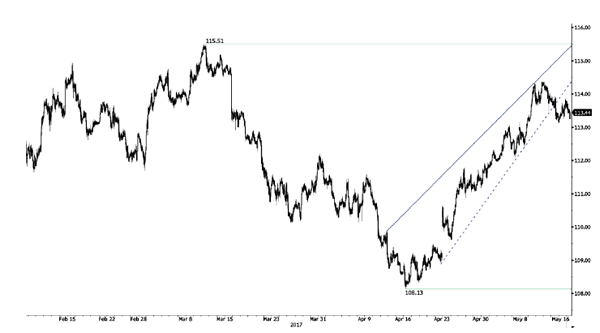
USD/JPY is pushing higher since the pair broke resistance given at 112.20 (31/03/2017 high). Hourly support can be found at 113.86 (11/05/2017 low). Stronger support is located at 108.13 (17/04/2017 low). Other key supports lie at a distant 106.04 (11/11/2016 low). Expected to show continued bullish pressures after this consolidation phase.
We favor a long-term bearish bias. Support is now given at 96.57 (10/08/2013 low). A gradual rise towards the major resistance at 135.15 (01/02/2002 high) seems absolutely unlikely. Expected to decline further support at 93.79 (13/06/2013 low).
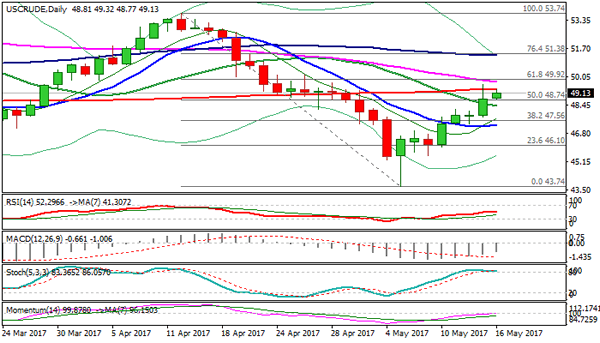
Technical Outlook: Oil Price May Extend Consolidation Before Final Attack At $50.00 Barrier
US oil is consolidating under Monday's fresh recovery high at $49.64 but holds strong bullish sentiment which was boosted by agreement for extended output cut. Tuesday's price action is holding above broken Kijun-sen line at $48.74 (also 50% of $53.74/$43.74 descend) above which the price managed to close on Monday after rally lost traction and stalled at $49.64, failing to sustain break above 200SMA at $49.34. Kijun-sen line offers strong support and immediate focus will remain shifted higher while the price is holding above it. However, today's price action is ranging between daily Kijun-sen and 200SMA ($48.74/$49.38) and extended consolidation could be expected while these boundaries hold. Also, slow stochastic is strongly overbought on daily chart and is turning lower that may generate negative signal for fresh easing. Break below $48.74 pivot would expose support at $48.25 (Fibo 23.6% of $43.74/$49.64) and $47.73 (Monday's low) and would delay final push through $50.00 target.
Res: 49.38, 49.64, 50.00, 50.39
Sup: 48.74, 48.36, 48.25, 47.73
Push & Pull: USD Pressure & EUR Strength
The Asian session saw equities climb to a fresh-two year high early on Tuesday on the back of an overnight rise in Wall Street fueled by reports that President Trump had disclosed classified information with the Russian Foreign Minister without necessary authorization from the source. This re-fueled the continued underlying uncertainties and reinforced doubts surrounding the Administration’s economic agenda. Oil continued extending extended gains following a pledge from the major producers Saudi Arabia and Russia to push for an extension of supply cuts into 2018.
EURUSD has broken the psychological 1.1000 level as a result of the likelihood of a shift in Eurozone economic policy for the second half of 2017. ECB Chief Economist Praet commented 'that the balances of risk would be assessed at the June meeting'. However, he also stated that 'the central bank would need to be very careful over removing policy accommodation'.
The dollar index continued lower trading around 98.55 with May’s low of 98.50 forming a slight support area. Per the latest CME Fedwatch; the expectations of a rate increase in June is now at a 73.8% probability compared to 84% last week.
With a degree of 'risk-on' sentiment gold has seen a slight rise from early May lows of $1214 to trade just above $1234.
Today sees the release of UK CPI at 9:30 BST; forecast at 2.6% from the last release of 2.3% and US Housing Starts at 13:30 BST; expecting a minimal gain from the previous release.
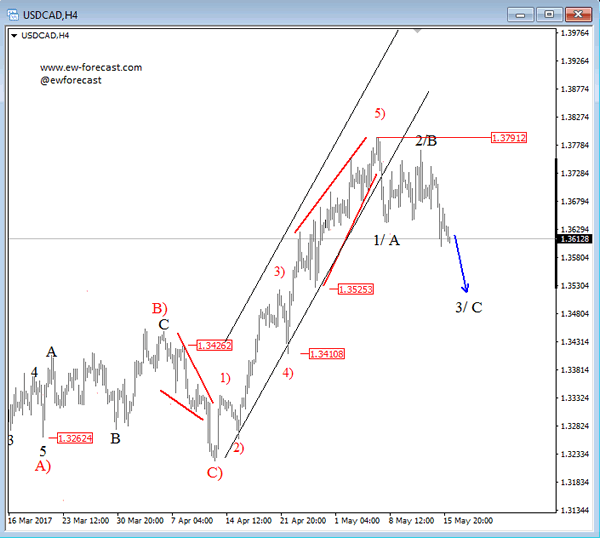
USDCAD Undergoing A Reversal
USDCAD made a sharp and swift move to the downside two weeks back after an ending diagonal formation in wave 5) that confirmed a top near 1.3790. A nice drop is now in play, currently in third wave of a decline that can be wave 3 or C, but in both cases there is room for 1.3525.
USDCAD, 4H
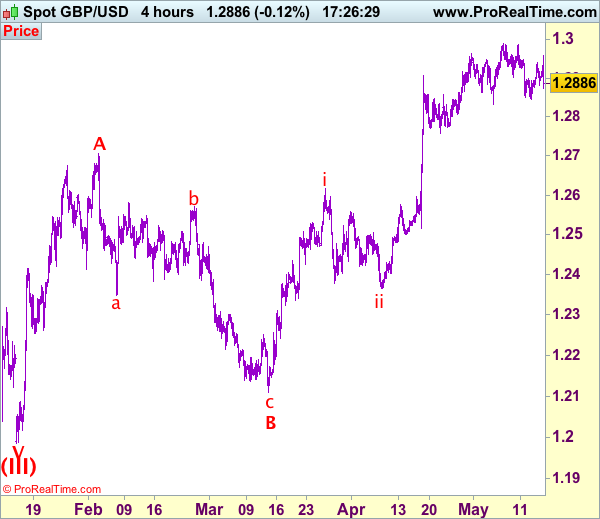
Trade Idea: GBP/USD – Sell at 1.2920
GBP/USD – 1.2887
Recent wave: Wave V of larger degree wave (III) has ended at 1.1986 and major correction has commenced from there for gain to 1.3000 and 1.3140-50
Trend: Near term up
New strategy :
Sell at 1.2920, Target: 1.2770, Stop: 1.2970
Position: -
Target: -
Stop:-
Although cable rebounded briefly to 1.2958, renewed selling interest emerged there and sterling has slipped again, suggesting the rebound from 1.2844 has ended, hence consolidation with downside bias is seen for test of 1.2844, however, break of previous support at 1.2831 is needed to signal temporary top has been formed at 1.2991 earlier, bring retracement of recent upmove to 1.2770-75 but previous support at 1.2757 should hold from here.
Our preferred count on the daily chart is that cable's rebound from 1.3500 (wave (A) trough) is unfolding as a wave (B) with A ended at 1.7043, followed by triangle wave B and wave C as well as wave (B) has ended at 1.7192, the subsequent selloff is the larger degree wave (C) which is still unfolding with minor wave (III) of larger degree wave 3 ended at 1.1986, hence wave (IV) correction is in progress which could either be a triangle wave (IV) of a complex formation but upside should be limited to 1.3500 and price should falter well below 1.4000, bring another decline in wave (V) of 3 for weakness to 1.1500, then 1.1200.
On the upside, expect recovery to be limited to 1.2920-30 and said resistance at 1.2958 should remain intact, bring another decline later. A firm break of 1.2958 would signal the pullback from 1.2991 has ended, bring retest of 1.2991 later, only above there would revive bullishness and extend recent upmove to 1.3040-50 but overbought condition should limit upside to 1.3075-80 and price should falter below 1.3100. We are keeping our view that the wave c as well as larger degree wave B has ended at 1.2109, hence impulsive wave C has commenced from there with wave i of C ended at 1.2616, follow by a correction to 1.2365 (end of wave ii) and wave iii rally is unfolding.
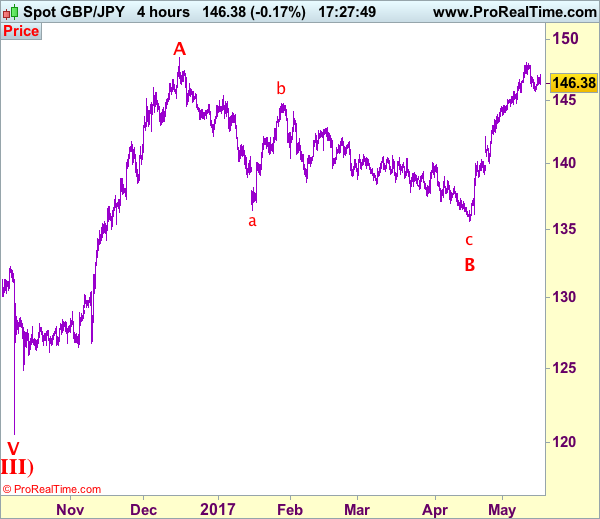
Trade Idea: GBP/JPY – Buy at 144.50
GBP/JPY - 146.10
Recent wave: Medium term low formed at 120.50 and (A)-(B)-(C) major correction has commenced with (A) leg ended at 148.45, hence wave (B) is unfolding for retreat to 131.00-10.
Trend: Near term up
Original strategy:
Buy at 144.50, Target: 146.70, Stop: 143.90
Position: -
Target: -
Stop: -
New strategy :
Buy at 144.50, Target: 146.70, Stop: 143.90
Position: -
Target: -
Stop:-
Current retreat after meeting renewed selling interest at 147.10 has retained our view that further consolidation below recent high of 148.10 would be seen and near term downside risk remains for test of 145.70 support, below there would extend the corrective fall from 148.10 top to 145.00-10, however, reckon downside would be limited to 144.50-60 and bring rebound later. Above said resistance at 147.10 would signal the pullback from 148.10 has ended, bring further gain to 147.50-60, then towards said resistance at 148.10, only a break above there would extend recent upmove from 135.60 to previous chart resistance at 148.45 which is likely to hold from here.
In view of this, we are inclined to buy sterling on subsequent pullback as 144.50-60 should limit downside, bring another rise later. Below said support at 144.00-10 would abort and suggest a temporary top is formed instead, bring correction to 143.50-60 but reckon 143.10-15 would hold from here, bring another rise later.
Our preferred count is that larger degree wave V with circle is unfolding from 251.12 with wave (I) 219.34, (II): 241.38 and wave (III) is subdivided into 1: 192.60, 2: 215.89 (23 Jul 2008) and wave 3 ended at 118.87 earlier in 2009. The correction from there to 162.60 is wave 4 which itself is a double three and is labeled as first a-b-c ended at 151.53, followed by wave x at 139.03, 2nd a ended at 162.60, 2nd b at 146.75 and 2nd c leg of wave 4 ended at 163.00. Therefore, the decline from 163.00 to 116.85 is now treated as wave 5 which also marked the end of larger degree wave (III), hence wave (IV) major correction has commenced for retracement of the wave (III) from 241.38 and upside target at 183.95-00 (50% Fibonacci retracement of the wave (II) from 241.38) had been met, a drop below 160.00 would suggest wave (IV) has ended at 195.85, bring decline in wave (V) for initial weakness to 130 (already met) and 120.
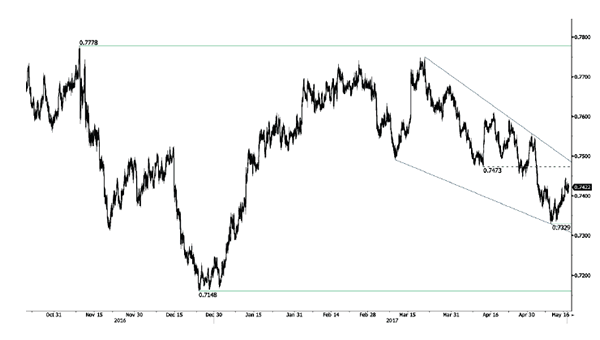
Technical Outlook: AUDUSD – Pivotal Support At 0.7400 Under Pressure After Repeated Upside Rejections
The Aussie eases from session high at 0.7433, posted after release of RBA minutes overnight, unable to hold gains and returns to session low at 0.7403.
Fresh weakness generates negative near-term signal, following Monday’s strong upside rejection of three-day recovery at 0.7444, just under falling 20SMA.
Hourly higher base at 0.7403 (reinforced by rising hourly cloud top and Fibo 38.2% of 0.7329/0.7444 recovery leg) is offering solid support, loss of which would signal further easing and generate initial signal of recovery stall.
Bearish acceleration and close below 0.7373 (Fibo 61.8%) is needed to confirm reversal, as negative daily studies support the notion.
Extended consolidation could be expected while 0.7400 support zone is holding, however, lift above falling 20SMA (currently at 0.7452) is required to confirm bullish continuation of recovery leg from 0.7329.
Res: 0.7433, 0.7444, 0.7452, 0.7467
Sup: 0.7400, 0.7385, 0.7373, 0.7356