Sample Category Title
Trade Idea Wrap-up: EUR/USD – Buy at 1.1020
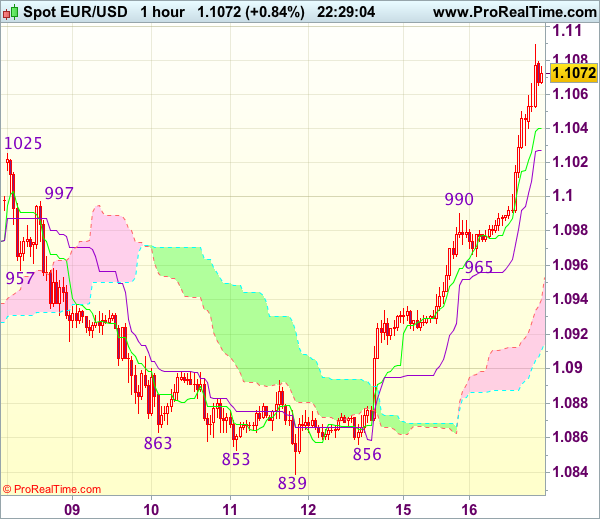
EUR/USD - 1.1075
Most recent candlesticks pattern : N/A
Trend : Near term up
Tenkan-Sen level : 1.1040
Kijun-Sen level : 1.1027
Ichimoku cloud top : 1.0940
Ichimoku cloud bottom : 1.0911
Original strategy :
Buy at 1.1020, Target: 1.1120, Stop: 1.0985
Position : -
Target : -
Stop : -
New strategy :
Buy at 1.1020, Target: 1.1120, Stop: 1.0985
Position : -
Target : -
Stop : -
Euro has rallied and broke above previous resistance at 1.1025, confirming recent upmove has resumed and further gain to 1.1100 and possibly 1.1125-30 would be seen, however, near term overbought condition should limit upside to 1.1150 and reckon 1.1175-80 would hold from here, bring retreat later.
In view of this, we are looking to buy euro on pullback as previous resistance at 1.1025 should turn into support and contain euro’s downside, bring another upmove later. Below another previous resistance at 1.0990 would abort and suggest top is possibly formed, bring correction to 1.0965 support first.
Trade Idea Wrap-up: USD/JPY – Buy at 112.70
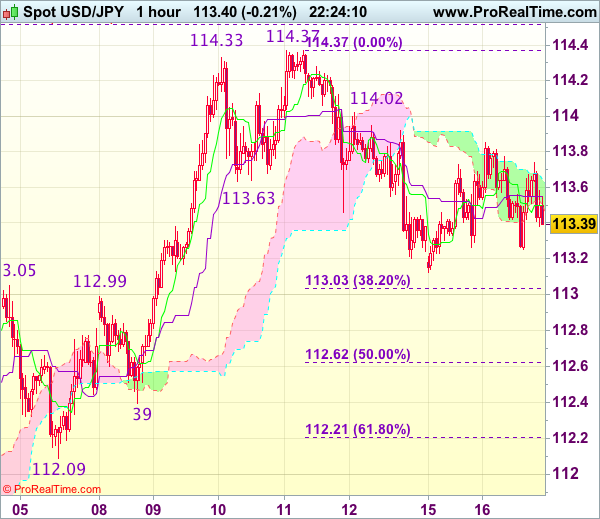
USD/JPY - 113.32
Most recent candlesticks pattern : N/A
Trend : Near term up
Tenkan-Sen level : 113.50
Kijun-Sen level : 113.55
Ichimoku cloud top : 113.65
Ichimoku cloud bottom : 113.50
Original strategy :
Buy at 112.70, Target: 113.80, Stop: 112.35
Position : -
Target : -
Stop : -
New strategy :
Buy at 112.70, Target: 113.80, Stop: 112.35
Position : -
Target : -
Stop : -
As the greenback met resistance at 113.85 yesterday and retreated, retaining our view that further consolidation below last week’s high at 114.37 would be seen and pullback to 113.00-05 (38.2% Fibonacci retracement of 110.87-114.37 and previous resistance) cannot be ruled out, however, reckon 112.60-65 (50% Fibonacci retracement of 110.87-114.37) would limit downside and bring rebound later, above 113.85 would bring test of 114.00-05 but break of latter level is needed to signal the pullback from 114.37 has ended, bring retest of this level later.
In view of this, we are inclined to buy dollar on next decline but one should exit on such rebound as 114.37 resistance should cap upside. Below support at 112.39 would risk further weakness to 112.20-25 (61.8% Fibonacci retracement of 110.87-114.37) but still reckon previous support at 112.09 would hold from here.
EUR/USD Clears 1.1023 Resistance
Headlines
European equities meandered in slightly negative territory during the morning session, but are currently again near flat levels for the day. US equities open marginally higher, shrugging off the Trump story.
UK inflation resumed its upward march last month, boosted by the price of air fares, clothing and energy. Consumer prices rose from 2.3% Y/Y to 2.7% Y/Y (vs 2.6% Y/Y expected), the fastest pace since September 2013. Underlying, core CPI accelerated from 1.8% Y/Y to 2.4% Y/Y and also PPI data beat expectations.
Central European Q1 GDP data printed very strong, beating consensus: Romania 1.7% Q/Q, Czech Republic and Hungary 1.3% Q/Q, Poland 1% Q/Q and Bulgaria 0.8% Q/Q. Local currencies rallied against a strong euro with CZK at the strongest level since the CNB ended its intervention regime and PLN at the strongest rate since end 2015.
The mood among German investors improved further in May, with the ZEW-indicator reaching its highest since July 2015, in a further sign that political uncertainties which have clouded the growth outlook for Europe's biggest economy are evaporating. The forward looking expectations component rose less than expected though.
US housing starts & permits disappointed in April as both fell about 2.5% to respectively 1172K and 1229K. The housing series are volatile and starts & permits are at high levels. Therefore, one shouldn't draw conclusions from the miss. Industrial production on the contrary sharply outperformed expectations being up 1% in April both for the overall figure and for the manufacturing output. A sign Q2 GDP will rebound after a lacklustre Q1.
The Riksbank is considering changing the measure used for its inflation target to one that is less affected by interest rate changes (CPIF), and introducing a "variation band" of plus or minus one percentage point from the official 2% target. The proposals are expected to be implemented after the central bank's September policy meeting.
OPEC and its oil-producing partners may have to do more than merely extend their petroleum-output cuts to achieve their goal of rebalancing global supply and demand, the International Energy Agency said. In the run up to the cuts, OPEC pumped so much oil that storage levels rose, delaying the rebalancing.
Europe's top court has said EU member states must sign off on some issues related to investment in a key trade deal with Singapore, in a judgment that could set a precedent for a post-Brexit trade pact with the UK.
Rates
Core bonds barely changed in thin trading
Global core bonds lost slightly ground in another session without firm direction. Core bonds are in consolidation mode awaiting new important impetus. Other markets didn't impact core bonds. Oil gained slightly for the fifth consecutive session, but is off the intraday highs and the daily momentum is slowing. European equities are near opening levels, erasing initial small losses. FX market showed more dynamics with euro strength and dollar weakness.
Intraday, the Bund opened slightly higher as some modest risk-off sentiment reigned in Asia after the latest Trump story on revealing intelligence information to the Russian minister of foreign affairs. However, European equities barely fell in the opening and stabilized soon. EMU data (GDP, trade and ZEW sentiment) confirmed the strength of the euro area recovery, but actually didn't reveal much extra new info. Supply was an issue with new long bonds from France and UK in size. The issuance was well received, but nevertheless weighted somewhat on the longer end. Technical players eyed the 160 level in the Bund (correction low) which in case of a break would open the road to levels around 158.80 (10- yr yield high 0.50%). However, the Bund never made it to 160 (160.17 intra-day low). US housing starts and permits disappointed. In today's thin trading, they exceptionally caused a soft bounce that erased the T-note's (small) losses and lifted the Bund off the intraday lows. Strong industrial production data didn't change the picture. Later today, ECB Nowotny and Coeuré still speak.
At the time of writing, German yields increased by 1.3 bps (2-yr) to 1.5 bps (30- yr). The French debt agency successfully launched a syndicated 31-yr benchmark (May2048) (see below). US yield changes are narrowly mixed between +0.4 bps (2-yr) and -0.1 bp (30-yr). On intra-EMU bond markets, 10-yr yield spread changes versus Germany r narrowed 3,4 and 5 bps for Spain, Italy and Portugal.
France has attracted in excess of €30B of orders for a new 31-yr OAT bond, in a rapturous investor reception for the country's debt after the presidential election concluded last week. The "Trésor" finally printed €7B of its new 3.25% May 2048 OAT. France outperformed Belgium by 2 bps at the 30-yr tenor as a consequence of the successful launch.
Currencies
EUR/USD clears 1.1023 resistance
EUR/USD cleared 1.1023 resistance today. The move was due to USD weakness on recent Trump-related issues and on disappointing US eco data. At the same time, political sentiment on the euro stays constructive. EUR/USD trades around 1.1075. The loss of USD/JPY remains modest as US equities stay resilient despite all kinds of political and economic noise from the US.
Overnight, Asian equities took a strong start after WS's record race, but the momentum dwindled as US President Trump revealed classified information to the Russian foreign minister. USD/JPY retreated off the early Asian highs (113.80) and returned to the mid 113 area. EUR/USD buying persisted and brought the pair within reach of the 1.10 barrier
The EUR/USD rally accelerated from the start in Europe. Uncertainty on the ability of the Trump's administration to implement a coherent policy and recent disappointing US eco data caused further USD selling. At the same time, the euro profited from constructive political sentiment after yesterday's meeting between German Chancellor Merkel and French president Macron. The DAX set a new all-time top and investors squeezed EUR/USD north of the 1.1023 post- Macron top. Interest rate differentials between the US and Germany/Europe held near the recent lows, but declined only marginally further. US housing starts again missed consensus and failed to rebound from a poor performance last month. EUR/USD set a correction top (1.1089 )after the housing data. However, mid-morning, the US production data were much stronger than expected. The report has only a limited impact on the dollar, but prevents further USD losses. EUR/USD trades in the 1.1075 area. USD/JPY eased below 113.50 after the housing data but for now US equities remain immune for negative US news. This equity resilience prevents further USD/JPY losses.
The Swedish Crown declines further (EUR/SEK 9.73 currently) as the Risksbank proposed a change in its policy framework, allowing a range of 1% around the CPIF 2% inflation target. Markets interpret this as the central bank opening the door to keep policy easy even if inflation overshoots the target.
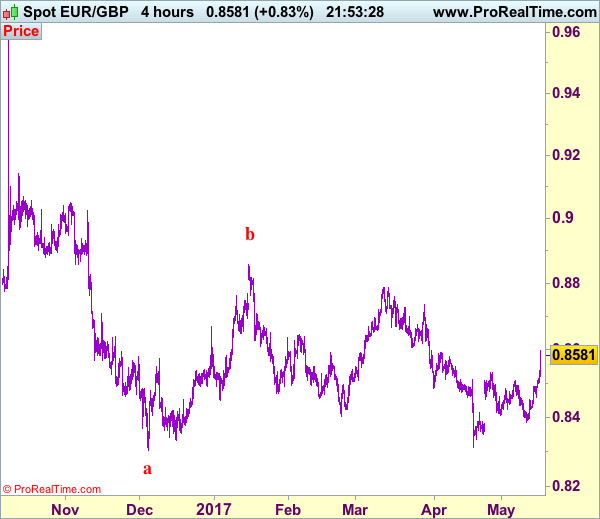
EUR/GBP clears 0.8509/31 resistance despite higher CPI
UK April inflation printed at 2.7% Y/Y today (from 2.3% Y/Y in April while 2.6% Y/Y was expected). Core inflation rose to 2.4% Y/Y (from 1.8% Y/Y) and was also a touch higher than expected. The data were unable to support sterling though. On the contrary, euro strength dominated. EUR/GBP already tested 0.8509/31 resistance and the move accelerated after the CPI data. The technical break and broad-based euro strength reinforced EUR/GBP buying. The pair trades currently in the 0.8580/85 area. Cable also failed to gain any ground despite overall USD softness. A decision of the EU Court of Justice on the EU free trade agreement with Singapore probably also weighed on sterling. The court ruled that the agreement needs to be approved by national parliaments. The ruling raised the chance that national parliaments will also have an important say in the approval of a EU-UK trade deal, making the outcome more uncertain. Whatever the reason, cable also reversed initial gains despite higher than expected UK inflation. The pair trades just below 1.29. Overall, today's price action suggests a further deterioration of sterling sentiment.
Trade Idea: EUR/GBP – Buy at 0.8530
EUR/GBP - 0.8582
Recent wave: Major double three (A)-(B)-(C)-(X)-(A)-(B)-(C) is unfolding and 2nd (A) has possibly ended at 0.6936.
Trend: Near term down
Original strategy :
Buy at 0.8465, Target: 0.8565, Stop: 0.8425
Position : -
Target : -
Stop : -
New strategy :
Buy at 0.8530, Target: 0.8630, Stop: 0.8490
Position : -
Target : -
Stop : -
As the single currency has accelerated after breaking indicated resistance at 0.8531 (now support), adding credence to our bullishness and signal another leg of corrective rise from 0.8312 low is in progress, hence upside bias remains for further gain to 0.8620-30, however, as this move is viewed as retracement of recent decline, reckon upside would be limited to 0.8650-60, risk from there is seen for a retreat later.
In view of this, we are still looking to buy euro on pullback but at a higher level as 0.8531 (previous resistance) should limit downside and bring another rise. Below 0.8500-05 would defer and suggest top is possibly formed, bring weakness to support at 0.8457 but break of previous resistance at 0.8452 is needed to confirm and bring test of support at 0.8423 first.
Our preferred count is that, after forming a major top at 0.9805 (wave V), (A)-(B)-(C) correction is unfolding with (A) leg ended at 0.8400 (A: 0.8637, B: 0.9491 and 5-waver C ended at 0.8400. Wave (B) has ended at 0.9413 and impulsive wave (C) has either ended at 0.8067 or may extend one more fall to 0.8000 before prospect of another rally. Current breach of indicated resistance at 0.9043 confirms our view that the (C) leg has ended and bring stronger rebound towards 0.9150/54, then towards 0.9240/50.
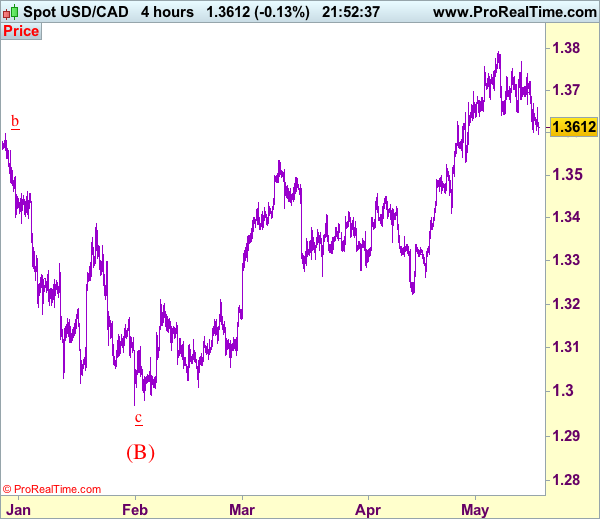
Trade Idea: USD/CAD – Buy at 1.3535
USD/CAD - 1.3605
Recent wave: Only wave v of c has ended at 0.9407 and wave C of major A-B-C correction is underway for headway to 1.4700
Trend: Near term up
Original strategy :
Buy at 1.3535, Target: 1.3735, Stop: 1.3475
Position: -
Target: -
Stop: -
New strategy :
Buy at 1.3535, Target: 1.3735, Stop: 1.3475
Position: -
Target: -
Stop:-
The greenback has remained under near term pressure, consolidation with mild downside bias is seen for retracement of recent rise, hence weakness to 1.3575-80 would be seen, however, reckon downside would be limited to support at 1.3530 and bring rebound later, above 1.3665-70 would bring rebound to 1.3700 but break of 1.3740-45 is needed to signal the pullback from recent high at 1.3794 has ended, bring test of 1.3770 resistance first, then towards 1.3794. Looking ahead, only a break above there would confirm recent upmove has resumed and extend further gain to 1.3840-50, then towards 1.3900.
In view of this, would not chase this rise here and would be prudent to buy again on pullback as 1.3530-35 should limit downside and bring another rise later. A firm break below 1.3530 would abort and suggest a temporary top is formed, bring retracement of recent upmove to 1.3500 and later towards 1.3450-60 but support at 1.3411 should remain intact, bring another upmove later.
To recap, wave B from 1.3066 is unfolding as an a-b-c and is sub-divided as a: 1.2192, b: 1.2716 and wave c is a 5-waver with i: 1.1983, ii: 1.2506, extended wave iii with minor iii at 1.0206, wave iv ended at 1.0781 and wave v as well as wave iii has ended at 0.9931, hence the subsequent choppy trading is the wave iv which is unfolding as (a)-(b)-(c) with (a) leg of iv ended at 1.0854, followed by (b) leg at 1.0108 and (c) leg as well as the wave iv ended at 1.0674. The wave v is sub-divided by minor wave (i): 0.9980, (ii): 1.0374, (iii): 0.9446, (iv): 0.9913 and (v) as well as v has possibly ended at 0.9407, therefore, consolidation with upside bias is seen for major correction, indicated target at 1.3700 and 1.4000 had been met and further gain to 1.4700 would be seen later.
US Housing Starts Unexpectedly Declined in April Following a Strong Q1
Highlights:
- Housing starts fell to 1,172k annualized units in April from 1,203k in March, well short of market expectations for an increase to 1,260k.
- Single unit starts edged higher while the more volatile multi-unit component declined for a fourth consecutive month.
- Building permits also declined in April but remained solidly above starts at 1,229k annualized units.
- With permit issuance outpacing starts over the last six months there is scope for a near-term rebound in housing starts.
- Today's data is consistent with our monitoring for residential investment to rise at a more moderate 3.6% annualized pace in Q2 following Q1's outsized 13.7% gain.
Our Take:
The US economy's disappointing start to the year (Q1 GDP +0.7%) was despite the best efforts of the residential sector, which contributed 1/2 percentage point to growth in the quarter-one of the better adds of the post-recession housing recovery. The unexpected pullback in April's housing starts seems to indicate some of that strength was due to activity being brought forward amid unseasonably mild temperatures earlier this year. As such, we don't expect residential investment can keep up the double-digit gains recorded in Q1, but we look for housing to continue to make a positive contribution to GDP growth going forward. Strong labour markets, rising confidence, improving household balance sheets, accommodative financial conditions and limited supply in the existing home sales market all argue for further recovery in homebuilding activity. Healthy permit issuance and strong homebuilders' confidence also point to recent strength being maintained. The latter improved in May, with no signs of an impact on sentiment from rising costs related to recently-announced duties on Canadian softwood lumber, which the NAHB estimates could add close to $3600 to the price of a home in the US.
Housing Starts Pull-Back in April, as Multifamily Weighs
Both housing starts and permits started off the second quarter with subpar readings, unwinding some of the progress made during the start of the year. Starts fell 31k to 1172k units from a downwardly revised 1203k print for March, disappointing market expectations for a 1260k reading.
The multifamily segment accounted for the entirety of the decline, with starts down 34k to 337k units. On the other hand, homebuilding in the less-volatile single-family segment increased by 3k to 835k on the month.
Building permits also disappointed consensus, falling to 1229k in April, while a rise to 1270k was expected. Here, single family units accounted for this disappointment, down 37k to 789k from the prior month while the multifamily segment posted a 6k permit gain on the month to total 440k.
Activity in both the Northeast and the South weighed, with the regions posting a 47k and 59k drop in starts, respectively. The Midwest outperformed with a 60k gain for the month as the West trailed behind with a 15k increase during April.
Key Implications
Despite the disappointing headline there was some good news in the report, with the single family segment remaining on an upward trend. This is reflective of continued labor market progress that underpins strong demand for new homes as rising wages support household formation. This segment better reflects economic conditions, and is gaining strength with the number of owner-occupied units surpassing that of renter-occupied units in the first quarter of the year - something not seen since 2006. While the decline in permit activity suggests some caution that may be related to elevated new home prices and the rise in interest rates beginning to weigh on housing demand, we nonetheless expect strong wage and income growth in the coming months will likely provide some relief and support demand for new homes.
The good underlying demand story is corroborated by builder sentiment. Despite builders continuing to face rising building materials costs since the start of the year, notably for softwood lumber, their confidence in the market persists as the NAHB's Housing Market Index for May increased to 70, just below its cyclical high of 71. Low inventory levels continue to pressure prices up, attracting builders to the market.
Today's report puts a bit of a damper on the relatively good economic data seen to start off the second quarter. Still, residential investment should be mildly supportive for overall economic growth this quarter, with GDP likely to clock in at about 3.4% during Q2.
CAC Drifting as French Final CPI Matches Forecast
The CAC continues to have a quiet week, as the index shows limited movement in the Tuesday session. Currently, the CAC is trading at 5401.35, down 0.48 percent. On the economic front, Eurozone Flash GDP climbed 0.5%, matching the forecast. French Final CPI posted weak gains of 0.1%, also matching the estimate. There was excellent news from Eurozone ZEW Economic Sentiment, which jumped to 35.1, easily beating the forecast of 29.1 points. On Wednesday, the eurozone releases Final CPI, which is expected to rise to 1.9%.
The French economy was a major issue in the recent presidential campaign, and all eyes are on incoming president Emmanuel Macron to make substantive changes that will kick-start the weak French economy. Inflation slipped to 0.1% in April, after an unexpectedly strong showing in March, which showed a gain of 0.6%. Meanwhile, the spotlight remains on the French political front, with President Emmanuel Macron choosing Edouard Philippe, a conservative lawmaker, as his new prime minister. Macron has pledged to dismantle the left-right divide which has characterized French politics for decades, and his choice of Macron, who has support on both sides of the aisle, is an important first step in his goal of unifying the country.
The CAC remains at high levels, buoyed by improved growth in the eurozone. Market predictions for Eurozone GDP were on target, as Flash GDP came in at 0.5% in the first quarter of 2017. This reading was unrevised from Preliminary Flash GDP back in April. The well-respected ZEW Economic Sentiment surveys, which gauge optimism among investors and analysts, were a mixed bag for May. The German indicator improved to 20.6, short of expectations. What was more surprising was the unexpected jump from the Eurozone indicator, which improved to 35.1, its strongest level in almost two years. With the eurozone showing stronger growth, has inflation kept up? We'll get an indication on Wednesday, with the release of Eurozone Final CPI, which is expected to rise to 1.9%. Stronger inflation levels will increase pressure on the ECB to consider tapering its ultra-loose monetary policy. Germany, for one, is finding that ultra-low interest rates is hampering growth, and wants Brussels to adopt a tighter monetary policy.
President Trump has been pressing the damage control button since last week, as the White House and Congress remain focused on the fallout from Trump's dismissal of FBI director James Comey. There was more bad news for President Trump on Tuesday, with a report in the Washington Post that Trump had shared confidential intelligence reports with Russia's foreign minister at a meeting last week. The White House has denied the report, but the timing is particularly bad for Trump, who is already under investigation for possible Russian involvement in the presidential campaign. The markets are concerned that Trump will be so busy trying to put out political firestorms, that his agenda of increased fiscal spending and tax reform will stall. These jitters could hurt investor confidence and send global stock markets lower.
AUD/NZD Bearish Wolf Wave Getting Close To Point 5
The AUD/NZD has formed a bearish Wolfe Wave after the retail gap that pushed the price up. The pair is still in downtrend on 4h time frame, so it could piggyback momentum from higher time frames to H1 chart. That means a potential bearish trade setup when Point 5 has been formed. Type 1 setup might happen when the price enters the POC zone (ATR high,Wolfe Wave point 5) 1.0805-0812. The rejection could target the EPA (Estimated Price at Arrival) target 1.0743. If the pair breaks above 1.0812 then traders should wait for the price to again close below 1-3 line for the Type 2 setup.
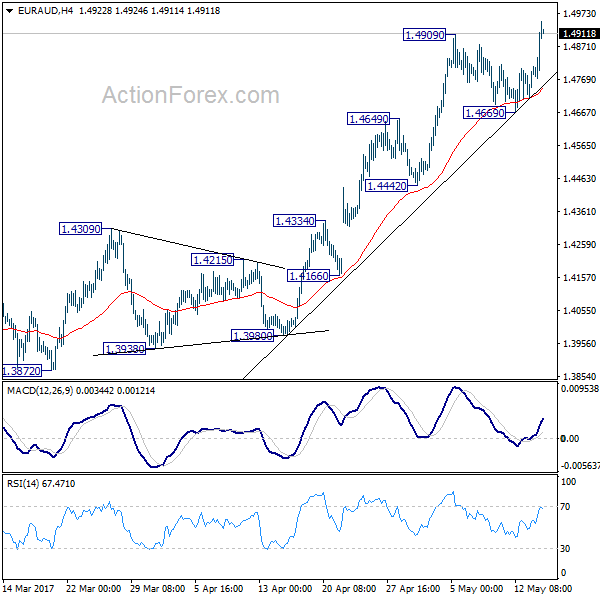
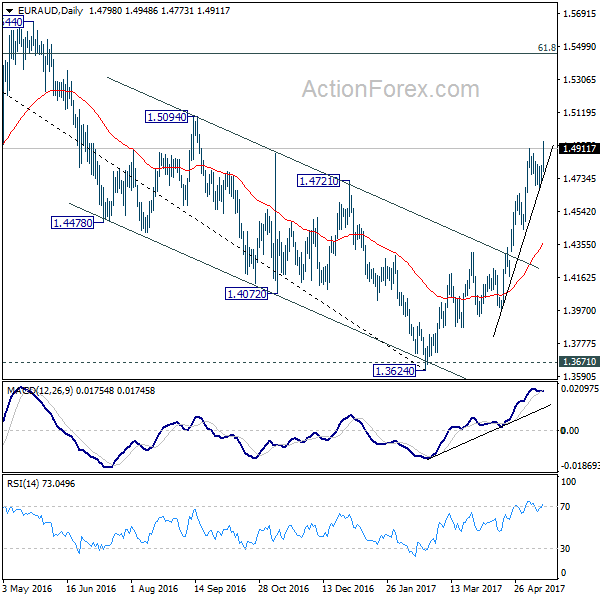
EUR/AUD Mid-Day Outlook
Daily Pivots: (S1) 1.4741; (P) 1.4775; (R1) 1.4836; More...
EUR/AUD's break of 1.4909 resistance confirms resumption of recent rise from 1.3624. Intraday bias is back on the upside for 1.5094 resistance next. As noted before, outlook is unchanged that whole correction from 1.6587 has completed at 1.3624 already after defending 1.3671 key support level. Break of 1.5094 will target next medium term fibonacci level at 1.5455. On the downside, break of 1.4669 support is needed to indicate short term topping. Otherwise, outlook will remain bullish in case of retreat.
In the bigger picture, price actions from 1.6587 medium term top are viewed as a corrective pattern. Such correction should be completed after defending 1.3671 key support. Rise from 1.3642 is now expected to target 61.8% retracement of 1.6587 to 1.3624 at 1.5455 and above. In any case, outlook will now stay cautiously bullish as long as 1.4309 resistance turned support holds.