Sample Category Title
Trade Idea : GBP/USD – Hold short entered at 1.2925
GBP/USD - 1.2915
Most recent candlesticks pattern : N/A
Trend : Near term up
Tenkan-Sen level : 1.2925
Kijun-Sen level : 1.2912
Ichimoku cloud top : 1.2908
Ichimoku cloud bottom : 1.2893
Original strategy :
Sold at 1.2925, Target: 1.2825, Stop: 1.2960
Position : - Short at 1.2925
Target : - 1.2825
Stop : - 1.2960
New strategy :
Hold short entered at 1.2925, Target: 1.2825, Stop: 1.2960
Position : - Short at 1.2925
Target : - 1.2825
Stop : - 1.2960
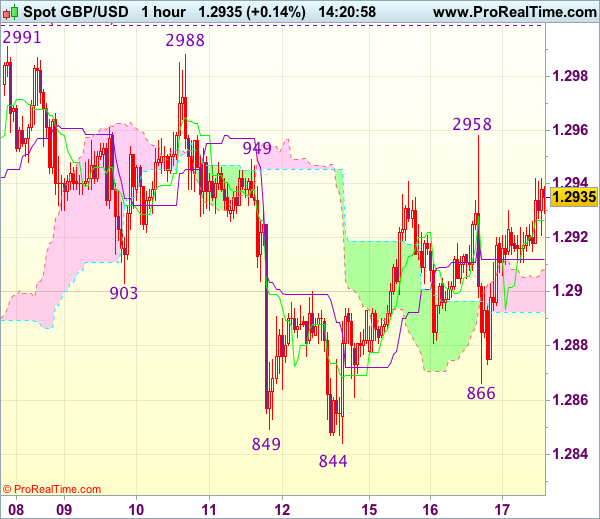
Although cable found support at 1.2866 yesterday and rebounded on dollar’s broad-based weakness, outlook remains consolidative and as long as indicated resistance at 1.2958 holds, prospect of another retreat remains, below said support at 1.2866 would signal the rebound from 1.2844 has ended, however, break there is needed to extend the fall from 1.2991 to 1.2831 support, then 1.2805.
In view of this, we are holding on to our short position entered at 1.2925. A firm break above said resistance at 1.2958 would abort and suggest correction from 1.2991 has ended at 1.2844, bring further gain to 1.2970 but said resistance at 1.2991 should hold on first testing. Only a break of 1.2999-00 (1.236 times projection of 1.2109-1.2616 measuring from 1.2365 and psychological resistance) would revive bullishness and bring resumption of upmove for headway to 1.3040-50 first.
Trade Idea : EUR/USD – Buy at 1.1050
EUR/USD - 1.1118
Most recent candlesticks pattern : N/A
Trend : Near term up
Tenkan-Sen level : 1.1100
Kijun-Sen level : 1.1055
Ichimoku cloud top : 1.0972
Ichimoku cloud bottom : 1.0925
Original strategy :
Buy at 1.1020, Target: 1.1120, Stop: 1.0985
Position : -
Target : -
Stop : -
New strategy :
Buy at 1.1050, Target: 1.1150, Stop: 1.1015
Position : -
Target : -
Stop : -
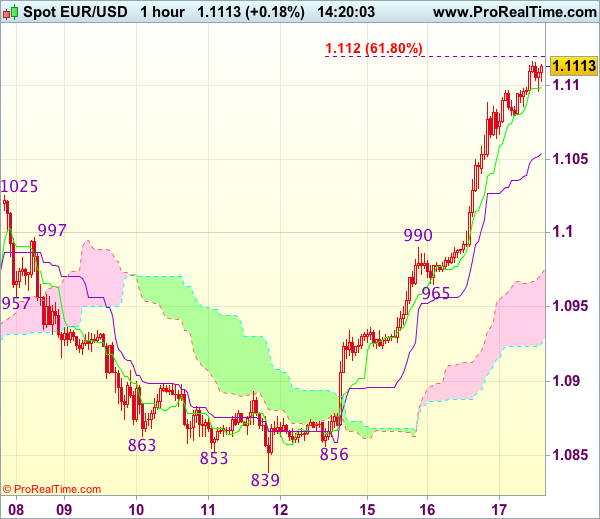
As the single currency has continued moving higher after recent rally above previous resistance at 1.1025 (now support), adding credence to our view that recent upmove has resumed and bullishness remains for further gain to 1.1150-55 (1.236 times projection of 1.0839-1.0990 measuring from 1.0965), then towards 1.1175-80, however, near term overbought condition should limit upside and reckon 1.1205-10 (1.618 times projection) would hold from here, bring retreat later.
In view of this, would not chase this rise here and we are looking to buy euro on pullback as 1.1050 should limit downside. Below previous resistance at 1.1025 (now support) would defer and suggest top is possibly formed instead, risk test of another previous resistance at 1.0990 first.
Trade Idea : USD/JPY – Stand aside
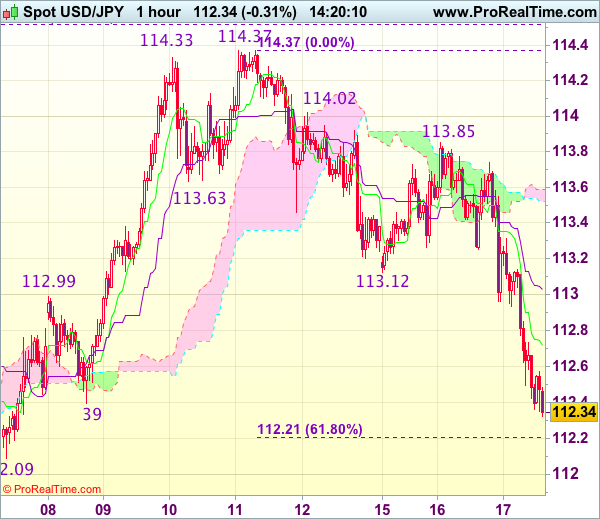
USD/JPY - 112.34
Most recent candlesticks pattern : N/A
Trend : Near term down
Tenkan-Sen level : 112.72
Kijun-Sen level : 113.03
Ichimoku cloud top : 113.59
Ichimoku cloud bottom : 113.52
Original strategy :
Bought at 112.70, stopped at 112.35
Position : - Long at 112.70
Target : -
Stop : - 112.35
New strategy :
Stand aside
Position : -
Target : -
Stop : -
As the decline from 114.37 has accelerated on dollar’s broad-based weakness, dampening our near term bullishness and downside risk remains for the selloff from 114.37 top to extend weakness to previous support at 112.09, break there would bring subsequent decline to 111.75-80 but near term oversold condition should limit downside to another previous support at 111.43, bring rebound later.
In view of this, would not chase this fall here and would be prudent to stand aside in the meantime. Above the Tenkan-Sen (now at 112.71) would bring recovery to the Kijun-Sen (now at 113.03) but previous support at 113.12 should limit upside and price should falter well below 113.40-50, bring another decline later.
Market Update – Asian Session: USD At Post US-Election Lows As New Trump Obstruction Allegations Surface
US Session Highlights
(US) Goldman Economist Chain Store Sales w/e May 13th w/w: -1.1%; Y/Y: +1.0%
(US) APR HOUSING STARTS: 1.17M V 1.26ME; BUILDING PERMITS: 1.23M V 1.27ME; single family permits drop
Reportedly Iran will support a 9-month extension of the oil production cut agreement if there is a consensus among participants - press
(US) APR INDUSTRIAL PRODUCTION M/M: 1.0% V 0.4%E; CAPACITY UTILIZATION: 76.7% V 76.3%E (largest total industrial production gain since Feb 2014)
Stocks rose to new highs in the first half of today's session, with the S&P reaching a new all-time top at 2,405.8. Eventually, investors appetite for risk took a more subdued tone and indices closed mostly flat on the day. Markets are now concerned about the leaks from Trump's meeting with Russian officials and the political turmoil it is creating. Techs continued to hold positive ground; NASDAQ closed up 20 points on the day, and the S&P Tech sector gained 0.4%.
US markets on close: Dow flat, S&P500 -0.1%, Nasdaq +0.3%
Best Sector in S&P500: Technology
Worst Sector in S&P500: Utilities
Biggest gainers: FTR +4.7%; QRVO +4.6%; YHOO +2.2%
Biggest losers: TGNA -6.4%; HRB -6.0%; DVA -6.0%
At the close: VIX 10.6 (+0.2pts); Treasuries: 2-yr 1.28% (-2bps), 10-yr 2.33% (-1bps), 30-yr 2.99% (-2bps)
US movers afterhours
RRGB Reports Q1 $0.89 v $0.58e, R$418.6M v $417Me; Guides slightly higher FY17 EPS $2.80-3.10 v $2.73e ; +16.3% afterhours
JACK Reports Q2 $0.98 v $0.90e, R$369.4M v $369Me; hires advisers to consider potential alternatives for Qdoba unit; +11.2% afterhours
GNC Interim CEO Moran bought 300K shares at $6.69/shr- Moran now holds 953.3K shares ; +3.9% afterhours
URBN Reports Q1 $0.13 v $0.16e, R$761M v $772Me; +1.7% afterhours
BZUN Reports Q1 $0.08 v $0.08e (1 est), R$116.9M v $103.6M y/y; -12.4% afterhours
AMZN: Said to seek entry into pharmacy market; to hire a GM to oversee the effort - financial press
CL: CEO said to have indicated company may be open to sale at $100/shr (vs $71.58 last close) - NY Post
Key economic data
(JP) JAPAN MAR MACHINE ORDERS M/M: 1.4% V 2.5%E; Y/Y: -0.7% V 1.2%E
(AU) AUSTRALIA MAY WESTPAC CONSUMER CONFIDENCE INDEX: 98.0 V 99.0 PRIOR, M/M: -1.1% V -0.7% PRIOR
(AU) AUSTRALIA Q1 WAGE PRICE INDEX Q/Q: 0.5% V 0.5%E; Y/Y: 1.9% V 1.9%E
(NZ) NEW ZEALAND Q1 PPI INPUT Q/Q: 0.8% V 1.0% PRIOR; PPI OUTPUT Q/Q: 1.4% V 1.5% PRIOR (4th consecutive quarter of gains, first time in 6-yrs)
(NZ) Fonterra Global Dairy Trade Auction: Dairy Trade price index: +3.2% v +3.6% prior; 5th straight increase
Asia Session Notable Observations, Speakers and Press
Asia session is in clear risk-off mode despite the mixed-flattish Wall Street trade as political risk surrounding the White House administration appears to be getting worse. In late US after-market, NY Times reported that Pres Trump asked former FBI Director Comey to shut down investigations of former NSA Flynn. Investors are concerned that the latest gaffe may translate into obstruction investigation by Congress, with leaders of both parties already hinting about a subpoena for the Comey documents. S&P e-minis fell over 0.5% or 15 handles, USD/JPY slid some 70pips below 112.40, US Treasury yield was down 2.5% on safehaven US debt demand, and Gold rose 0.5% above 1,240. EUR/USD also broke above the 1.11 handle - its best level since the US elections that first triggered the now-stalled greenback surge.
In economic data, Australia Westpac Consumer Index fell for the 2nd straight month to 98.0 from 99.0. Westpac economist noted that confidence in housing and the outlook for house prices deteriorated sharply while the assessment of the Budget around the outlook for family finances was decidedly weaker. Also of note in Australia, S&P became the last major rating agency to affirm Australia AAA following its recent FY budget, but also warned it may cut rating if its confidence in surplus outlook dissipates.
China
(CN) China National Energy Administration (NEA): Apr power consumption +4.8% y/y to 342B Kwh
(CN) China hopes for improvement in its relationship with South Korea - financial press
(CN) China to create CNY150B venture capital fund for central SOEs – Chinese Press
Japan
(JP) BOJ Gov Kuroda: No particular requests from PM Abe on monetary policy; Discussed global economy - press
(JP) Financial press looks ahead to Japan GDP data, expecting to see a 5th consecutive quarter of growth, which would be its longest run of growth in 10-yrs
(JP) Nikkei looks at recent selling pressure on the Nikkei225, attributing part of it to profit-taking by pension funds
Australia/New Zealand
(AU) S&P AFFIRMS AUSTRALIA SOVEREIGN AAA RATING; OUTLOOK REMAINS NEGATIVE
(AU) Australia wage growth of 1.9% in Q1 is below the period rise in cost of living of 2.1% - SMH
(NZ) ASB economist: Latest dairy auction suggests milk prices are fairly well balanced; Maintaining FY18 forecast of NZ$6.75/kg - NZ press
Asian Equity Indices/Futures (00:30ET)
Nikkei -0.6%, Hang Seng -0.3%, Shanghai Composite -0.1%, ASX200 -0.9%, Kospi -0.4%
Equity Futures: S&P500 -0.5%; Nasdaq -0.5%, Dax -0.4%, FTSE100 -0.2%
FX ranges/Commodities/Fixed Income (00:30ET)
EUR 1.1080-1.1115; JPY 112.35-113.10; AUD 0.7410-0.7430; NZD 0.6880-0.6905
June Gold +0.5% at 1,243/oz; June Crude Oil -0.9% at $48.21/brl; July Copper flat at $2.55/lb
(US) Weekly API Oil Inventories: Crude: +0.9M v -5.8M prior; first build in 3 weeks
iShares Silver Trust ETF daily holdings rise to 10,650 tonnes from 10,605 tonnes prior (3rd straight increase)
(CN) PBOC SETS YUAN MID POINT AT 6.8635 V 6.8790 PRIOR; Strongest Yuan setting since Feb 7th
(CN) PBOC to inject combined CNY140B v CNY190B prior in 7-day and 14-day reverse repos
(AU) Australia MoF (AOFM) sells A$500M in 4.5% 2033 Bonds; avg yield: 2.934% v 3.0205% prior; bid-to-cover: 2.67x v 3.07x prior
(KR) Bank of Korea (BOK) sells KRW1.2T in 2-yr monetary stabilization bonds; avg yield 1.61%
Asia equities notable movers
Australia
Wesfarmers (WES) -1.3%; Review of Officeworks finds now is not the right time for an IPO given market conditions
Paladin (PDN) -26.7%; Reports 9-month
BHP (BHP) +0.5%; Reportedly to meet with Elliott to discuss oil business - press
Fortescue (FMG) +3.7%; Morgans Financial Ltd Raised FMG.AU to Add from Hold
Japan
Sumitomo Chem (4005) +3.0%; Reports FY16/17
Toshiba (6502) +0.5%; Japan Securities Finance restricts short sale of Toshiba shares beginning May 17th - Nikkei
Takeda (4502) +2.1%; Takeda-Teva joint venture reportedly plans to boost overseas manufacturing of generic medications - Nikkei
Rakuten (4755) +0.7%; to issue ¥100B in 3, 5, 7 and 10-year straight bonds in order to cut debt and redeem maturing bonds - Nikkei
Hong Kong
Vtech (303) +5.1%; Reports FY16/17
Meitu (1357) -6.3%; Not being added to MSCI CHina index as speculated
Alibaba Health (241) +8.3%; Reports FY17
Car Inc (699) -3.2%; Reports Q1
Future Bright (703) -5.3%; Reports Q1
Daily Technical Outlook And Review: EUR/USD, GBP/USD, AUD/USD, USD/JPY, USD/CAD, USD/CHF, DOW 30, GOLD
A note on lower timeframe confirming price action...
Waiting for lower timeframe confirmation is our main tool to confirm strength within higher timeframe zones, and has really been the key to our trading success. It takes a little time to understand the subtle nuances, however, as each trade is never the same, but once you master the rhythm so to speak, you will be saved from countless unnecessary losing trades. The following is a list of what we look for:
- A break/retest of supply or demand dependent on which way you're trading.
- A trendline break/retest.
- Buying/selling tails ... essentially we look for a cluster of very obvious spikes off of lower timeframe support and resistance levels within the higher timeframe zone.
- Candlestick patterns. We tend to only stick with pin bars and engulfing bars as these have proven to be the most effective.
We typically search for lower-timeframe confirmation between the M15 and H1 timeframes, since most of our higher-timeframe areas begin with the H4. Stops are usually placed 1-3 pips beyond confirming structures.
EUR/USD
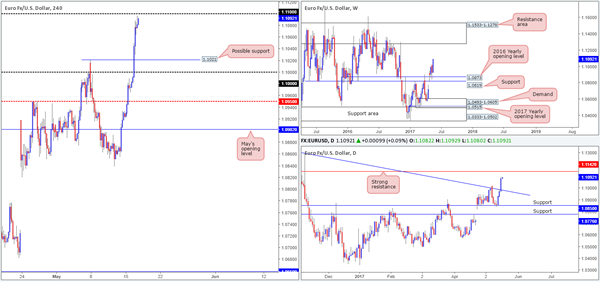
The value of the EUR strengthened in aggressive fashion on Tuesday, as the US dollar continued to plummet. Several H4 tech resistances were wiped out during the assault, with key resistance now resting around the 1.11 handle.
Alongside this, daily action ran through a trendline resistance extended from the high 1.1616, and is now seen within striking distance of a strong resistance line coming in at 1.1142. This barrier stretches as far back as early 2015, so it's certainly not a level one should overlook. Looking up to the weekly candles, however, the bulls appear to have a relatively clear run up to a resistance area drawn from 1.1533-1.1278.
Our suggestions: Upside momentum has unquestionably diminished ahead of the 1.11 hurdle, but is this enough to consider shorting? Given the strength of the bulls over the past few days, we would be wary of selling from here. What's more, let's take into account that forty or so pips above 1.11 sits a formidable daily resistance line at 1.1142, which is likely being watched by the majority of the market.
At the time of writing, our idea is to wait and see how the market reacts once it connects with the said daily resistance, as this could be a critical turning point, and one that we may consider shorting should a reasonably sized H4 bearish candle form
Data points to consider: No high-impacting news on the docket today.
Levels to watch/live orders:
- Buys: Flat (stop loss: N/A).
- Sells: 1.1142 region ([waiting for a reasonably sized H4 bear candle, preferably a full-bodied candle, to form before pulling the trigger is advised] stop loss: ideally beyond the candle's wick).
GBP/USD
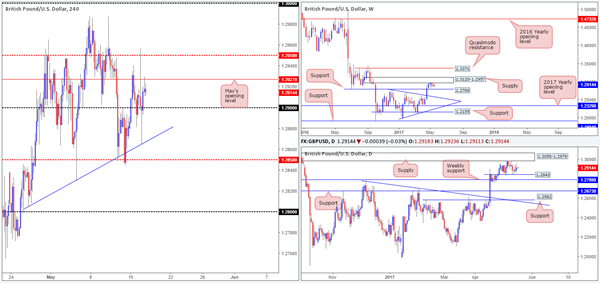
Overall, yesterday's UK inflation figures came in better than expected. Despite this, the pair failed to sustain gains beyond the H4 mid-level resistance at 1.2950 and tumbled to a low of 1.2865, bouncing nicely off of a H4 trendline support taken from the low 1.2804.With the H4 candles currently responding to the underside of May's opening level at 1.2927, we could be looking at another test of the 1.29 handle today, or even possibly the trendline support again.
The bigger picture shows weekly price to be trading around the underside of a supply base at 1.3120-1.2957, which eventually could force the unit to retest support at 1.2789. Meanwhile, daily flow is seen loitering mid-range between support at 1.2843 and supply penciled in at 1.3058-1.2979.
Our suggestions: Neither a long nor short seems attractive at the moment.
In view of how close the 1.29 handle is and the aforementioned H4 trendline support, this is not really a market we want to be shorting today. In regards to longs from 1.29, we would also steer clear. Pressure from weekly sellers, coupled with May's opening level lurking above, followed closely by 1.2950, is enough to suggest that buying may not be a good path to take.
Data points to consider: UK employment figures at 9.30am GMT+1.
Levels to watch/live orders:
- Buys: Flat (stop loss: N/A).
- Sells: Flat (stop loss: N/A).
AUD/USD
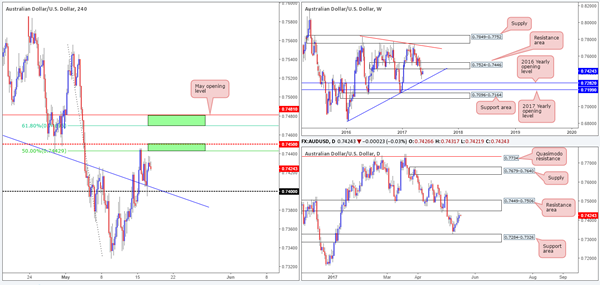
In the early hours of yesterday's segment, the RBA released its latest meeting minutes. The bank highlighted concern regarding the housing market bubble which in turn saw the Aussie decline in value, eventually bringing the unit down to the 0.74 handle which happens to merge with a H4 trendline support etched from the low 0.7475. The bounce from this number was solid and helped the pair record its fifth consecutive daily gain! While this is considered a bullish cue on this scale, it's advised to remain cognizant of the overall picture here. The weekly timeframe shows price recently touched base with the underside of a resistance area at 0.7524-0.7446, which has been in motion since mid-2016. In addition to this, the daily timeframe also reveals that price came within touching distance of a resistance area at 0.7449-0.7506.
Our suggestions: With the bigger picture in mind, our team has absolutely no interest in buying this market today. In fact, we're more drawn to shorts at the moment and have two areas of interest in focus:
The H4 mid-level hurdle at 0.7450/50.0% retracement at 0.7442. This small area represents the underside of both the aforementioned daily and weekly resistance areas.
May's opening level at 0.7481/H4 61.8% Fib resistance at 0.7470. This zone is actually planted within the above said higher-timeframe areas.
To take advantage of these barriers, we would strongly recommend patiently waiting for price action to confirm seller interest beforehand. Waiting for a reasonably sized H4 bearish candle to form, preferably a full-bodied candle, would be ideal.
Data points to consider: No high-impacting news on the docket today.
Levels to watch/live orders:
- Buys: Flat (stop loss: N/A).
- Sells: 0.7450/0.7442 ([waiting for a reasonably sized H4 bear candle, preferably a full-bodied candle, to form before pulling the trigger is advised] stop loss: ideally beyond the candle's wick). 0.7481/0.7470 ([waiting for a reasonably sized H4 bear candle, preferably a full-bodied candle, to form before pulling the trigger is advised] stop loss: ideally beyond the candle's wick).
USD/JPY
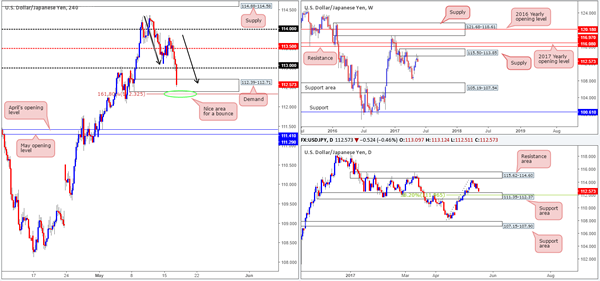
Beginning with a look at the weekly timeframe this morning, it's clear that the bears are beginning to make an appearance around supply at 115.50-113.85. Should this area hold firm, the next downside target, apart from the weekly low of 108.13, is the support area coming in at 105.19-107.54. Daily price on the other hand, shows us that the unit is trading within touching distance of a support area at 111.35-112.37, which happens to hold a 38.2% Fib support at 111.96 marked from the low 108.13.
Over on the H4 chart, we can see price recently breached the 113 handle and is now seen testing the H4 demand base coming in at 112.39-112.71. What's also notable from a technical perspective is the 1:1 correction (black arrows) and the 161.8% Fib ext. at 112.32 taken from the high 114.36.
Our suggestions: Although weekly action is currently trading from supply right now, there's still a reasonable chance that price will bounce from the daily support area. The above noted 161.8% H4 Fib ext. is attractive for longs due to it sitting within the daily support base. Entering long using a pending order here, however, would be chancy given the weekly picture. For this reason, we're going to sit on our hands and patiently wait for additional confirmation in the form of a reasonably sized H4 bullish candle (preferably a full-bodied candle) before pulling the trigger.
Data points to consider: No high-impacting news on the docket today.
Levels to watch/live orders:
- Buys: 112.32 region ([waiting for a reasonably sized H4 bull candle, preferably a full-bodied candle, to form before pulling the trigger is advised] stop loss: ideally beyond the candle's tail).
- Sells: Flat (stop loss: N/A).
USD/CAD
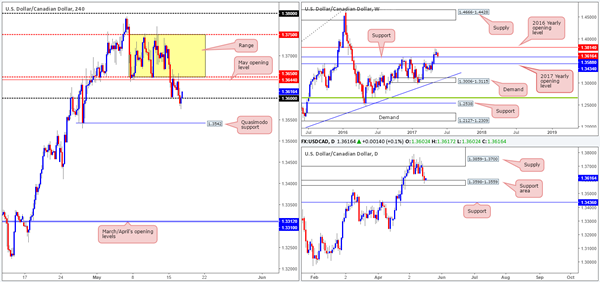
In recent sessions, the USD/CAD connected with not only a weekly support level at 1.3588, but also a daily support area drawn from 1.3598-1.3559. For those who read Tuesday's report you may recall that our team mentioned to watch for a possible whipsaw through the 1.36 number for a possible long, which, as you can see, happened not too long ago!
Nevertheless, it looks like we've missed the boat on this one unfortunately. Well done to any of our readers who managed to jump aboard here, as its likely H4 price will look to trade back into the range fixed between 1.3750/1.3650.
Our suggestions: We're slightly upset that we missed this entry, but all may not be lost here. The next best option we have is waiting for a decisive H4 close above 1.3650. Should this come to fruition and follow up with a retest of this number and a reasonably sized H4 bull candle, preferably a full-bodied candle, we'd look to long this market, targeting the upper edge of the H4 consolidation.
Data points to consider: Canadian Manufacturing sales at 1.30pm and US Crude Oil inventories at 3.30pm GMT+1
Levels to watch/live orders:
- Buys: Watch for a H4 close above 1.3650 and then look to trade any retest of this number thereafter ([waiting for a reasonably sized H4 bull candle, preferably a full-bodied candle, to form following the retest before pulling the trigger is advised] stop loss: ideally beyond the candle's tail).
- Sells: Flat (stop loss: N/A).
USD/CHF
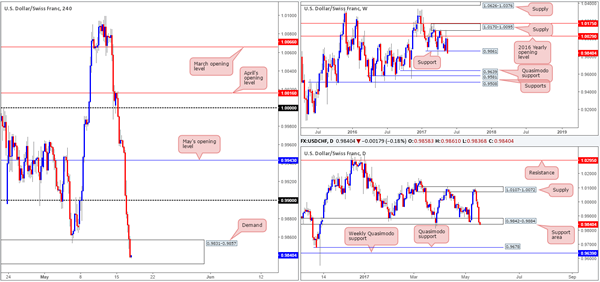
Recent action shows that the USD/CHF extended Monday's downside move. Intensified by weak US housing data, the pair ended the day crashing into a H4 demand base coming in at 0.9831-0.9857. At the time of writing, the bulls are struggling to generate anything noteworthy from this zone, which could imply that further selling may be on the cards down to the 0.98 handle today.
Spinning over to the bigger picture, the daily support area at 0.9842-0.9884, which happens to hold the weekly support level at 0.9861 within, is under pressure. A decisive (daily) close beyond this hurdle would likely place the daily Quasimodo support at 0.9678 in view, followed closely by weekly support penciled in at 0.9639.
Our suggestions: While we cannot entirely discount the bulls just yet, the upside is not looking favorable at the moment. Just as challenging though would be to sell the break of the current H4 demand area, since the 0.98 handle is located a mere thirty pips away! This leaves little wiggle room for a trade unless you manage to find a setup with a tight stop. With that in mind, we'll remain on the sidelines for the time being and look to reassess going into Thursday's open.
Data points to consider: No high-impacting news on the docket today.
Levels to watch/live orders:
- Buys: Flat (stop loss: N/A).
- Sells: Flat (stop loss: N/A).
DOW 30
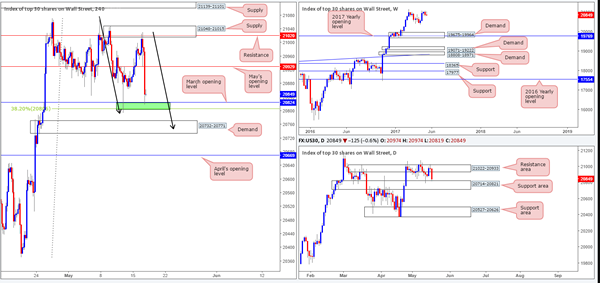
During the course of yesterday's sessions, the DOW challenged the H4 supply at 21048-21015 (holds a H4 resistance at 21020 within). The reaction from this zone, as you can see, was beautiful! The momentum from this area forced the H4 candles below May's opening level at 20929 and jabbed into a small area of support formed by March's opening level at 20824/38.2% Fib support at 20806 (green area).
Of particular interest here is the fact that this H4 green zone is bolstered by a daily support area coming in at 20714-20821 which has been in motion since early March. However, before looking to try and long from here, make sure to take note of the 1:1 correction (see black arrows) that terminates within a H4 demand seen below at 20732-20771, which is also positioned INSIDE the said daily support area.
Our suggestions: Although the market has shown interest at 20806/20824, we're drawn to the said H4 demand sitting below, due to the possible 1:1 correction! Our team has collectively decided to take an aggressive stance here and place a pending buy order at 20750 and place a stop at 20710. We'll look to reduce risk to breakeven and liquidate 50% of our position at 20824.
Data points to consider: No high-impacting news on the docket today.
Levels to watch/live orders:
- Buys: 20750 ([pending order] stop loss: 20710).
- Sells: Flat (stop loss: N/A).
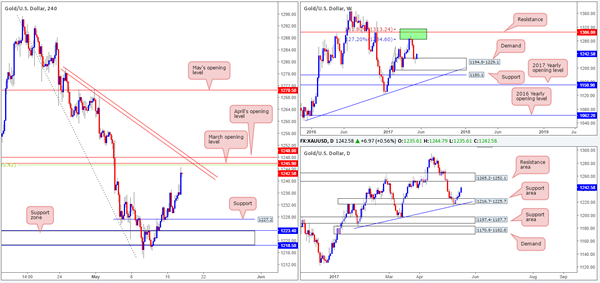
GOLD
With the continual depreciation being seen in the US dollar, it's no surprise to see the yellow metal printing advancing candles. As of current price, the technicals show weekly bulls advancing from demand at 1194.8-1229.1, and daily price showing room to advance further up to a resistance zone pegged at 1265.2-1252.1.
On the H4 chart, however, we have an extremely attractive resistance area planted just ahead of current price. It is comprised of March/April's opening levels at 1245.9/1248.0, a H4 trendline resistance taken from the high 1278.0 and a 38.2% Fib resistance at 1245.4 (green line) drawn from the high 1295.4. So, the question is, would you be comfortable shorting from here knowing that you're potentially going up against higher-timeframe buyers?
Our suggestions: In light of the H4 confluence surrounding the 1245.0 region, our team does expect a bounce to be seen. We would, if we're able to pin down a lower-timeframe sell signal here, consider selling this market. However, we must stress that we'd adopt incredibly aggressive trade management, since getting caught on the wrong side of higher-timeframe flow will not likely end too well for your account!
Levels to watch/live orders:
- Buys: Flat (stop loss: N/A).
- Sells: 1245.9 region ([waiting for a lower-timeframe confirming signal to form is advised [see the top of this report] stop loss: dependent on where one confirms this area).
Daily Technical Analysis: EUR/USD Breaks Above 1.10, USD/JPY Confirms Bearish ABC
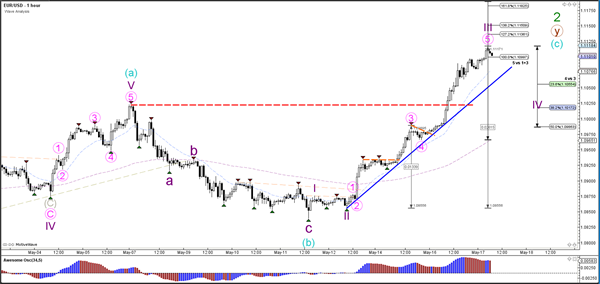
Currency pair EUR/USD
The EUR/USD broke yesterday's Fibonacci resistance levels and resistance trend lines (dotted red) which was an invalidation level for the bears and a confirmation level for the bulls. The wave count is now reflecting the bullish structure with an ABC (blue). Price is already attempting to break a bigger Fib (78.6%), which could indicate a continuation potential to the 88.6% at 1.1190.
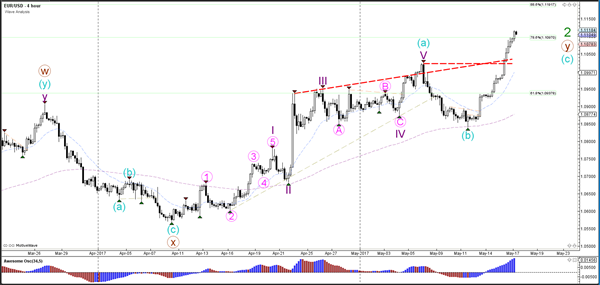
The EUR/USD broke above the resistance trend lines (dotted orange) and extended the bullish momentum. The strength of the impulse is indicating that the current push up is most likely a wave 3 (purple) which might be even completed yet. Price could move towards the Fibonacci targets first of wave 5 (pink) but eventually a wave 4 and 5 (purple) seem likely.
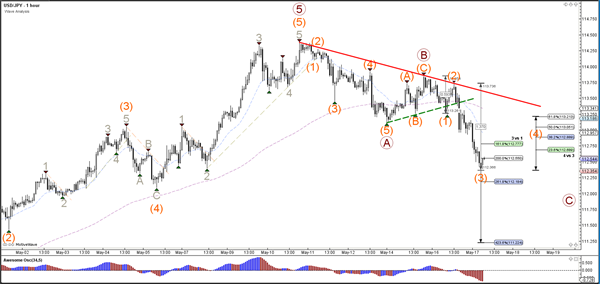
Currency pair USD/JPY
The USD/JPY indeed is completing an ABC (brown) zigzag correction as expected at the beginning of this week. Price is moving towards the Fibonacci targets of wave C (brown).
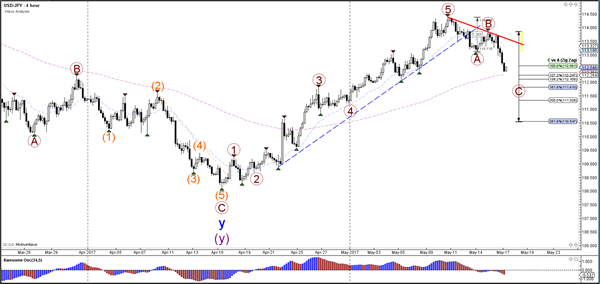
The USD/JPY is building a wave 3 (orange), which could potentially still see further bearish extensions towards the Fibonacci targets of wave 3 (orange). A wave 4 (orange) correction is expected when the wave 3 is completed.
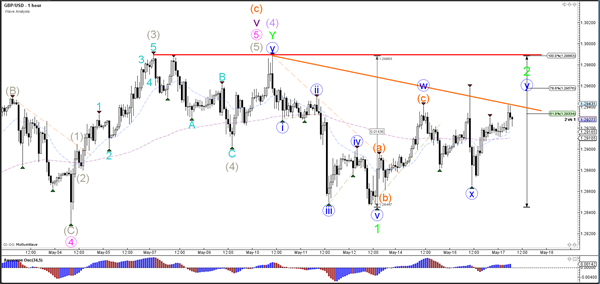
Currency pair GBP/USD
The GBP/USD stopped at the 78.6% Fibonacci level of wave 2 (green). A break below the support trend line (green) could start a larger bearish correction whereas a break above resistance (orange) could see price make a bullish break. The bullish break however would probably create double divergence.
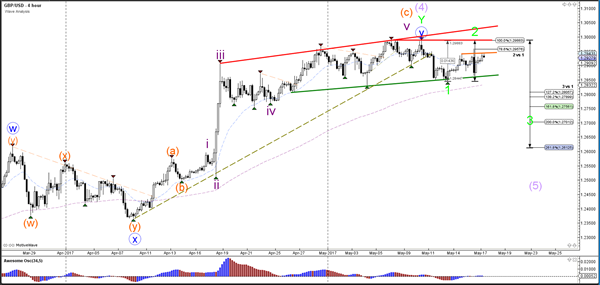
The GBP/USD break above the 100% Fib invalidates the wave 2 (green) structure and confirms a bullish continuation potential for one more push higher.
European Open Briefing: US Equity Futures Declined Overnight
Global Markets:
- Asian stock markets: Nikkei down 0.60 %, Shanghai Composite lost 0.05 %, Hang Seng fell 0.10 %, ASX 200 declined 0.95 %
- Commodities: Gold at $1243 (+0.60 %), Silver at $16.90 (+0.90 %), WTI Oil at $48.20 (-0.90 %), Brent Oil at $51.20 (-0.85 %)
- Rates: US 10-year yield at 2.30, UK 10-year yield at 1.14, German 10-year yield at 0.43
News & Data
- South Korea Export Price Index (YoY) Apr: 8.7%, Prior (Revised 5.0%)
- South Korea Import Price Index (YoY) Apr: 9.3%, Prior (Revised 6.8%)
- New Zealand PPI Input (QoQ) Q1: 0.8%, Prior (1.0%)
- New Zealand PPI Output (QoQ) Q1: 1.4%, Prior (1.5%)
- Japan Machine Orders (MoM) Mar: 1.4%, Est. (2.10%), Prior (1.50%)
- Japan Machine Orders (YoY) Mar: -0.7%, Est. (0.60%), Prior (5.60%)
- PBoC Fixes USDCNY Reference Rate At 6.8635 (prev fix: 6.7890)
- U.S. stock futures, dollar fall on rising concerns on Trump – RTRS
Markets Update:
US equity futures declined overnight following the leak of a memo in which US President Trump asked the former FBI chief to end a probe into his former national security advisor Flynn. Worries about Trump administration could put stock markets worldwide under pressure. Investors are hoping for a large tax reform, but with Trump facing increasing criticism and internal conflicts, the odds are decreasing.
USD/JPY fell below 113 support and traded as low as 112.40 so far. Next support is seen at 112. Should the pair break below it, a deeper correction to at least 110.50 seems likely.
Meanwhile, the outlook for the Euro remains positive. EUR/USD has cleared resistance at 1.1020 and extended gains to 1.1115. Should it break above 1.1150 resistance, a rally towards 1.13 seems likely.
USD/CAD is also looking increasingly bearish following the break below 1.36 support. With the Dollar under pressure and oil prices rising again, USD/CAD is likely to extend losses in the near-term. The next key support level now lies at 1.3450.
Upcoming Events:
- 09:30 BST – UK Claimant Count Change
- 09:30 BST – UK Unemployment Rate
- 10:00 BST – Euro Zone CPI
- 15:30 BST – US Crude Oil Inventories
Gold Nearing A Key Bullish Turning Point
Key Points:
- Gold rallies from supporting trend line.
- Key inflection point looming with price converging on 100 and 50 MA’s.
- Watch for a bounce back towards $1263.48 an ounce.
The past 24 hours has seen Gold rally to a key medium term inflection point as the metal’s price action closes in on a bullish cross of the moving averages. It would appear that the metal might have finally discovered some key support which, unsurprisingly, appears to have been right on a supporting trend line. Subsequently, we could be about to see some resurgence in gold prices in the coming days.
In fact, price action on the daily charts is potentially spelling out the metals near term trend. Price appears to have discovered some support around the $1214.09 an ounce mark and, subsequently, has rallied over the past week. At the same time, the 100 and 50MA’s are converging at the same location and something is definitely getting ready to break. In addition, the RSI Oscillator has finally clawed its way out of oversold territory and is now trending higher and still has plenty of room to run on the upside. Subsequently, there are plenty of technical reasons to suggest that the metal is about to break above the 100 day MA and start a sharp rally towards our interim target of $1263.48 an ounce.
Also, from the fundamental perspective, there is some weakness becoming apparent within the U.S. Domestic economy of late. In particular, the latest round of Building Permits and Housing Starts proved to be relatively flat and, subsequently, saw sentiment swinging against the greenback. Additionally, the Q1 GDP results proved relatively disappointing and there is some evidence of sliding consumer sentiment whilst inflation is still largely absent. Subsequently, there is a building case for the Federal Reserve to potentially hold off on any further rate hikes until we have the Q2 GDP results to review. This obviously bodes well for precious metals markets given that much of the downward pressure has been the pricing in of the central bank’s forward guidance on rates.
Ultimately, Gold is likely to undergo resurgence in the coming session given the aforementioned technical and fundamental factors. Currently, the air is coming out of the Dollar and we should start to see capital flows back into safe havens given the rising political risk within America. Subsequently, watch for a sharp break above the 100MA before a steady bid takes the metal higher towards our target at $1263.48.
Elliott Wave View: FTSE Index Ending A Cycle
Short Term Elliott Wave view in FTSE Index suggests the rally from 4/20 low (7096.6) is unfolding as a zigzag Elliott Wave structure where Minute wave ((a)) ended at 7302.57 and Minute wave ((b)) ended at 7197.28. Subdivision of Minute wave ((a)) is unfolding as an impulse where Minuttte wave (i) ended at 7134.53, Minutte wave (ii) ended at 7104.22, Minutte wave (iii) ended at 7290.82, Minutte wave (iv) ended at 7262.32, and Minutte wave (v) of ((a)) ended at 7302.57. FTSE Index has since broken above 7302.57 suggesting Minute wave ((c)) has started.
Minute wave ((c)) is currently in progress as an ending diagonal where Minutte wave (i) ended at 7280.7, Minutte wave (ii) ended at 7222.81, Minutte wave (iii) ended at 7460.20, and Minutte wave (iv) ended at 7435.64. Index has reached 1.618 extension of the Minute ((a)) – ((b)) and thus cycle from 4/20 low is mature and Minor wave 1 can be called completed at 7533.7. Expect FTSE Index to correct cycle from 4/20 low soon within Minor wave 2 in 3, 7, or 11 swing before the rally resumes. We don’t like selling the proposed pullback and expect buyers to appear again when Minor wave 2 pullback is over in 3, 7, or 11 swing.
FTSE Index 1 Hour Elliott Wave Chart
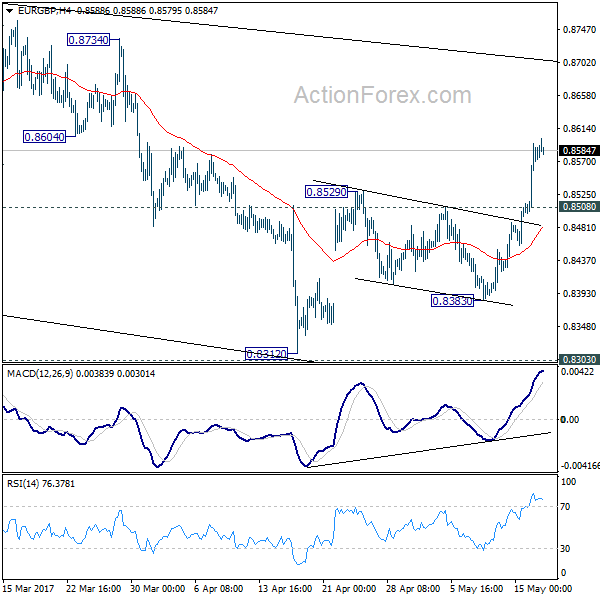
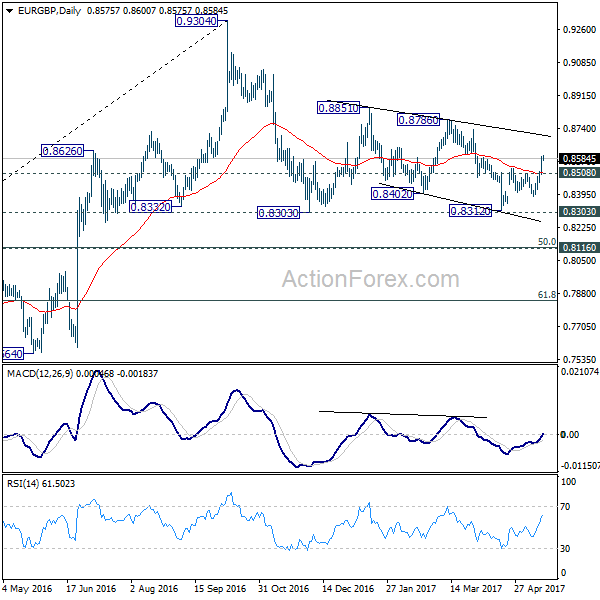
EUR/GBP Daily Outlook
Daily Pivots: (S1) 0.8520; (P) 0.8557; (R1) 0.8616; More...
Intraday bias in EUR/GBP remains on the upside as the rebound from 0.8312 continues. Further rally would be seen to 0.8786 resistance next. Overall, price actions 0.9304 are viewed as a medium term corrective pattern that is extending. As EUR/GBP has just defended 0.8303 resistance. Break of 0.8786 could bring a retest on 0.9304 high. On the downside, below 0.8508 minor support will turn bias neutral and bring retreat first.
In the bigger picture, price actions from 0.9304 are viewed as a medium term corrective pattern. In case of deeper fall, we'd expect strong support from 0.8116 cluster support (50% retracement of 0.6935 to 0.9304 at 0.8120) to contain downside. Rise from 0.6935 (2015 low) will resume at a later stage to 0.9799 (2008 high). However, sustained break of 0.8116 could bring deeper decline to next key support level at 0.7564 before the correction completes.