Sample Category Title
Gold Analysis: Stretches Further Up
'The rise in gold is largely a dollar play, with the dollar weakening because of Trump. There's still more downside risk to gold in the long run, but in the short-term, given what the North Koreans are doing and what Trump is doing, the dollar is inherently weak.' – Oversea-Chinese Banking Corp. (based on Bloomberg)
Pair's Outlook
The XAU/USD cross has been recovering since it touched the broadening rising wedge's support line one week ago. Gold has little room left before it could be forced to make a potential U-turn, as there is a substantial resistance cluster located around 1,246.50, formed by the monthly S1, the weekly R2, the 20, 55 and 200-day SMAs. A successful breach of this resistance is likely to allow the yellow metal to keep appreciating until the 10-month down-trend could be reached. Assuming this down-trend is overcome, the metal would have the potential to approach the wedge's resistance, but that all depends on this week's performance.
Traders' Sentiment
Today 54% of all open positions are long (previously 52%), whereas 66% of all pending orders are to buy the gold.
USD Hit Post Election Low On Trump’s Russia Leak Scandal
It was widely reported that President Trump shared highly sensitive information with the Russia Ambassador at a recent meeting at the White House putting further pressure on USD. During today's early European session the dollar index hit the lowest level of 97.74 last seen November 09 2016, EUR/USD traded as high as 1.1121 a level last seen November 09 2016. In line with the continued weakness in USD, spot gold had a fifth day of gains trading at a 2-week high of 1244.91.
To date the dollar index has almost given up all of the post presidential election rally, retracing about 1.4% over the past 4 trading sessions. Per CFTC data (Commodity Futures Trading Commission), Hedge funds' USD long positions have reduced to the lowest level since August 2016.
Japanese Q1 GDP first reading will be released at 00:50 BST on Thursday. The Japanese economy has seen a recovery since last year. The global economy also saw a recovery, helping exports. However, as inflation has not yet seen a stable upswing the Japanese economic recovery is still fragile. The performance of the Q1 GDP will likely affect JPY and the JPY crosses.
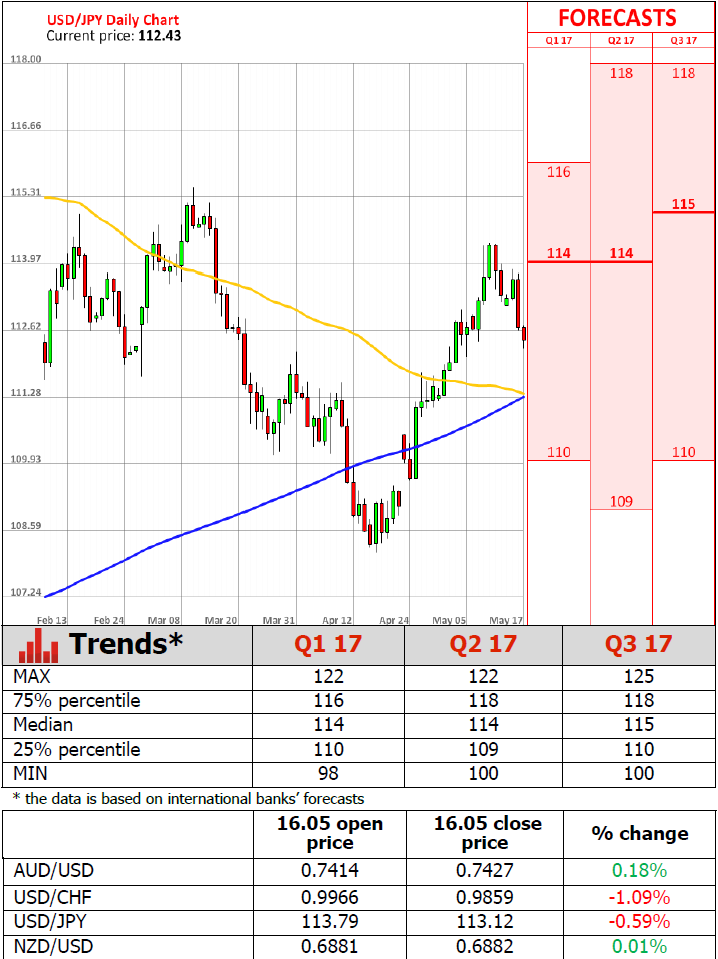
USD/JPY has retraced in the past week as a result of the weakening of USD. USD/JPY hit a 1-week low of 112.24 on Wednesday during early European session.
There are two upcoming events that will likely affect oil markets; firstly, the Iran presidential election will be held this Friday, May 19th and secondly the OPEC meeting will be held on May 25. The result of the Iran presidential election and the associated geo-political risks will likely affect its oil supply. Iran has greatly increased its oil output after the US sanction was removed.
The US shale oil industry has seen a marked recovery since February last year because of higher oil prices. The US Baker Hughes data (that records the number of new Oil Rigs) is showing additional Rigs added every week. The increase in shale oil supply has offset OPEC's recent output cut effort to an extent.
However, the Saudi Arabia Oil Minister, Khalid al-Falih, stated on May 8th at the Asia Oil and Gas Conference in Malaysia that “the output cut could be extended another 6 months or even further into 2018”. OPEC will hold a meeting in Vienna on May 25 where the decision whether to extend the output cut agreement will likely be announced.
Oil prices have retraced substantially around 12.88% since April 12th and have experienced a 3.74% rebound since May 5th. Last Wednesday's EIA crude oil inventory data saw a drop of 5.247 million barrels hitting the lowest level this year helping push oil prices higher.
WTI and Brent crude oil will likely see selling pressure at $50 and $53 respectively. The US EIA Crude Oil Inventories data (for the week ending May 12) will be released at 15:30 BST this afternoon. Please be advised that this release is likely to cause significant volatility in oil prices.
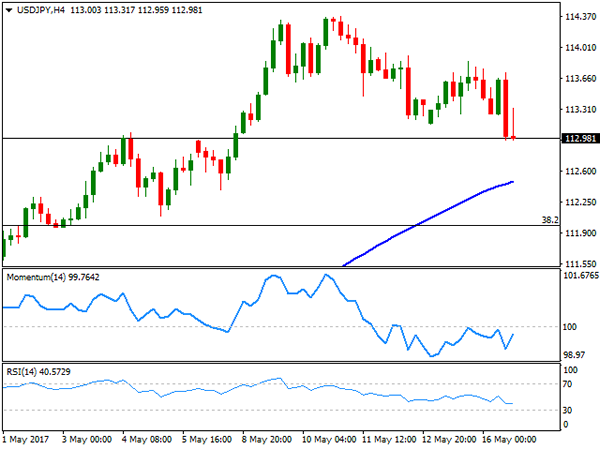
Technical Outlook: USDJPY – Weaker Dollar On Political Turmoil In The US Eyes Strong Supports At 112.00 Zone
The pair remains in red for the second day and broke below strong support at 112.86, provided by 100SMA, in extended bearish acceleration after political turmoil in the US negatively impacted the dollar.
Break below another support at 112.67 (broken Fibo 61.8% of 115.49/108.11 descend) and penetration into daily cloud (cloud top lies at 112.54), sees risk of further weakness.
Bears are looking for extension towards strong supports at 112.00 zone (rising 20SMA at 112.12 and Fibo 38.2% of 108.11/114.36 recovery rally at 111.97) which is expected to ideally contain correction of larger uptrend and keep overall bulls in play.
Slow stochastic on daily chart in steep descend and approaching oversold zone that supports scenario of pausing current bear-leg and fresh recovery attempts.
Former strong supports at 113.30/112.86 (10SMA / 100SMA) now act as pivotal barriers, break above which is needed to confirm reversal.
Otherwise, increased downside risk could be expected on firm break below 112.00 handle for extension of pullback from 114.36 towards 111.25 (30SMA/ daily Kijun-sen) and 110.50 (Fibo 61.8% of 108.11/114.36 rally).
Res: 112.67, 112.86, 113.25, 113.75
Sup: 112.12, 111.97, 111.56, 111.25
Greenback Continues To Slip Amid Political Turmoil
The greenback extended its recent losses yesterday, amid renewed political turmoil in Washington DC. The latest media reports suggest that President Trump asked former FBI Director Comey to drop an investigation regarding ties between Trump's prior security advisor Michael Flynn and Russia. Considering that Trump recently fired Comey, this development raises a lot of questions, and thus uncertainty for investors. Can the President be impeached over this? Even if not, does this diminish some of Trump's political capital, thereby making it less likely that he manages to push his tax-reform agenda through Congress?
Thus, will the dollar continue to feel the heat of all this turmoil?
In our view, even though we may see the greenback recovering some of its losses today following its sharp tumble, we think that it is likely to remain on the back foot over the next few days. This view is supported by the fact that there are no major US indicators on the economic calendar this week, and very few Fed speakers to distract market participants from the political front. Our favorite proxy for further USD weakness remains EUR/USD, bearing in mind the continued strength in Eurozone data, and speculation that the ECB may appear slightly more optimistic at its upcoming meeting in June.
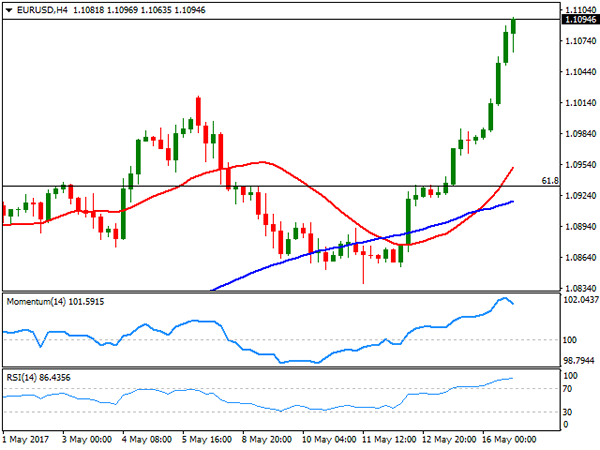
EUR/USD surged yesterday, breaking above the psychological zone of 1.1000 (S2). At the time of writing, the rate looks to be headed for a test near the 1.1130 (R1) resistance zone, where a clear breach is possible to pave the way for our next obstacle of 1.1240 (R2). Nevertheless, given that the rally appears too steep, we would stay mindful that a corrective setback may be on the cards before the bulls decide to take charge again.
USD/JPY tumbled and fell below the support (now turned into resistance) of 113.10 (R1). Now, the rate is testing the 112.35 (S1) support obstacle, which lies slightly above the upper bound of the medium-term downside channel that contained the price action from December until the beginnings of May.
Although we expect the dollar to remain weak against the euro, here we prefer to stay neutral for now as there is the possibility of a rebound from near the aforementioned line. We prefer to wait for a dip below 111.90 (S2) before we get confident on larger bearish extensions. Something like that will bring the pair back within the abovementioned channel and is possible to initially aim for the 111.00 (S3) support zone.
Today's highlights:
During the European day, the UK employment data for March are coming out and the forecast is for the unemployment rate to have held steady. Average weekly earnings excluding bonuses are expected to have risen at the same pace as previously, while the figure including bonuses is forecast to have accelerated. Our own view is that both of the earnings rates may have risen, considering the UK services PMI for the month, which showed that firms reported stronger salary pressures. In case nominal UK wages accelerate, real wages could turn back positive given the steady inflation rate during the month.
Something like that could ease some of the BoE's concerns regarding falling real wages and thereby bring GBP under renewed buying interest.
In Eurozone, the final CPI for April is due out, but as the final figure is expected to confirm the preliminary estimate, the reaction in EUR may remain muted.
From Canada, we get manufacturing sales for March. The forecast is for a rebound, something that may support CAD somewhat.
We have only one speaker on the agenda: BoE MPC member Andy Haldane.
EUR/USD
Support: 1.1070 (S1), 1.1000 (S2), 1.0960 (S3)
Resistance: 1.1130 (R1), 1.1240 (R2), 1.1300 (R3)
USD/JPY
Support: 112.35 (S1), 111.90 (S2), 111.00 (S3)
Resistance: 113.10 (R1), 113.80 (R2), 114.35 (R3)
Equities Softer Following The Temptation Of Trump
Asian and European equity indices are lower on yet more alleged U.S. political concerns, but this may not be the real story.
Another day another potential scandal coming out of Washington D.C. This time the President has allegedly spilt intelligence to the Russians and has Trumptation'ed allegedly, the now ex FBI Director into dropping their investigation of ex-National Security Advisor Flynn's ties with Russia. The street has blamed 'alleged fatigue' on the fall of the U.S. Dollar which is slightly unfair to Mr.Trump.
I would agree the constant train of gaffs is eroding his support in Congress and making it ever harder to enact his legislative agenda including tax reform. The real reason for the U.S. Dollars demise and the weakening of equities from near record highs the day before is much simpler. Most U.S. data of late has consistently come in below expectations, including yesterday's Housing Starts numbers. This is mollifying expectations on the Federal Reserve rate hike front, and with European data, in particular, coming in consistently stronger, U.S yields have been dropping, and the yield spread differentials have closed up.
Secondly, oil prices were crushed last night on higher than expected API Crude Inventories undoing much of the OPEC-led 'forward guidance' rhetoric of the last few days. Combined with breathtaking levels in most equity indices it probably wouldn't have taken a lot to see traders rush to take some risk of the board and flip into other G-10 currencies and gold.
Following the sell-off in the S and P mini in early Asia, regional bourses have followed suite with Europe likely to do so initally as well.
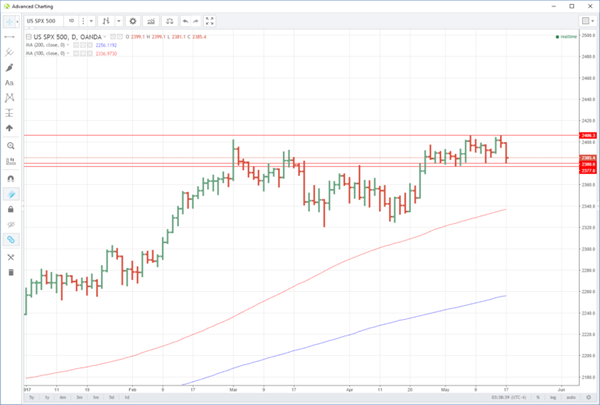
S&P 500
The S&P has now formed a double top on the daily charts at 2406 with a total of five failures in the 2400/2406 area. In the near term this all time high will form fairly solid short-term resistance against a backdrop of political uncertainty in the U.S,
The index hovers just above a triple bottom at 2380 and then a double bottom at 2377. From a technical perspective, a close below the latter could open up a correction to the 100-day moving average sitting in the 2337 region.
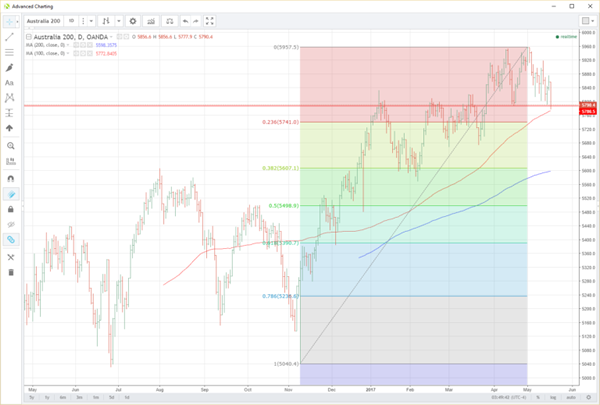
ASX 200
The resource-heavy ASX has followed the lead of the S&P today, helped along by lower oil prices. The index closing down 0.8% for the session. It seems to be open hunting season for the large domestic banks in Australia at the moment as well with calls for an enquiry into their lending rate setting processes following on from the 'levy' they received in the recent Federal budget. The four majors have a very large weighting in the ASX and could continue to provide headwinds for the index, in general, going forward.
The ASX closed near its lows at 5787 which is right on the double bottom support level on the daily chart and just above the 100-day moving average at 5773, which it just avoided closing below. A break here could open up a move to the 23.6% Fibonacci retracement at 5741. Beyond this, the next support appears in the 5670 area.
Resistance is at today's open at 5857 followed by 5920 and 5960.
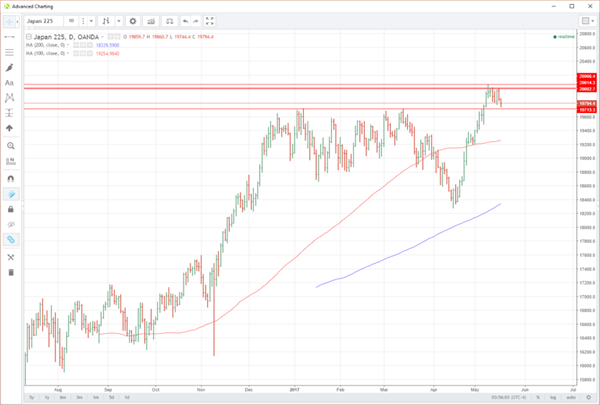
Nikkei 225
Another to finish precariously perched above support. The Nikkei has followed USD/JPY lower over the course of the day to finish 0.60% down as a stronger Yen leads to the selling of exporter facing sectors in the index.
The Nikkei is floating just above the short term pivot level of 19,713, a previous triple top. A close below heard could set the tone for a move lower to the area of the 100-day moving average at 19,255.
Resistance is stacked above at the psychological 20,000 level with the 9th May high at 20,014 just behind.
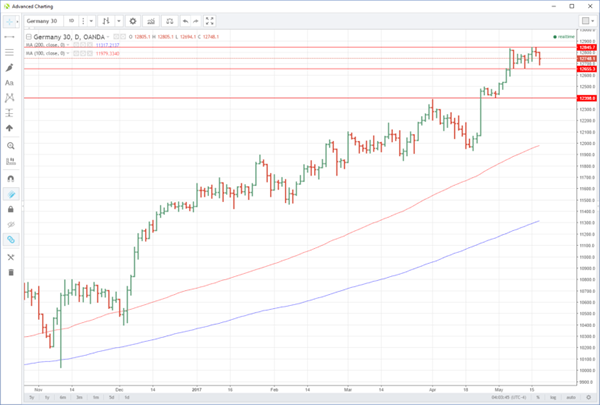
DAX 30
The German Dax 30 is the darling of global stock markets at the moment. The primary beneficiary of much improved European data and a heavy rotation of money from the U.S. Dollar into the Euro. It would be a brave man to pick the top in the DAX in the medium term looking at the daily chart. However in the short term at least, following on from the U.S. overnight the technical picture is a little more cloudy.
We have a triple top in place now around the all-time high of 12,845 which may prove a tough nut to crack in the near term.
Support rests at the nearby double bottom at 12,655 with a daily close below implying a possible move to the 12,400 regions.
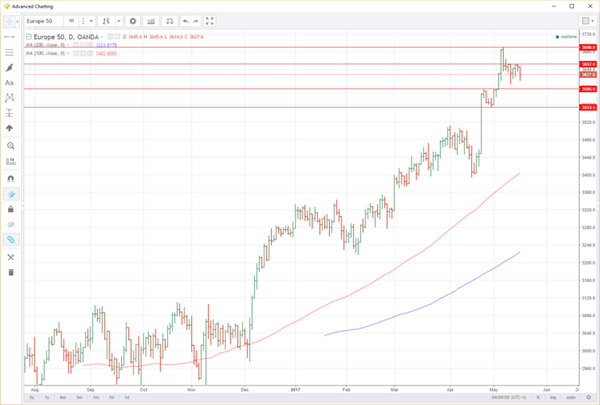
Euro Stoxx 50
Another index that only a brave man would try to pick the absolute highs on in the medium term based on the charts. However, it to had a rather more clouded short term picture.
Resistance lies above at 3652 which has multiple failures in the last week. Above here, the 18-month high at 3690 provides another level of resistance.
Support lurks just below at 3595 followed by the March low at 3553. A close below the latter could imply a deeper correction is on the cards.
Summary
Whilst the latest temptations of Trump episode is blamed for today's U.S. Dollar weakness and the sell-off in the major stock indices, this may be a case of fitting the latest news to the price action. Consistently weaker U.S. data, falling U.S. yields and a narrowing of the rate differentials is far more likely to be the underlying cause.
Admittedly the constant stream of 'news' from Washington D.C. and its longer term effect on enacting economic policy will no doubt hurt sentiment. However, from a purely technical perspective, the real reason may be as simple as most major indices forming short-term topping patterns anyway over the last week meaning traders don't need a lot of excuses to head for the exit door with stocks at such elevated levels.
British Consumer Inflation Rises More Than Expected Last Month
'We remain convinced that the market is underestimating the further upside for inflation from here.' - Alan Clarke, Scotiabank
UK consumer inflation climbed more than expected last month amid the sharp fall in the value of the Pound caused by Britain's decision to leave the European Union. The Office for National Statistics reported on Tuesday that its CPI rose 2.7% on an annual basis in April, following the preceding month's gain of 2.3% and surpassing analysts' expectations for a 2.6% increase. British inflation is set accelerate further due the recent rebound in oil prices and the weak Sterling. In the meantime, core consumer prices advanced 2.4% in April, up from the prior month's 1.8% climb and above forecasts for a 2.2% rise. Later in the day, the Labour Party pointed to rising inflationary pressures, promising voters to lower oil prices and boost wage growth. Despite the post-Brexit vote pickup in inflation, the Bank of England left its monetary policy and key interest rates unchanged last week, claiming that were no signs of overheating in the economy. April's inflation climb was mainly driven by higher airfares, influenced by the timing of the Easter holiday. However, apparel, car taxes, food prices and the weak Pound also fuelled inflation pressures.
US Homebuilding Activity Slows In April But Data Hints At Rebound, Industrial Output Rises 1.0% Last Month
'There is not much to complain about the economy as housing and manufacturing are improving and the labor market remains tight. The economy is getting stronger.' - Joel Naroff, Naroff Economic Advisors
US homebuilding activity dropped in April; however, revisions of the preceding month's readings suggested that homebuilding activity continued improving. The Census Bureau reported on Tuesday that housing starts declined 2.6% to a seasonally adjusted annual pace of 1.17M units last month, following March's upwardly revised 1.28M-unit pace and falling behind expectations for a 3.7% rise to a 1.26M-unit pace. Analysts suggested that a slowdown in homebuilding activity had been driven by unusually rainy weather in California. On an annual basis, housing starts were up 10.5% compared to the same period a year ago. Meanwhile, building permits fell 2.5% to a seasonally adjusted pace of 1.23M units, whereas analysts anticipated a slight climb of 0.2% to a 1.27M-unit pace in April. With building permits higher than housing starts, homebuilding activity is set to rebound in the upcoming months. Later in the day, the Federal Reserve reported that industrial production in the United States rose 1.0% in April, the largest gain since February 2014, while analysts expected industrial output to climb just 0.4%.
Dairy Product Prices Rise For Fifth Consecutive Auction, PPI Climbs 0.8% In March Quarter
'As we head towards the end of our milk production season the volume of product that is available for sale falls away which is supportive of prices.' - Susan Kilsby, AgriHQ
Dairy prices rose for the fifth consecutive time at the latest auction in New Zealand, pointing to a solid recovery. The Global Dairy Trade Price Index climbed 3.2% to an average selling price of $3,313 per tonne after rising 3.6% at the prior GDT auction. Analysts suggested that the 50% price rebound during the past year could be temporary; however, the fifth straight rise erased their doubts over the market's ability to maintain gains. The price of whole milk powder advanced 1.3% to $3,312 per tonne, the butter price surged 11.2% to $5,479 per tonne, whereas prices of anhydrous milk fat jumped 8.2% to $6,631 per tonne. Meanwhile, the butter milk powder price rose 7% to $1,980 per tonne. Prices of lactose, skim milk powder and cheddar climbed 2%, 1% and 0.6%, respectively. According to analysts, the strong price rebound was mainly driven by tightening milk supplies. Later in the day, Statistics New Zealand reported that its Producer Price Index rose 0.8% in the March quarter, following the prior quarter's gain of 1.0% and topping analysts' expectations for a 0.7% increase.
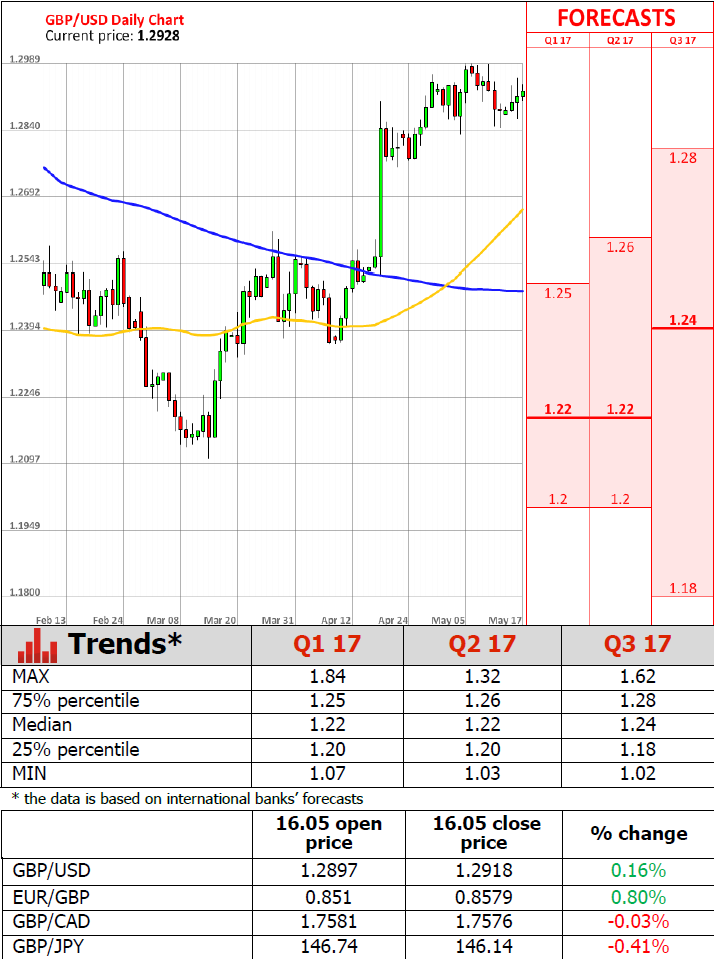
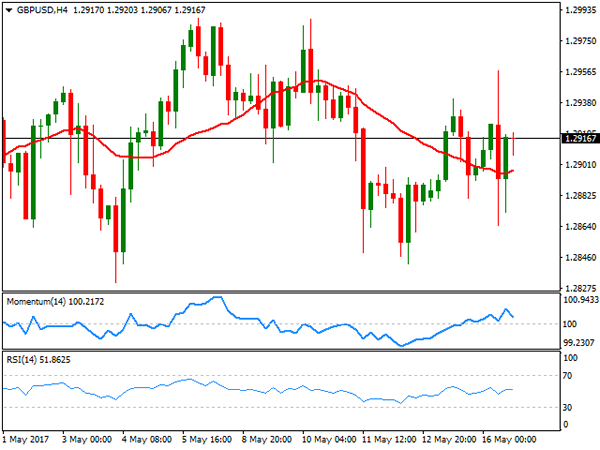
Technical Outlook: Cable – UK Jobs Data Eyed For Fresh Signals
Cable is trading within 1.2900/40 range in early Wednesday's trading after failing to capitalize stronger on Monday's upbeat UK inflation data. The pair spiked to 1.2955 but was unable to sustain gains, closing at 1.2914 (the second daily close below cracked 10SMA pivot). The action remains underpinned by rising 20SMA (currently at 1.2890) and may be dragged higher by fresh strength of the Euro. Bullish technicals are supportive for another attempt at psychological 1.3000 barrier, however, gains may be limited as falling thick weekly cloud heavily weighs on the market. Repeated rejections under 1.3000 pivot and extension below 20SMA would weaken bullish structure and risk retest of lower pivots at 1.2840/30 zone. Sterling is eyeing today's UK jobs data for fresh signals. Unemployment rate is expected to stay unchanged at 4.7% in March, but forecast for Apr jobless claims and average earnings are very good (7.5K f/c vs 25.5K in Mar and 2.4% f/c for Apr vs 2.3% in Mar respectively) and could further support pound on forecasted or better releases.
Res: 1.2940, 1.2955, 1.2986, 1.3000
Sup: 1.2904, 1.2890, 1.2864, 1.2843
Foreign Exchange Market Commentary: EUR/USD, USD/JPY, GBP/USD, GOLD, WTI CRUDE, DJIA, FTSE100, DAX
EUR/USD
EUR/USD's rally extended to fresh 2017 highs this Tuesday, fueled intraday by another batch of soft US data and the scandal surrounding US President Trump, involving classified information being unveiled to Russian diplomats. The news came after Trump fired FBI's director, James Comey, on the back of Russia supposed involvement in the latest election, fueling political unrest in the world's largest economy. Greenback's slide was uneven across the board, yet that the currency is being dropped by investors, is undeniable.
Macroeconomic data released at both shores of the Atlantic backed the rally, as in the EU, preliminary Q1 GDP matched expectations, with economic growth advancing 0.5% in the three months to March, whilst German ZEW survey showed that local business confidence continued to improve in May, although less than market's forecast. The index rose to 20.6 from 19.5 points in the previous month, missing expectations of a rise to 22.0. In the US, housing data surprised to the downside, with building permits down to 1.229M from previous 1.26M, and housing starts also down in April, accounting for 1.172M vs. previous 1.203M. Industrial output, however, improved, up in April by 1.0%, the fastest rate in more than three years.
From a technical point of view, the pair has reached extreme overbought conditions in the short term, but with the price pressuring the daily high, betting on a decline seems too risky. In the 4 hours chart, technical indicators have barely retreated from extreme readings, with the RSI indicator standing at 85, whilst the price accelerated further beyond a bullish 20 SMA. The rally could meet some profit taking on an initial approach to the 1.1100 figure, yet further gains can be expected, as long as the pair holds now above the 1.1000 critical figure.
Support levels: 1.1045 1.1000 1.0965
Resistance levels: 1.1130 1.1180 1.1220
USD/JPY
The USD/JPY pair fell to a fresh 2-week low of 112.96, undermined in the US afternoon by a decline in US yields, which remain a driving force for the safe-haven currency. Treasury yields have been stable for most of the week, but fell in the latest hour following an auction. The 10-year benchmark now stands at 2.33%, down from previous 2.34%, while the 30-year yield retreated to 2.99% from 3.01%. Comments from BOJ's Governor Kuroda confident stance on withdrawing stimulus in the future, is also yen supportive, as the Central Bank's leader said earlier today that he is "quite sure" that they can smoothly exit monetary stimulus when the time comes. Entering the Asian session barely holding around 113.00, the pair has an immediate support around 112.50, where in the 4 hours chart stands a bullish 100 SMA, followed by 112.00, the 38.2% retracement of the November/December rally. In the same chart, the RSI indicator aims higher within negative territory, but the RSI indicator anticipates some further declines, heading south around 40.
Support levels: 113.20 112.75 112.40
Resistance levels: 114.00 114.50 114.85
GBP/USD
The British Pound failed to gather momentum from higher-than-expected April inflation figures, ending the day anyway with modest gains at 1.2917. UK inflation surpassed market's consensus in beyond, printing a whopping 2.7% yearly basis, above the 2.6% expected and previous 2.3%. When compared to the previous month, inflation advanced 0.5%, surpassing the 0.4% forecast. Producer prices inflation was also higher than expected, with factory output prices up by 0.5% in the same month, and by 3.6% yearly basis, matching previous month's figures, but above the 3.4% expected. Higher inflation usually means that the BOE would be a step closer to rising rates, triggering a rally in the GBP, but uncertainty surrounding the Brexit and the upcoming elections maintained investors side-lined this time. The pair has traded as high as 1.2957 and as low as 1.2865, with the daily candle presenting a limited body, a sign of the uncertainty surrounding the pair. Short term, the pair retains the neutral stance seen on previous updates, as in the 4 hours chart, technical indicators keep hovering around their mid-lines with no certain directional strength, whilst the price settled a few pips above a modestly bearish 20 SMA.
Support levels: 1.2900 1.2865 1.2830
Resistance levels: 1.2960 1.2995 1.3040
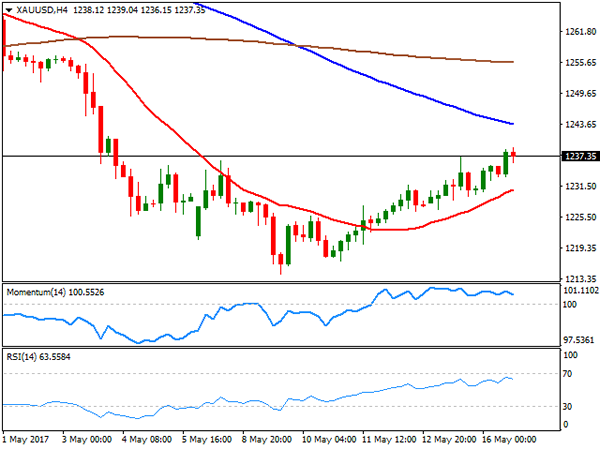
GOLD
Stop gold settled at $1,237.50 a troy ounce, extending its weekly advance by a few cents as the greenback remains in sell mode, while market's mood remains high. The bright metal has posted a limited recovery ever since bottoming at a two-month low of 1,214.24 earlier this month, as odds for a US rate hike next June limit chances of a steeper advance. From a technical point of view, the pair has pared its advance right below a horizontal 100 DMA, but advanced above its 200 DMA for the first time in over a week, while it remains below a strongly bearish 20 DMA, this last at 1,243.30. Technical indicators in the mentioned time frame remain within negative territory, with the RSI heading higher around 45, but the Momentum showing no certain directional strength. In the 4 hours chart, a positive tone prevails, with the price above a bullish 20 SMA, and indicators presenting a neutral-to-bullish stance within positive territory.
Support levels: 1,233.20 1.226.60 1,214.25
Resistance levels: 1,243.30 1,251.30 1,262.10
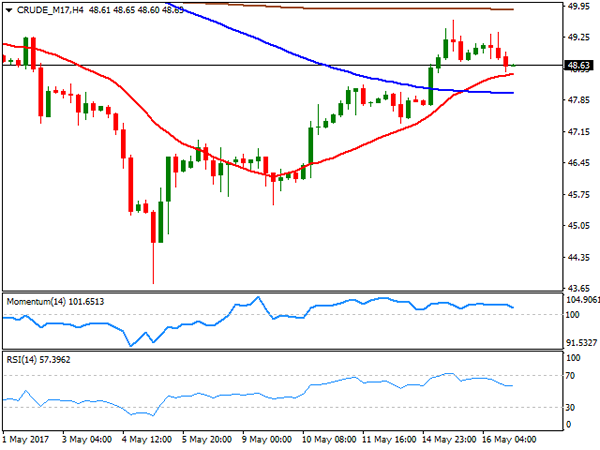
WTI CRUDE OIL
Crude oil prices retreated this Tuesday, with West Texas Intermediate crude futures settling at $48.63 a troy ounce. Despite broad dollar's weakness, the commodity was unable to extend its upward momentum, as investors turned cautious ahead of the weekly US stockpiles release. Inventories are expected to have decreased by around 2.3 million barrels in the week ended May 12th. The API report to be released at the beginning of the Asian session, may hint what the EIA will bring later on the day. From a technical point of view, the daily cart shows that the price remained within the higher end of Monday's range and above a modestly bearish 20 DMA, but also that technical indicators have lost their upward momentum and turned flat within neutral territory. Shorter term and according to the 4 hours chart, technical indicators have eased within positive territory, with the price resting a few cents above a bullish 20 SMA, providing an immediate support at 48.45.
Support levels: 48.45 47.30 46.60
Resistance levels: 48.95 49.60 50.10
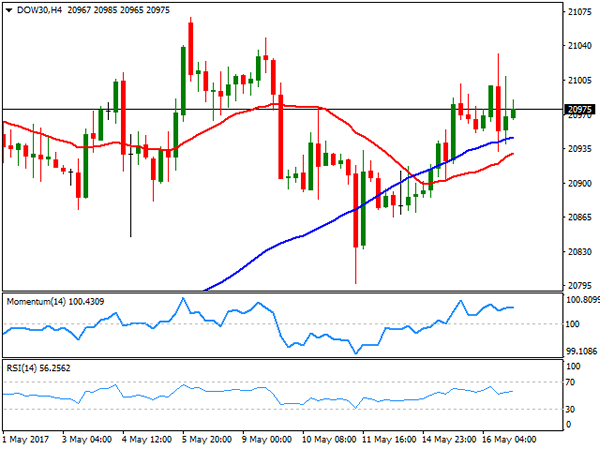
DJIA
Wall Street closed mixed, with the Nasdaq Composite ending the day 20 points higher at 6,169.87, but the Dow and the S&P trimming all of its daily gains ahead of the close, both ending the day with marginal losses. The DJIA shed 2 points, to 20,979.68, while the S&P lost 0.07% and ended at 2,400.67. Techs were the best performers, with Microsoft leading winners' list within the Dow, up 2.01% and followed by IBM which added 1.43%. UnitedHealth Group was the worst performer, down 1.99% while Nike shed 1.84%. From a technical point of view, the index maintains a neutral stance, as investors stand clueless on political woes, although confident on a brighter future. In the daily chart, technical indicators stand pat around their mid-lines, whilst the index barely ended a couple of points above a modestly bullish 20 DMA. In the 4 hours chart, the technical picture is neutral-to-bullish as indicators hold flat within positive territory, whilst intraday declines were contained by a bullish 100 SMA, currently at 20,945.
Support levels: 20,865 20,822 20,797
Resistance levels: 20,900 20,941 20,977
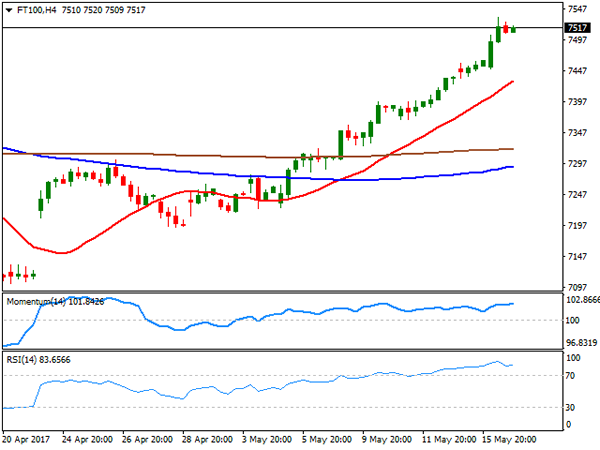
FTSE100
The FTSE 100 rallied to fresh record highs, adding 68 points at the end of the day to settle at 7,522.03. Advancing mining-related equities alongside with a soft Pound, supported once again the advance in the Footsie. Vodafone was the best performer after the telecoms group raised its forecasts for profits for the coming year, posting a 3.96% intraday gain. Fresnillo followed through with a 2.90% advance, whilst Rio Tinto added 2.68%. Hargreaves Lansdown plunged 8.50% leading losers list after competitor Vanguard announced plans to launch an online service to sell its funds directly to UK investors, spurring concerns over an upcoming price war. EasyJet followed, down by 7.25% after reporting a £212 million loss for the first half of its financial year. The index holds around the mentioned close early Asia, and the daily chart shows that the RSI indicator maintains its upward slope at 71, while the Momentum indicator resumed its advance after a modest downward correction, indicating that further gains are likely, despite a downward corrective move can't be dismissed. In the 4 hours chart, technical indicators are also biased higher within extreme overbought territory, as the 20 SMA keeps advancing far above the larger ones and below the current level.
Support levels: 7,508 7,465 7,410
Resistance levels: 7,535 7,570 7,600
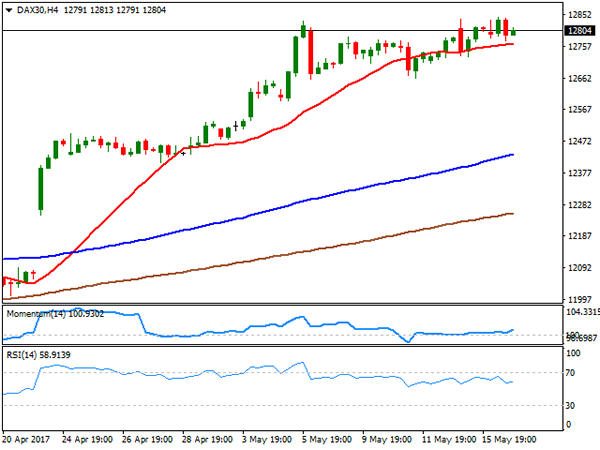
DAX
European equities closed mixed around their opening levels, with the German DAX pretty much unchanged, down 2 points to 12,979.53, weighed by a decline in the automotive sector. In Germany, confidence remained strong, but the positive sentiment has grown at a slower-than-expected pace, denting local sentiment, alongside with a non-motivating EU Q1 GDP. Only nine components managed to advance, with ThyssenKrupp adding 4.03%, followed by Deutsche Telekom that gained 1.08%. The worst performer was Linde, down 1.22% followed by BASF that closed -1.09%. The index closed the day with a small doji, having held within the upper end of Monday's range, overall retaining the positive stance, as in the daily chart, the RSI indicator continues consolidating in overbought levels, whilst the Momentum indicator turned flat above its 100 line as moving averages keep advancing well below the current level. In the 4 hours chart, a modest positive tone is present, as indicators bounced from their mid-lines, while the index holds above its 20 SMA.
Support levels: 12,801 12,755 12,718
Resistance levels: 12,839 12,870 12,920