
Sample Category Title
USD/CAD Elliott Wave Analysis
USD/CAD – 1.3235
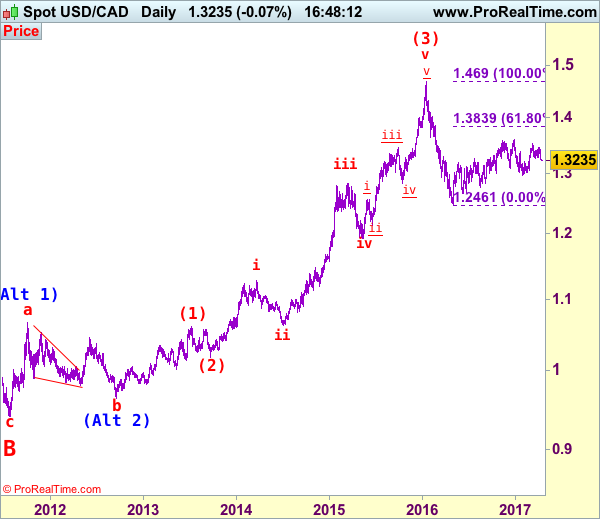
USD/CAD – Wave v ended at 0.9407 and a-b-c correction may extend gain to 1.4700
As the greenback has retreated after faltering below indicated resistance at 1.3456, retaining our bearish view that the fall from 1.3535 (last month’s high) is still in progress, hence consolidation with downside bias remains for weakness to previous resistance at 1.3210-12 (now support), however, only a break below this level would suggest the rebound from 1.2969 has ended and prolong choppy trading, bring subsequent weakness to 1.3100 but downside should be limited to 1.3056 support and price should stay well above psychological support at 1.3000, bring rebound later.
We are keeping our view that the wave b from 1.0657 (a leg top) has possibly ended at 0.9633 with (a): 0.9800, wave (b): 1.0447 and wave c at 0.9633, the subsequent rise from there is now treated as wave c exceeded indicated upside target at 1.3770-80 and 1.4000 and wave (3) has possibly ended at 1.4690 and wave (4) correction has commenced for retracement back to 1.2832 support, then 1.2410-20.
On the daily chart, our latest preferred count remains that the A of (B) rally from 0.9059 low (7 Nov 2007) unfolded into an impulsive wave with i: 0.9059-1.0380, ii ended at 0.9819, iii at 1.3019 followed by triangle wave iv at 1.2026 , then wave v formed a top at 1.3066 and also ended the wave A. The wave B is unfolding as an double three a-b-c-x-a-b-c and is sub-divided as a: 1.2192, b: 1.2716 and wave c at 1.0784, followed by wave x at 1.1725, another set of a-b-c unfolded with 2nd a at 0.9931, 2nd b at 1.0674. the 2nd c has possibly ended at 0.9407, therefore, consolidation with upside bias is seen for major correction, indicated target at 1.3900 had been met and gain to 1.4700 would follow.
On the upside, expect recovery to be limited to 1.3370-75 and bring another decline. Above 1.3455-60 would suggest the retreat from 1.3535 has ended instead, bring a stronger rebound to 1.3500, then retest of 1.3535. A break of this resistance would revive bullishness and signal the rise from 1.2969 is still in progress for retest of 1.3599 top, once this level is penetrated, this would confirm the erratic rise from 1.2461 low has resumed for a stronger correction of early decline from 1.4690 (2016 high) to 1.3700 and later towards 1.3790-00, however, reckon upside would be limited to 1.3835-40 (61.8% Fibonacci retracement of 1.4690-1.2461) and bring retreat later.
Recommendation: Hold short entered at 1.3390 for 1.3190 with stop above 1.3360.
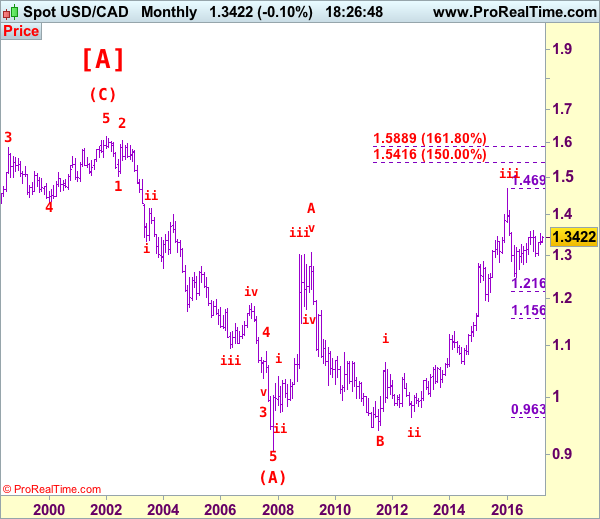
Longer term - The selloff from 1.6194 (21 Jan 2002) to 0.9059 (07 Nov 2007) is viewed as (A) wave which is a 5-waver as labeled on the monthly chart as below, the subsequently rally is labeled as (B) with impulsive A leg of (B) ended at 1.3066, wave B of (B) is unfolding which has either ended at 0.9407 or would extend one more fall but downside should be limited to 0.9200 and 0.9000 should hold.
Trade Idea: EUR/JPY – Sell at 118.00
EUR/JPY - 116.08
Recent wave: wave v of (C) ended at 94.12 and major correction in wave A has ended at 149.79
Trend: Near term down
Original strategy:
Sell at 118.00, Target: 116.00, Stop: 118.60
Position: -
Target: -
Stop: -
New strategy :
Sell at 118.00, Target: 116.00, Stop: 118.60
Position: -
Target: -
Stop:-
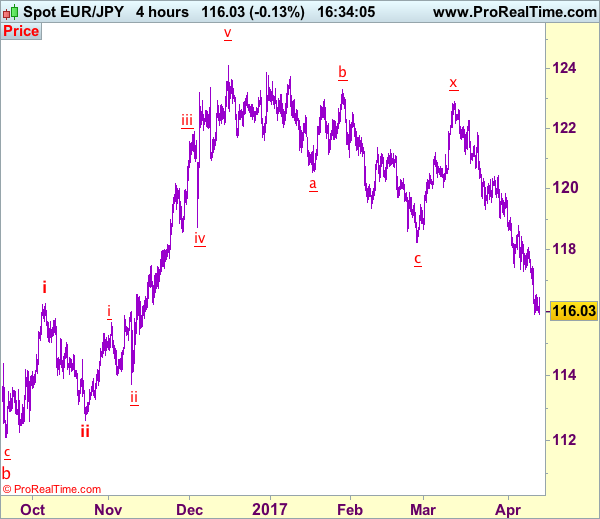
As the single currency has remained under pressure after this week’s selloff, adding credence to our bearish view that recent entire fall from 124.10 top is still in progress and downside bias remains for further weakness to 115.50-60, then towards 115.00, however, near term oversold condition should prevent sharp fall below latter level and reckon 114.40-50 would hold from here, risk from there is seen for a much-needed rebound to take place later.
In view of this, would not chase this fall here and would be prudent to sell euro on subsequent rebound as 117.90-00 should limit upside. Above 118.40-45 would defer and suggest low is possibly formed, risk test of resistance at 118.80 but break there is needed to add credence to this view, bring retracement of recent decline to 119.06 resistance first.
Our latest preferred count is that wave (ii) is ABC-X-ABC which ended at 123.33 and wave (iii) is unfolding with wave iii ended at 100.77, followed by wave iv at 111.57 and wave v as well as the wave (iii) has ended at 97.04, followed by wave (iv) at 111.43 and wave (v) has ended at 94.12 which is also the end of the larger degree v, this also implied the major wave (C) has also ended there, hence major correction has commenced from there with (A) leg unfolding in its lower degree wave c which has possibly ended at 145.69. Under this count, A-B-C wave (B) has commenced with A leg ended at 136.23, wave B at 143.79 and wave C has possibly ended at 149.79.
Our larger degree count is that the decline from 139.26 is wave (C) and is sub-divided into a diagonal triangle i-ii-iii-iv-v with wave i - 105.44, wave ii- 123.33, wave iii - 97.03, wave iv - 111.43, followed by the final wave v as well as the end of wave (C) at 94.12, this also mark the bottom of larger degree wave B. Under this count, major rise in wave C has commenced as an impulsive wave with minor wave III ended at 145.69, wave V is still in progress for further gain to 150.00. Having said that, this so-called wave V could well be the first leg of larger degree 5-waver wave C and this wave C should bring at least a retest of wave A top at 169.97 (July 2008).
Trade Idea: AUD/USD – Hold long entered at 0.7525
AUD/USD – 0.7588
Recent wave: Wave 5 ended at 1.1081 and major correction has commenced for fall to 0.7000 and then towards 0.6500-10
Trend: Near term down
Original strategy :
Bought at 0.7525, Target: 0.7680, Stop: 0.7465
Position: - Long at 0.7525
Target: - 0.7680
Stop: - 0.7465
New strategy :
Hold long entered at 0.7525, Target: 0.7680, Stop: 0.7505
Position: - Long at 0.7525
Target: - 0.7680
Stop:- 0.7505
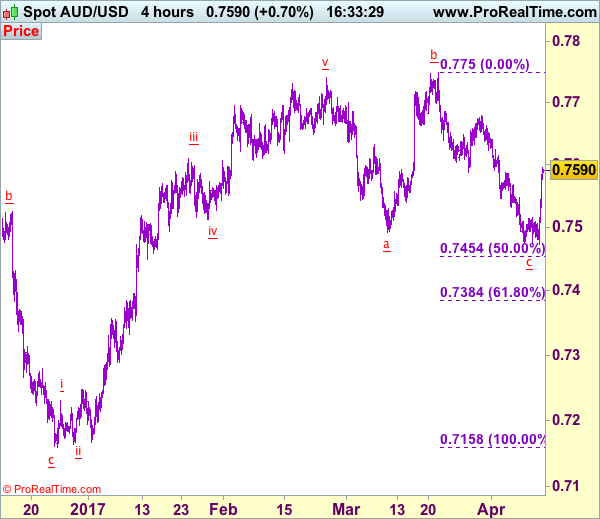
Although aussie fell marginally to 0.7473, as decent demand emerged there and has staged a strong rebound, retaining our bullishness and suggesting low is possibly formed there, hence consolidation with mild upside bias remains for further gain to 0.7625-30, however, break of resistance at 0.7680 is needed to add credence to this view and signal the fall from 0.7750 has ended, bring further gain to 0.7700-10 first but said resistance at 0.7750 should remain intact.
In view of this, we are holding on to our long position entered at 0.7525. Below 0.7500-05 would risk another test of said support at 0.7473 but break there is needed to signal the fall from 0.7750 top is still in progress for weakness to 0.7450-55 (50% Fibonacci retracement of 0.7158-0.7750), however, oversold condition should limit downside to 0.7380-85 (61.8% Fibonacci retracement), risk from there is seen for a rebound later.
On the 4-hour chart, the move from 0.8066 is the wave 5 with i: 0.8860, ii: 0.8315, wave iii is an extended move ended at 1.0183, iv: 0.9706 and wave v has ended at 1.1081 (also the top of entire wave 5). The subsequent selloff is the major correction which is unfolding as ABC-X-ABC and 2nd A leg has ended at 0.8848, followed by a-b-c wave B which ended at 0.9758, hence, 2nd C wave is now in progress and indicated downside target at 0.7000 and 0.6950 had been met, so further fall to 0.6710-20 cannot be ruled out.
Technical Outlook: USDJPY – Extended Fall Hit 200SMA Target, Fresh Weakness Seen On Break
Steep descend in past two days extended below 109.00 handle on Thursday and met target at 108.72 (200SMA).
Strong support held the first attack, with price bouncing back to 109.00 zone but holding within narrow consolidation for now.
Firmly bearish daily studies keep immediate focus at the downside, with firm break below 200 SMA to trigger fresh extension of bear-leg from 111.56 lower top and expose next
target at 107.84 (Fibo 61.8% of 101.17/118.65 ascend).
Caution on oversold daily RSI and slow stochastic, as well as profit-taking action at the end of holiday-shortened week.
Former strong support at 110.00, now acts as solid barrier and should cap extended upticks.
Res: 109.22, 109.77, 110.00, 110.38
Sup: 108.72, 108.23, 108.00, 107.84
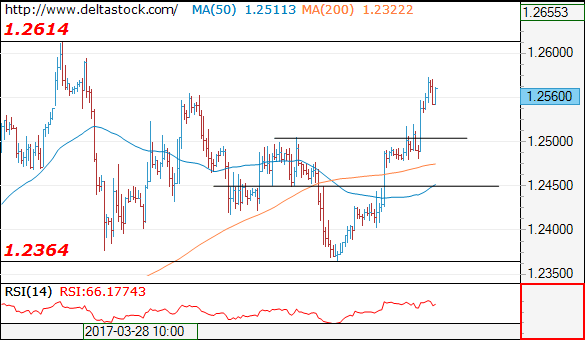
Technical Outlook: GBPUSD – Four-Day Rally Eyes 200SMA Barrier
Cable extends recovery for the fourth consecutive day and hit fresh over two-weeks high at 1.2572, driven by solid UK data and weaker dollar.
Technicals on daily chart remain in firm bullish mode and favor final push towards next targets and key barriers at 1.2613/27 (27 Mar high / 200SMA).
However, consolidation may precede fresh rally, as daily slow stochastic is overbought (no firmer bearish signal for now).
Ascending converged daily 10/20 SMA’s offer solid support at 1.2476/67 zone which should contain extended downticks.
Res: 1.2572, 1.2594, 1.2613, 1.2627
Sup: 1.2527, 1.2500, 1.2470, 1.2425
Forex Technical Analysis: EUR/USD, USD/JPY, GBP/USD
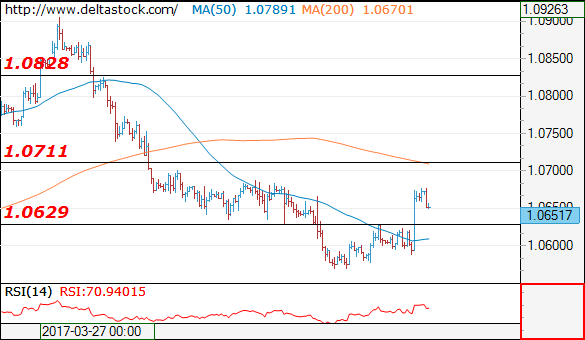
EUR/USD
Current level - 10651
The recent break through 1.0630 signals a positive intraday bias, with a risk of a higher test at 1.0700-20 resistance area. Key support on the downside lies at 1.0630 and a violation of the latter will reinstate he negative outlook for 1.0490.
| Resistance | Support | ||
| intraday | intraweek | intraday | intraweek |
| 1.0710 | 1.0828 | 1.0630 | 1.0490 |
| 1.0828 | 1.0904 | 1.0570 | 1.0340 |
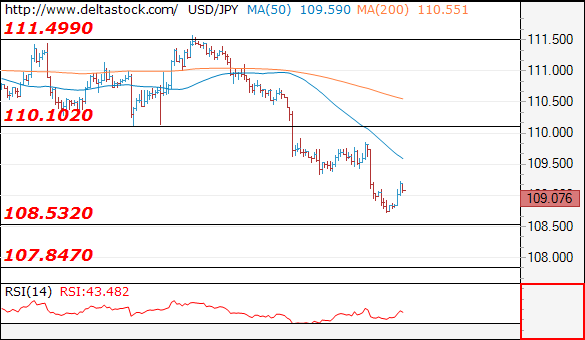
USD/JPY
Current level - 109.07
The downtrend is intact and there is a possibility of extending the slide towards 107.80 support zone. Initial intraday resistance lies at 1.0930, followed by the major hurdle at 110.10.
| Resistance | Support | ||
| intraday | intraweek | intraday | intraweek |
| 109.30 | 113.50 | 108.50 | 108.50 |
| 111.10 | 115.65 | 107.80 | 107.80 |
GBP/USD
Current level - 1.2560
The bias here is positive above 1.2500 area, with a risk of a further rise towards 1.2620-50 area.
| Resistance | Support | ||
| intraday | intraweek | intraday | intraweek |
| 1.2620 | 1.2620 | 1.2500 | 1.2365 |
| 1.2650 | 1.2705 | 1.2450 | 1.2230 |
EUR/GBP Candlesticks and Ichimoku Analysis
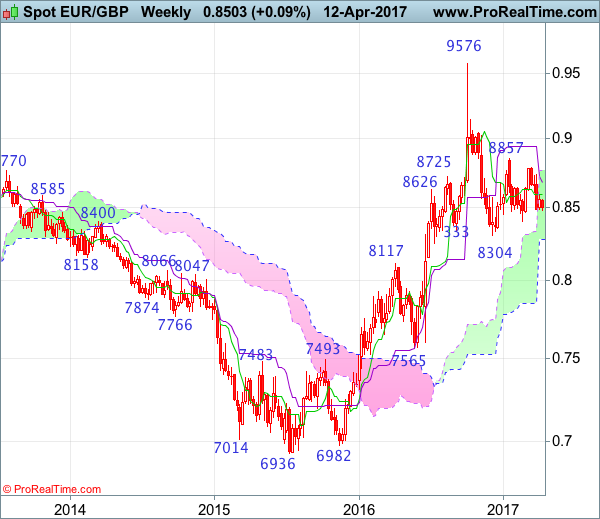
Weekly
• Last Candlesticks pattern: N/A
• ime of formation: N/A
• Trend bias: Near term up
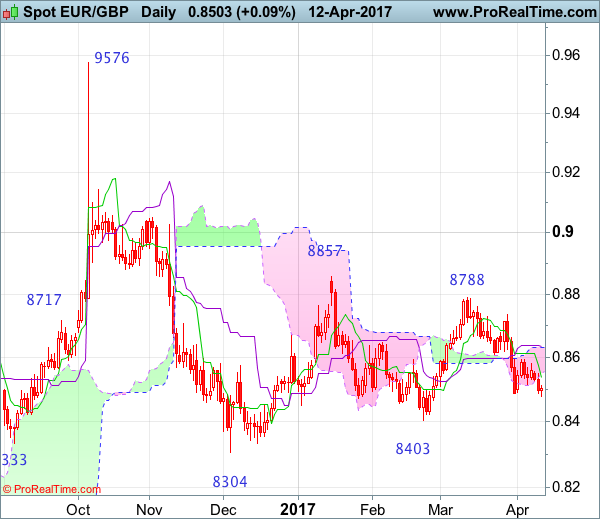
Daily
• Last Candlesticks pattern: Hammer
• Time of formation: 3 Feb 2016
• Trend bias: Up
EURGBP – 0.8487
As the single currency ran has remained under pressure after recent selloff, adding credence to our view that top has been formed at 0.8788 earlier last month, hence consolidation with mild downside bias remains for the fall from 0.8788 to extend weakness to 0.8445-50, however, reckon previous support at 0.8403 would hold on first testing due to near term oversold condition and price should stay well above support at 0.8332, risk from there is seen for a rebound later.
On the upside, whilst initial recovery to the Tenkan-Sen (now at 0.8537) cannot be ruled out, reckon upside would be limited to 0.8590-00 and the Kijun-Sen (now at 0.8633) should hold, bring another decline later. A daily close above the Kijun-Sen would suggest low is formed instead, bring further gain to 0.8685-90, however above resistance at 0.8735 is needed to revive bullishness and signal the rise from 0.8403 is still in progress, bring further gain to 0.8810-15 but as broad outlook remains consolidative, reckon upside would be limited to previous resistance at 0.8857, risk from there is seen for a retreat to take place later.
Recommendation: Stand aside for this week.
On the weekly chart, euro’s retreat from 0.8788 has continued pressuring the single currency, adding credence to our view that the rebound from 0.8403 has ended at 0.8788 last month, hence consolidation with mild downside bias remains for further weakness to 0.8460, however, reckon 0.8430 would limit downside and said support at 0.8403 should hold, bring further sideways trading, Only a break of this support would revive bearishness and extend the fall from 0.8857 to 0.8350-55. Looking ahead, below there would signal decline from 0.9576 top has resumed for retest of 0.8304 but only break there would extend the fall from 0.9576 top for retracement of medium term upmove to previous support at 0.8251, then 0.8200.
On the upside, expect recovery to be limited to the Tenkan-Sen (now at 0.8596) and the Kijun-Sen (now at 0.8681) should hold, bring another decline later. Only a break of resistance at 0.8735 would risk test of said resistance at 0.8788 which is likely to cap euro’s upside. In the event the single currency is able to penetrate said resistance at 0.8788, this would extend the rebound from 0.8403 towards said resistance at 0.8857. Looking ahead, only a break of this level would revive bullishness and extend the rise from 0.8304 to 0.8940 (50% Fibonacci retracement of 0.9576-0.8304) but price should falter below resistance at 0.9026.
EUR/CHF Candlesticks and Ichimoku Analysis
Weekly
• Last Candlesticks pattern: Doji
• Time of formation: 20 Feb 2017
• Trend bias: Up
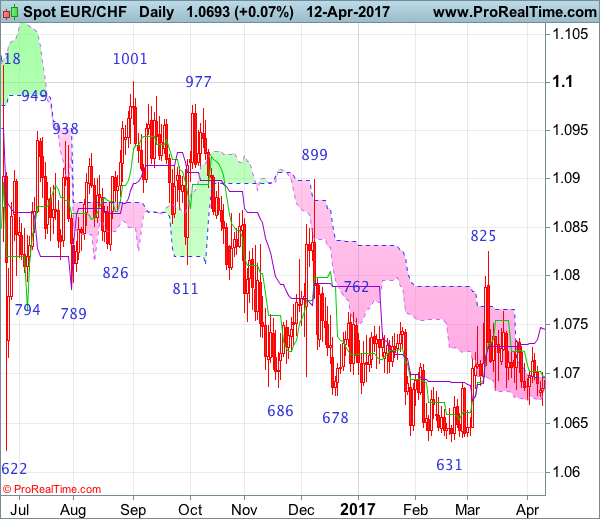
Daily
• Last Candlesticks pattern: Doji
• Time of formation: 1 Sep 2016
• Trend bias: Near term down
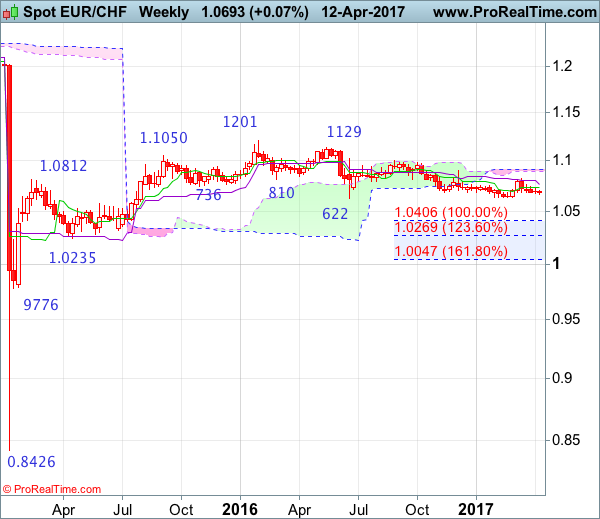
EUR/CHF – 1.0668
Despite last week’s brief bounce to 1.0727, as the single currency has fallen again after faltering below indicated resistance at 1.0736, suggesting the fall from 1.0825 top is still in progress and near term downside risk remains for this move to extend further decline towards 1.0622-31, however, break of this level is needed to signal the decline from 1.1201 (2016 high) has resumed and extend subsequent weakness to 1.0590-00, then towards 1.0530-35 but loss of downward momentum should prevent sharp fall below 1.0500, price should stay well above 1.0400-10, risk from there has increased for a strong rebound to take place later.
On the upside, whilst initial recovery to 1.0700 cannot be ruled out, reckon upside would be limited to said resistance at 1.0727 and bring another decline later. Only a daily close above 1.0727 would suggest the fall from 1.0825 has ended instead, bring a stronger rebound to 1.0763, break there would add credence to this view and encourage for further gain to 1.0790-00 but said resistance at 1.0825 should remain intact. In the event euro is able to penetrated resistance at 1.0825, this would shift risk back to upside and signal low has been formed instead, bring further subsequent gain to 1.0850 and later towards key resistance at 1.0899 (Dec high).
Recommendation: Stand aside for this week.
On the weekly chart, although the single currency rebounded initially last week, renewed selling interest emerged around the Tenkan-Sen and price has slipped again, suggesting the retreat from 1.0825 is still in progress and may extend weakness to indicated strong support at 1.0622-31, however, break there is needed to signal recent decline from 1.1201 top has resumed and extend further fall to 1.0550-55, then 1.0500-10 but oversold condition should prevent sharp fall below 1.0400-10 (100% projection of 1.1201-1.0622 measuring from 1.1001) and price should stay well above previous support at 1.0314, risk from there is seen for a rebound to take place later.
On the upside, expect recovery to be limited to 1.0700-10 and bring another decline. Above the Tenkan-Sen (now at 1.0728 would bring rebound to 1.0760-65, however, reckon upside would be limited to 1.0825 resistance and bring further consolidation. Only a break of 1.0825 would signal low has been formed at 1.0631, bring retracement of recent decline to 1.0850 but a break above indicated resistance at 1.0899 is needed to add credence to this view and bring a stronger rebound to 1.0970-75, then test of 1.1001. Looking ahead, only a sustained breach above 1.1001 would signal the fall from 1.1201 has ended, bring further gain to 1.1100 but reckon resistance at 1.1129 would hold on first testing.
Trade Idea : USD/CHF – Buy at 0.9995
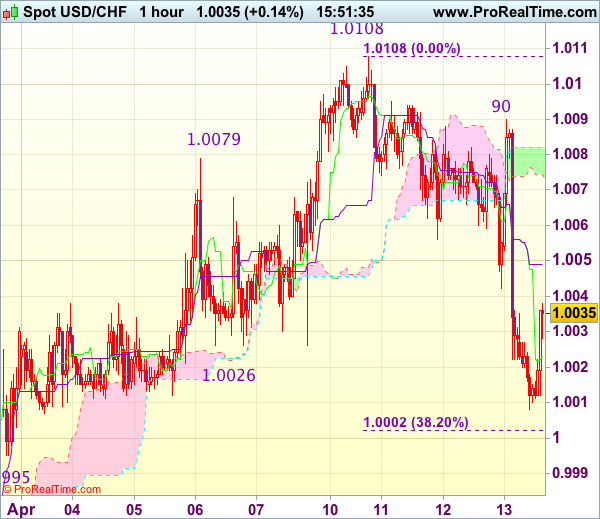
USD/CHF - 1.0030
Most recent candlesticks pattern : N/A
Trend : Near term down
Tenkan-Sen level : 1.0023
Kijun-Sen level : 1.0049
Ichimoku cloud top : 1.0082
Ichimoku cloud bottom : 1.0073
Original strategy :
Buy at 1.0000, Target: 1.0100, Stop: 0.9965
Position : -
Target : -
Stop : -
New strategy :
Buy at 0.9995, Target: 1.0100, Stop: 0.9960
Position : -
Target : -
Stop : -
As the greenback dropped quite sharply after meeting renewed selling interest at 1.0090, adding credence to our view that temporary top has been formed at 1.0108 on Monday and initial downside risk remains for weakness to 1.0002 (38.2% Fibonacci retracement of 0.9831-1.0108) but reckon support at 0.9995 would limit downside and bring another rebound later, above the Kijun-Sen (now at 1.0049) would bring rebound to 1.0070-75, break there would signal an intra-day low is formed, bring test of said resistance at 1.0090 first. Having said that, only break of this week’s high at 1.0108 would confirm recent upmove from 0.9813 has resumed for headway to 1.0140-45 but price should falter well below another previous resistance at 1.0171.
In view of this, would not chase this rise here and would be prudent to buy dollar on next decline as support at 0.9995 should limit downside. Below 0.9970 (50% Fibonacci retracement of 0.9831-1.0108) would abort and signal recent upmove has ended, bring correction to support at 0.9948.
Trade Idea : GBP/USD – Buy at 1.2485
GBP/USD - 1.2552
Most recent candlesticks pattern : N/A
Trend : Near term down
Tenkan-Sen level : 1.2559
Kijun-Sen level : 1.2528
Ichimoku cloud top : 1.2468
Ichimoku cloud bottom : 1.2436
New strategy :
Buy at 1.2485, Target: 1.2585, Stop: 1.2450
Position : -
Target : -
Stop : -
As cable has continued trading with a firm undertone after this week’s rally, adding credence to our view that low has been formed at 1.2365 on Monday and upside bias remains for the rebound from there to extend gain to 1.2585-90, however, break of previous resistance at 1.2616 is needed to retain bullishness and extend further subsequent rise to 1.2650-60.
In view of this, would not chase this rise here and would be prudent to buy cable on pullback as 1.2481 support should limit downside and bring another upmove later. Below the upper Kumo (now at 1.2468) would defer and suggest top is formed, risk test of 1.2433 (previous resistance) first.
