Sample Category Title
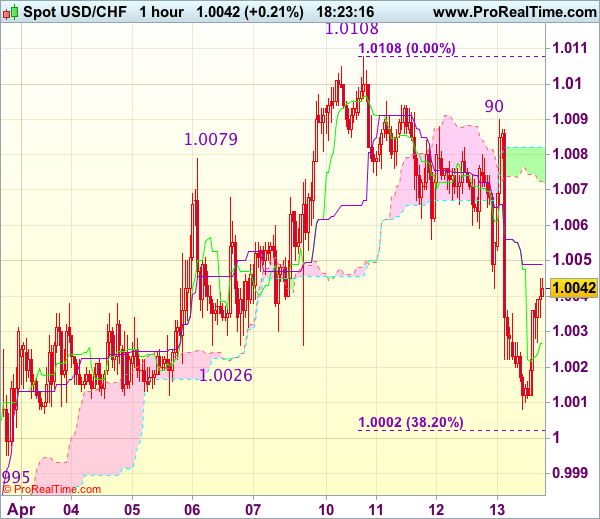
Trade Idea Update: USD/CHF – Buy at 0.9995
USD/CHF - 1.0043
Original strategy :
Buy at 0.9995, Target: 1.0100, Stop: 0.9960
Position : -
Target : -
Stop : -
New strategy :
Buy at 0.9995, Target: 1.0100, Stop: 0.9960
Position : -
Target : -
Stop : -
As the greenback dropped quite sharply after meeting renewed selling interest at 1.0090, adding credence to our view that temporary top has been formed at 1.0108 on Monday and initial downside risk remains for weakness to 1.0002 (38.2% Fibonacci retracement of 0.9831-1.0108) but reckon support at 0.9995 would limit downside and bring another rebound later, above the Kijun-Sen (now at 1.0049) would bring rebound to 1.0070-75, break there would signal an intra-day low is formed, bring test of said resistance at 1.0090 first. Having said that, only break of this week’s high at 1.0108 would confirm recent upmove from 0.9813 has resumed for headway to 1.0140-45 but price should falter well below another previous resistance at 1.0171.
In view of this, would not chase this rise here and would be prudent to buy dollar on next decline as support at 0.9995 should limit downside. Below 0.9970 (50% Fibonacci retracement of 0.9831-1.0108) would abort and signal recent upmove has ended, bring correction to support at 0.9948.
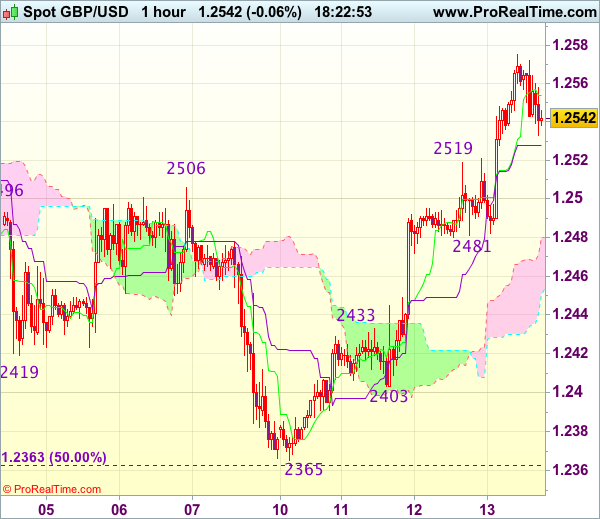
Trade Idea Update: GBP/USD – Buy at 1.2485
GBP/USD - 1.2552
Original strategy :
Buy at 1.2485, Target: 1.2585, Stop: 1.2450
Position : -
Target : -
Stop : -
New strategy :
Buy at 1.2485, Target: 1.2585, Stop: 1.2450
Position : -
Target : -
Stop : -
As cable has continued trading with a firm undertone after this week’s rally, adding credence to our view that low has been formed at 1.2365 on Monday and upside bias remains for the rebound from there to extend gain to 1.2585-90, however, break of previous resistance at 1.2616 is needed to retain bullishness and extend further subsequent rise to 1.2650-60.
In view of this, would not chase this rise here and would be prudent to buy cable on pullback as 1.2481 support should limit downside and bring another upmove later. Below the upper Kumo (now at 1.2468) would defer and suggest top is formed, risk test of 1.2433 (previous resistance) first.
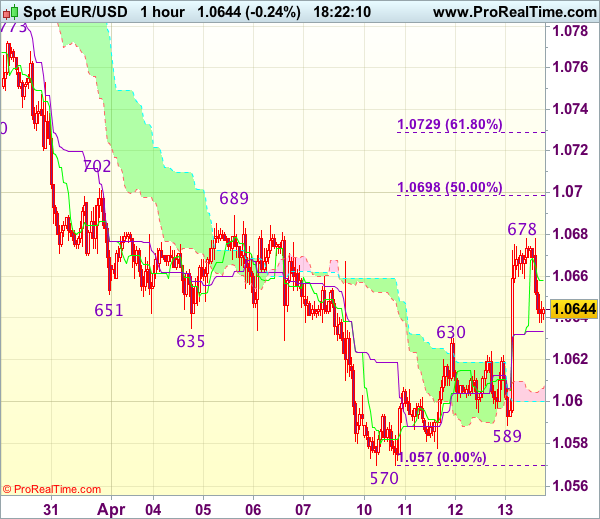
Trade Idea Update: EUR/USD – Hold short entered at 1.0665
EUR/USD - 1.0643
Original strategy :
Sold at 1.0665, Target: 1.0565, Stop: 1.0680
Position : - Short at 1.0665
Target : - 1.0565
Stop : - 1.0680
New strategy :
Hold short entered at 1.0665, Target: 1.0565, Stop: 1.0680
Position : - Short at 1.0665
Target : - 1.0565
Stop : - 1.0680
Although the single currency staged a strong rebound after finding support at 1.0589, as this move from 1.0570 is viewed as retracement of recent decline, reckon upside would be limited and bring retreat later, below the upper Kumo (now at 1.0606) would bring test of said support at 1.0589 but break there is needed to signal the rebound from 1.0570 has ended, bring retest of this Monday’s low, below there would extend the decline from 1.0906 to 1.0550-55 (50% projection of 1.0906-1.0635 measuring from 1.0689), then 1.0525-30.
In view of this, we are holding on to our short position entered at 1.0665. A firm break above intra-day resistance at 1.0678 would abort and suggest low has been formed at 1,0570, bring a stronger rebound to 1.0698-02 (50% Fibonacci retracement of 1.0827-1.0570 and previous resistance).
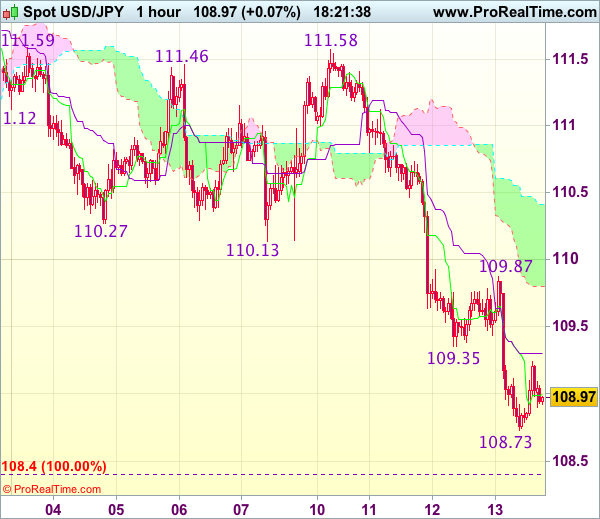
Trade Idea Update: USD/JPY – Sell at 109.90
USD/JPY - 108.97
Original strategy :
Sell at 109.90, Target: 108.90, Stop: 110.25
Position : -
Target : -
Stop : -
New strategy :
Sell at 109.90, Target: 108.90, Stop: 110.25
Position : -
Target : -
Stop : -
The greenback has dropped again after brief recovery to 109.87, adding credence to our bearish view that recent entire decline from 118.66 top is still in progress, hence downside bias remains for recent selloff to extend further weakness to 108.40-50 (100% projection of 118.66-111.55 measuring from 115.51), however, loss of near term downward momentum should prevent sharp fall below 108.20-25 (1.618 times projection of 112.20-110.13 measuring from 111.58) and 108.00 should hold, bring rebound later.
In view of this, would not chase this fall here and would be prudent to sell dollar on recovery as said resistance at 109.87 should limit upside and bring another decline later. Above previous support at 110.13 would abort and suggest low is formed, bring a stronger rebound later to the upper Kumo (now at 110.45).
Euro Edges Lower As German CPI Falls
EUR/USD has posted slight losses in the Thursday session. Currently, the pair is trading at 1.0640. On the release front, German Final CPI dropped to 0.2%, matching the forecast. French Final CPI took the opposite direction, improving to 0.6%, matching the forecast. In the US, there are a host of key indicators, all of which are expected to weaken. PPI is expected to dip to 0.0%, unemployment claims are forecast to rise to 242 thousand, while UoM Consumer Sentiment is expected to soften to 97.1 points. On Friday, the US releases consumer inflation and spending data.
German data has been a mixed bag this week. The ZEW Economic Sentiment report sparked with a reading of 19.5, crushing the estimate of 13.2. This marked the strongest gain since August 2015, pointing to strong optimism among institutional investors and analysts. However, inflation levels have softened in March. The Wholesale Price Index dropped to a flat 0.0%, compared to 0.5% a month earlier. This was well short of the forecast of 0.4%. The downward trend continued with Final CPI, which dropped to 0.2%, down from 0.6% in February. Eurozone CPI made a big splash in February, when it hit the ECB’s target of 2.0%, and raising speculation that the ECB might need to respond by tightening monetary policy. However, the indicator softened in March to 1.5%, short of the forecast of 1.8%. The softer March inflation numbers have certainly eased the pressure on the ECB, which is not scheduled to reduce its asset-purchase program until December.
Earlier this week, Federal Reserve Chair Janet Yellen said that with the economy close to full employment and 2 percent inflation, Fed policymakers were looking to reduce the support that the central bank was providing the economy. The minutes of the March meeting indicated that the Fed plans to trim the $4.5 trillion balance sheet, which has ballooned as a result of the huge asset-purchase program which started in response to the financial crisis in 2008. Yellen emphasized that the Fed’s policy stance is neutral, as interest rate increases will be gradual, given that the economy is growing at a moderate pace. The Fed is widely expected to raise rates twice more in 2017, with the next rate expected in June. At the same time, some Fed policymakers are in favor of three more rate hikes, which would bring the total this year to four moves.
Dollar Plunged On Trump’s Second Dollar Overly Strong Statement
The dollar index fell to a 2-week low of 99.91 in the early hours this morning, breaking the significant support level at 100.00. The dollar index plunged 0.58% on Wednesday April 12, and 0.88% in the past two days. The sudden fall was caused by Trump's dollar overly strong statement for the second time this year. He expressed that if the dollar is much stronger against other currencies, it will weaken exports and corporate competitivity. Trump's weak dollar stance is likely to keep on reining in the dollar strength. The dollar index saw a rebound in the past two hours, the bulls have recovered the significant level at 100.00.
USD/JPY hit the lowest level of 108.71 since November 17. The recent strengthening of the yen hit Japanese exports. Nikkei 225 index has turned bearish since mid-March, hitting the lowest level of 18292.50 since December 5 this morning.
The Australian employment change for March rose substantially to 60.9K in March, from 2.8K in February, beating expectations of 20K, marking the largest improvement since November 2015. The outperforming data resulted in the surge of AUD/USD this morning, hitting the highest level of 0.7594 since April 4, testing the psychological resistance level at 0.7600.
Yesterday the Bank of Canada (BoC) announced its rate decision on hold at 0.5%. The BoC stated that although the recent data shows the economy is sound. However, the US economic outlook is still uncertain under Trump's administration, which will likely weigh on the Canadian economy. The BoC revised the economic growth forecast upwards from 2.1% to 2.6% in 2017, helped by the sudden rise in residential investment and increase of consumer expenditure. However, business investment and employment are continuing to weaken. The economic growth forecast in 2018 is revised downwards from 2.1% to 1.9%.
The overall statement showed mixed signs.
Uncertainty over the Trump administration will affect not only the economic outlook of Canada, but also that of other neighbouring countries and major economies.
The US EIA crude oil inventories (the week ending April 7), saw the biggest drop in 2.166 million barrels this year. However, the figure failed to push oil prices higher as it was trading at the major resistance zone, where the selling pressure is heavy. Spot WTI retraced around 1%, and spot Brent crude oil retraced around 1.13% on Wednesday April 12.
Keep an eye on the US initial jobless claims (the week ending April 7), to be released ta 13:30 BST this afternoon, followed by the US Michigan consumer sentiment index (Apr) at 15:00 BST. It will likely affect the strength of the dollar and dollar crosses.
The US retail sales and CPI for March, will be released at 13:30 BST on Friday, it is one of the most important pieces of data for this week. Be aware that it will likely cause volatility for the dollar and the dollar crosses.
GOLD More Upside, SILVER Clears Resistance, Crude Oil Bullish Pause.
GOLD More upside.
Gold has broken the key resistance area 1263. This validates a bullish reversal pattern with an upside potential at 1337. The hourly support at 1263 (previous resistance) has induced some buying interest. Another hourly support lies at 1260 (rising trendline). An hourly resistance can now be found at 1280 (intraday high).
In the long-term, the technical structure suggests that there is a growing upside momentum. A break of 1392 (17/03/2014) is necessary ton confirm it, A major support can be found at 1045 (05/02/2010 low).
SILVER Clears resistance.
Silver is rising sharply above 18.49, validating the recent technical improvements. Strong resistance is given at a distance at 19.00 (09/11/2017 high). Key support is given at 17.74 (10/04/2017 low) then 16.82 (15/03/2017 low).
In the long-term, the death cross indicates that further downsides are very likely. Resistance is located at 25.11 (28/08/2013 high). Strong support can be found at 11.75 (20/04/2009).
Crude Oil Bullish pause.
Crude oil has pulled-back after its recent sharp rise. Support stands at 52.80/90 (intraday low and rising trendline). Hourly resistance can be located at 54 (07/04/2017 high then strong resistance stands at 55.24 03/01/2017 high).
In the long-term, crude oil has recovered after its sharp decline last year. However, we consider that further weakness are very likely. Strong support lies at 24.82 (13/11/2002) while resistance can now be found at 55.24 (03/01/2017 high).
EUR/CHF Moving Sideways, EUR/JPY Stabilizing, EUR/GBP Grinding Lower.
EUR/CHF Moving sideways.
EUR/CHF has paused near the key support at 1.0684 (see also the falling channel). However, the persistent succession of lower highs favours a bearish bias. Hourly resistances can be found at 1.0691 (07/04/2017 high). The medium-term pattern suggests us to see continued bearish pressures towards key support that can be found at 1.0623 (24/06/2016 low). Expected to see further decline.
In the longer term, the technical structure is mixed. Resistance can be found at 1.1200 (04/02/2015 high). Yet,the ECB's QE programme is likely to cause persistent selling pressures on the euro, which should weigh on EUR/CHF. Supports can be found at 1.0184 (28/01/2015 low) and 1.0082 (27/01/2015 low).
EUR/JPY Stabilizing.
EUR/JPY recovery bounce off support was short lived and is now challenging the trendline support at 115.95. Next support is given at 113.73 (09/11/2016 low). Resistance stands at 117.43 then 122.88 (13/03/0217 high).
In the longer term, the technical structure validates a medium-term succession of lower highs and lower lows. As a result, the resistance at 149.78 (08/12/2014 high) has likely marked the end of the rise that started in July 2012. Strong support at 94.12 (24/07/2012 low) looks nonetheless far away.
EUR/GBP Grinding lower.
EUR/GBP has broken the key supports area between 0.8787 (13/03/2017) high and 0.8484 (31/03/2017 low). The short-term technical structure is negative as long as the hourly resistance at 0.8596 holds. Another resistance can be found at 0.8645. An hourly support lies at 0.8450 (03/01/2017 low). Expected to show continued weakness.
In the long-term, the pair has largely recovered from recent lows in 2015. The technical structure suggests a growing upside momentum. The pair is trading above from its 200 DMA. Strong resistance can be found at 0.9500 psychological level.
USD/CHF Trying To Stabilize, USD/CAD Making Fresh New Lows, AUD/USD Sharp Rally.
USD/CHF Trying to stabilize.
USD/CHF failed to breach 1.0107 dropping sharply to support. The short-term technical structure is negative as long as prices remain below the hourly resistance at 1.0171 (07/03/2017). Hourly support is given at 1.0017 (intraday base low) then 0.9814 (27/03/2017 low).
In the long-term, the pair is still trading in range since 2011 despite some turmoil when the SNB unpegged the CHF. Key support can be found 0.8986 (30/01/2015 low). The technical structure favours nonetheless a long term bullish bias since the unpeg in January 2015
USD/CAD Making fresh new lows.
USD/CAD has broken the support at 1.3265 confirming an underlying bearish trend. Hourly resistances can now be found at 1.3340 (intraday high) and 1.3456 (04/04/2017 high). Support is given at 1.2969 (31/01/2017 low).
In the longer term, there is a golden cross with the 50 dma crossing the 200 dma indicating further upside pressures. Strong resistance is given at 1.4690 (22/01/2016 high). Long-term support can be found at 1.2461 (16/03/2015 low).
AUD/USD Sharp rally.
AUD/USD continues to strengthen after successful recovery bounce above 0.7510/15 (12/04/2017 high and downtrend channel top) Key resistance stands at 0.7681 (30/03/2017 high). Hourly support is located at 0.7449 (13/01/2017 low).
In the long-term, we are waiting for further signs that the current downtrend is ending. Key supports stand at 0.6009 (31/10/2008 low) . A break of the key resistance at 0.8295 (15/01/2015 high) is needed to invalidate our long-term bearish view.
EUR/USD Recovery Bounce, GBP/USD Bounce Gains More Momentum, USD/JPY Remains Weak.
EUR/USD Recovery bounce.
EUR/USD improved yesterday, yet failure to break resistance indicates a reversal. Monitor the hourly resistances area given by 1.0679. Hourly support can be found at 1.0570 (i11.04.2017 low). Stronger support can be found at 1.0494 (22/02/2017 low). A key resistance stands at 1.0874.
In the longer term, the death cross late October indicated a further bearish bias. The pair has broken key support given at 1.0458 (16/03/2015 low). Key resistance holds at 1.1714 (24/08/2015 high). Expected to head towards parity.
GBP/USD Bounce gains more momentum.
GBP/USD has rallied off key support at 1.2334, suggesting a potential short-term base formation. Key resistance stands at 1.2605 (27/03/2017 high). An hourly support can be found at 1.2581 (12/04/2017 base) then 1.2405 (11/04/2017 low).
The long-term technical pattern is even more negative since the Brexit vote has paved the way for further decline. Long-term support given at 1.0520 (01/03/85) represents a decent target. Long-term resistance is given at 1.5018 (24/06/2015) and would indicate a long-term reversal in the negative trend. Yet, it is very unlikely at the moment.
USD/JPY Remains weak.
USD/JPY has broken to the downside out of the horizontal support at 110.11 confirming a bearish bias. Other key supports lie at a distant 106.04 (11/11/2016 low). An hourly resistance can be found at 110.11, while a key resistance stands at 112.20 (31/03/2017 high).
We favor a long-term bearish bias. Support is now given at 96.57 (10/08/2013 low). A gradual rise towards the major resistance at 135.15 (01/02/2002 high) seems absolutely unlikely. Expected to decline further support at 93.79 (13/06/2013 low).