
Sample Category Title
US Non-Farm Payrolls Report Disappointed Market Expectations
Market movers today
It is the last week ahead of the Easter Hol iday and the data calendar is dominated by not least CPI inflation prints across the globe. Today, the inflation set is kicked off with data out of Norway and Denmark. Also, we will get Danish balance of payments data and the Swedish labour force survey release. See page 2 for more details.
In the US, today brings the first of several speeches by the FOMC scheduled in the coming weeks as Fed Chair Janet Yellen is set to speak tonight . We do not expect any major news but focus will naturally be on t he Fed's int ent ion to start quant itative tightening.
In the euro area, the Sen ix investor confidence is due to be released. Sent ix climbed from 1.7 in July 2016 to 20.7 in March, which is the highest level since the financial crisis. As noted last month, political uncertainty has derailed financial sent iment while PMIs and other survey indicators show st rength consistent ly. We therefore expect Sent ix to increase marginally to 21.0 in April as we also note that the historically high level makes further upside surprises less likely.
Selected market news
Friday's US non-farm payrolls report disappointed market expectations as the headline print of 98,000 new jobs fell far short of Wednesday's ADP report signal. Yet , despite the disappoint ing headline and negat ive revisions, we st ill think the overall picture is that of an improving US labour market . In part icular, we highlight that the weather hit job growth negat ively in March and a correct ion generally following the previous two st rong prints is not unusual. Friday's print leaves the Fed facing a 3M moving job growth average of a decent 178,000 with unemployment and underemployment falling while wage growth is slowly picking up. We therefore maintain our call for an addit ional two rate hikes this year (July, December) and that the Fed is likely to start reducing its balance sheet from Q1 18, possibly even in Q4 17.
The US-China presidential meeting between Presidents Trump and Jinping, which ended on Friday, underpinned a much needed good start to the init ial working relat ionship. Nevertheless, the meet ing was also a reminder that the disagreements between the US and China are real and that the potential implicat ions are non-negligible. Trade is a key area of disagreement and it is therefore posit ive with the seemingly first minor t rade deal following the meet ing as China prepares to ease beef import restrictions from the US and the majority stake regulat ion in finance.
Over the weekend, the Pentagon decided to divert an aircraft carrier group to waters near North Korea in a move aimed as a "show of force" according to FT.
The weekly IMM Positioning Update - investors trim JPY shorts, 10 April, revealed little change in speculative positioning although the rise in long gold bets suggest s increased investor caution. In Friday's Strategy piece, we also highlight ed how mount ing signs of the business cycle peaking should lead a pause in the equity bull market and mark the end of the bond bear market . See ‘‘Risk factors move to the fore as business cycle peaks', 7 April for more details.
Dollar Lacks Follow Through Buying to Extend Rally, But Stays Firm
Dollar edges mildly higher in early Asian session today but quickly turned mixed. The greenback is somewhat supported by comments from Fed officials. St. Louis Fed President James Bullard echoed some other officials and said Fed could start winding down its $4.5T balance sheet later this year. But in that case for Bullard, it would become less necessary to raise interest rate. On the other hand, New York Fed President William Dudley said on Friday that shrinking the balance sheet would only prompt a "little pause" in tightening.
Fed balance shrinking should be considered in March projections
We'd like to remind our readers that Dollar suffered selloff last month when Fed's new economic and interest rate projections disappointed. That was, in spite of recent solid economic data (except Friday's NFP of course), Fed maintained projection of three hikes this year and in 2018. And the minutes released last week showed FOMC members have already discussed the topic of unwinding the balance sheet. That is, Fed's rate projection should have that "little pause" Dudley mentioned considered. In other words, the talk of balance sheet normalization shouldn't alter Fed's rate path.
Fed chair Janet Yellen will speak today and markets will look into hints of her view on rate and balance sheet. But we'd like to maintain our view that economic data including inflation and employment will remain one of the two main driving forces in Fed's outlook. US President Donald Trump's implementation of his election promises of fiscal stimulus would be another factor, and possibly the more important one.
BoC rate decision to highlight the week
Bank of Canada rate decision on Wednesday will be a major focus this week. BoC is widely expected to keep interest rate unchanged at 0.50%. The tone of the statement could remain slightly dovish in spite of improvements in economic data. Nonetheless, Canadian Dollar will likely follow more on oil prices as WTI crude oil could be heading back to 55.24 resistance due to geopolitical tensions.
In addition to that, UK CPI and employment, German ZEW, China CPI, PPI and trade balance, Australia employment, US CPI and retail sales will be closely watched in a holiday shortened week, ahead of long weekend.
Here are some highlights for the week ahead
- Monday: Australia home loans; Japan economy watcher sentiment; Eurozone Sentix investor confidence; Canada housing starts; US labor market conditions index
- Tuesday: Australia NAB business confidence; UK CPI, PPI; German ZEW; Eurozone industrial production
- Wednesday: Japan machine orders, PPI; China CPI, PPI; UK employment; BoC rate decision; US import prices
- Thursday: New Zealand business NZ manufacturing; Australia employment; China trade balance; Swiss PPI; German CPI final; Canada manufacturing sales, new housing price index; UK PPI, jobless claims, U of Michigan sentiment
- Friday: US CPI, retail sales, business inventories
AUD/USD Daily Outlook
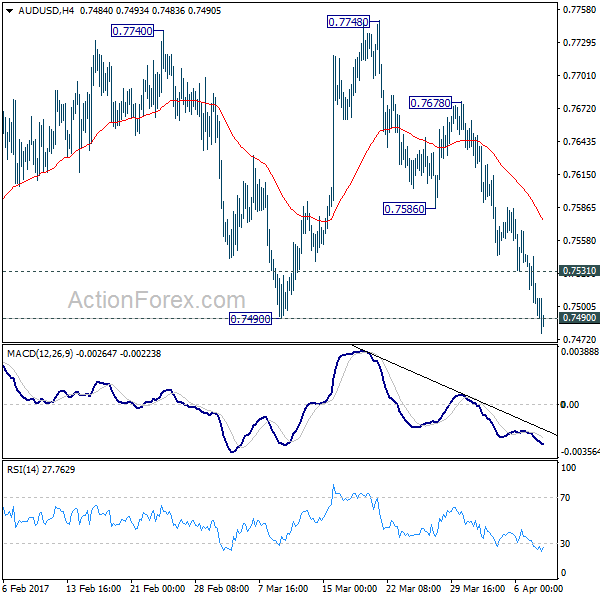
Daily Pivots: (S1) 0.7480; (P) 0.7513; (R1) 0.7531; More...
AUD/USD's fall from 0.7748 continues today and breaches 0.7490 support. The development indicates that rise from 0.7158 is already completed at 0.7748. And, near term trend has reversed Intraday bias stays on the downside for 0.7144/58 support zone next. On the upside, above 0.7351 minor resistance will turn bias neutral and bring recovery. But upside should be limited by 0.7586 support turned resistance to bring fall resumption.
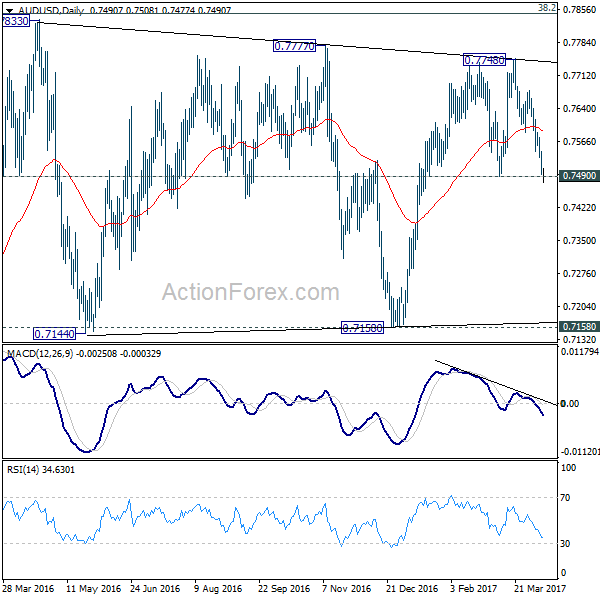
In the bigger picture, we're still treating price actions from 0.6826 low as a correction. And, as long as 38.2% retracement of 0.9504 to 0.6826 at 0.7849 holds, long term down trend from 1.1079 is expected to resume sooner or later. Break of 0.6826 low will target 0.6008 key support level. However, firm break of 0.7849 will indicate that rise from 0.6826 is developing into a medium term rebound, rather than a sideway pattern. In such case, stronger rise should be seen to 55 month EMA (now at 0.8142) and above.
Economic Indicators Update
| GMT | Ccy | Events | Actual | Forecast | Previous | Revised |
|---|---|---|---|---|---|---|
| 23:50 | JPY | Current Account (JPY) Feb | 2.21T | 1.79T | 1.26T | |
| 1:30 | AUD | Home Loans Feb | -0.50% | 0.00% | 0.50% | 0.40% |
| 5:00 | JPY | Eco Watchers Survey Current Mar | 47.4 | 49.8 | 48.6 | |
| 8:30 | EUR | Eurozone Sentix Investor Confidence Apr | 21 | 20.7 | ||
| 12:15 | CAD | Housing Starts Mar | 215.5k | 210.2k | ||
| 14:00 | USD | Labor Market Conditions Index Change Mar | 1.3 |
Elliott Wave View: Dubai Index ( DFMGI )
DFMGI tracks Dubai Financial Market which is the largest financial trading exchange in the United Arab Emirates. Dubai has emerged as a global city and business hub of the Middle East , it’s contently growing bigger and becoming one of most expensive city in the world. The Dubai Financial Market (DFM) was founded on 2000, looking at it’s index chart you may say it’s quite different from the rest but we do believe in EWF that there is only one market and every instrument is related to another. Which explain having a different structure or sequence doesn’t necessarily mean that’s trading on it’s own, because the bigger cycles are the same among the different groups of the market.
DFMGI Elliott Wave View
Last year, DFMGI rallied like the rest of world Indices and we can notice that it has a bullish structure in wave (1) unfolding as 5 impulsive waves from January 2016 low followed by a flat correction during the middle of the year in wave (2) and finally it managed to resume the rally from November lows to be make new high.
The index recently ended wave 2 pullback as a double three correction reaching equal legs area 3467 – 3423 from which it bounced higher and still needs to break above February peak to open more extension to the upside. The correction in wave 2 may persist if DFMGI manage to break 03/29 low but it should remain supported while the pivot at 3195 low keeps holding.
Zooming out to the weekly chart, we can notice that early this year DFMGI broke above the descending trend-line from 2014 peak which is confirming the bullish reversal started last year. Consequently if the Index manage to resume higher then the next target for the bulls would come around 4213 – 4840 area.
In case DFMGI holds below February peak and the pivot at November low gives up , then the Index could have ended the whole cycle from 2016 low and it will be looking to do a deeper correction toward the 50%-61.8 % Fibonacci area ( 3169 – 3034 ) before it can resume the move higher.
Recap:
DFMGI is one of the important Indices in the Middle East , its sharing the same cycle with the rest of world Indices and suggesting that there should be more upside to come if it manage to hold above November 2016 low. A deeper correction may happen but the Index will remain supported as it ended a corrective cycle and has a bullish structure in the bigger time frames.
Elliott Wave View: AUDCAD Calling The Decline
In this Technical blog we are going to take a quick look at the past 1 hour Elliott wave performance of AUDCAD cycle from March 20 peak (1.0332), which we presented to our clients at elliottwave-forecast.com. We are going to explain the structure from that peak below
AUDCAD 3/29 1 Hour NY Updated Chart
The cycle from January 06 low has ended in the pair at March 20 peak (1.0332). The structure from the peak looks to be overlapping, hence suggesting it's corrective structure from the peak. First leg lower ended i.e. Minor wave W at (1.0169) & Minor wave X was expected to end in 3 swings between 50-764% Fibonacci retracement area (1.0246-1.0291) followed by extension lower.
AUDCAD March 30 1 Hour NY Updated Chart
The pair found the seller's as expected from blue box area 50-764% Fibonacci retracement area (1.0246-1.0291) & ended Minor wave X at (1.0255). While below there & most importantly as far as pivot from (1.0332) peak stayed intact, pair was expected to turn lower again initially towards 1.0176-1.0137 to see a 3 wave bounce in Minutte wave (x) against (1.0255) peak before continuation lower.
AUDCAD 1 Hour April 2, Weekend Updated Chart
The pair got the the bounce from above mentioned area & failed below the 1.0255 peak as expected. Note that, we adjusted the degree of labels but the pair keep rejecting in bounces & continues to slide lower towards 1.0126-1.0110 area lower to see a 6th swing bounce from 1.0332 peak in Minutte wave (x).
AUDCAD 1 Hour April 3, NY Updated Chart
The pair got the 3 swings bounce as expected from mentioned blue box area 1.0126-1.0110 in Minutte wave (x) & found sellers in between 1.0184-1.0212 area. Afterwards pair resumed the decline lower & while below 1.0255 peak pair should be looking for 1 more push lower towards 1.0074-1.0032 area to end 7 swings double three from 1.0332 peak before pair starts the 3 waves back.
Australia’s Home Loans Surprisingly Fell In February
For the 24 hours to 23:00 GMT, the AUD declined 0.54% against the USD and closed at 0.7499 on Friday.
LME Copper prices declined 1.7% or $100.5/MT to $5770.0/MT. Aluminium prices declined 1.4% or $26.5/MT to $1929.5/MT.
In the Asian session, at GMT0300, the pair is trading at 0.7482, with the AUD trading 0.23% lower against the USD from Friday's close.
Early morning data indicated that Australia's home loans unexpectedly dropped by 0.5% in February, compared to a revised rise of 0.4% in the prior month, while markets were expecting for a flat reading.
The pair is expected to find support at 0.7456, and a fall through could take it to the next support level of 0.7429. The pair is expected to find its first resistance at 0.7527, and a rise through could take it to the next resistance level of 0.7571.
Moving ahead, market participants focus on Australia's NAB business confidence index for March, slated to release in the early hours of tomorrow.
The currency pair is trading below its 20 Hr and 50 Hr moving averages.

German Industrial Output Surprisingly Jumped In February, Trade Surplus Widened More Than Anticipated In The Same Month
For the 24 hours to 23:00 GMT, the EUR declined 0.48% against the USD and closed at 1.0592 on Friday.
In economic news, Germany's seasonally adjusted industrial production unexpectedly rose 2.2% on a monthly basis in February, driven by robust activity in the construction sector. Industrial production registered a revised similar rise in the prior month, while markets were expecting for a fall of 0.2%. Moreover, the nation's seasonally adjusted trade surplus expanded more-than-expected to a level of €19.9 billion in February, on the back of an increase in exports, while investors had envisaged the nation to post a surplus of €17.7 billion. In the previous month, the nation had reported a revised surplus of €14.9 billion.
The US Dollar gained ground against its major counterparts on Friday, after an influential Federal Reserve official, William Dudley, stated that central bank's plan to shrink its bond portfolio later this year would prompt only a “little pause” in the central bank's rate hike plans.
The greenback initially lost ground against its major peers, after the latest jobs report painted a mixed picture of the nation's labour market.
Non-farm payrolls in the US rose less-than-anticipated by 98.0K in March, adding the least number of jobs in ten months, as inclement weather weighed on the nation's job growth. Non-farm payrolls had registered a revised gain of 219.0K in the previous month, while markets expected for an advance of 180.0K. However, the nation's unemployment rate unexpectedly fell to a nearly ten-year low level of 4.5% in March, whereas markets anticipated unemployment rate to remain unchanged at 4.7%. Also, the nation's average hourly earnings of all employees advanced 0.2% on a monthly basis in March, meeting market consensus and compared to a revised rise of 0.3% in the prior month.
In other economic news, consumer credit in the US climbed to a level of $15.2 billion in February, compared to a level of $10.9 billion in the previous month. Further, the nation's final wholesale inventories advanced 0.4% in February, in line with market expectations and following a similar rise in the preceding month.
In the Asian session, at GMT0300, the pair is trading at 1.0574, with the EUR trading 0.17% lower against the USD from Friday's close.
The pair is expected to find support at 1.0539, and a fall through could take it to the next support level of 1.0505. The pair is expected to find its first resistance at 1.0637, and a rise through could take it to the next resistance level of 1.0701.
Going ahead, investors will look forward to the Euro-zone's Sentix investor confidence index for April, slated to release in a few hours. Moreover, a speech by the US Federal Reserve Chair, Janet Yellen, due later today, will also be closely watched by traders.
The currency pair is trading below its 20 Hr and 50 Hr moving averages.

UK’s Manufacturing, Industrial And Construction Output, All Surprisingly Fell In February
For the 24 hours to 23:00 GMT, the GBP declined 0.76% against the USD and closed at 1.2370 on Friday, after an unexpected downturn in UK's manufacturing, industrial and construction sector dented the nation's growth prospects in the first-quarter of 2017.
Data revealed that Britain's industrial production unexpectedly eased 0.7% on a monthly basis in February, defying market expectations for an advance of 0.2%. In the prior month, industrial production had registered a revised drop of 0.3%. Moreover, the nation's manufacturing production surprisingly dropped 0.1% MoM in February, compared to a revised drop of 1.0% in the prior month, while market participants anticipated for a rise of 0.3%. Also, the nation's construction output unexpectedly declined 1.7% in February, led by weakness in infrastructure activity and confounding market expectations for an advance of 0.1%. In the previous month, construction output had registered a revised flat reading.
Other economic data showed that total trade deficit in the UK surprisingly expanded to a level of £3.66 billion in February, triggered by a jump in imports of non-monetary gold and aircraft, whereas market expected the nation's trade deficit to narrow down to a level of £2.20 billion. The nation had posted a revised deficit of £2.97 billion in the previous month. Moreover, the nation's leading think tanker, NIESR estimated UK's gross domestic product (GDP) rose less-than-expected by 0.5% in the January-March 2017 period, compared to a revised similar rise in the three months ended February. Meanwhile, markets expected for an expansion of 0.6%.
In the Asian session, at GMT0300, the pair is trading at 1.2375, with the GBP trading marginally higher against the USD from Friday's close.
The pair is expected to find support at 1.2332, and a fall through could take it to the next support level of 1.2288. The pair is expected to find its first resistance at 1.2448, and a rise through could take it to the next resistance level of 1.252.
With no economic releases in UK today, investor sentiment will be governed by global macroeconomic factors.
The currency pair is trading below its 20 Hr and 50 Hr moving averages.

Japan Recorded A Trade Surplus In February
For the 24 hours to 23:00 GMT, the USD rose 0.32% against the JPY and closed at 111.19 on Friday.
In the Asian session, at GMT0300, the pair is trading at 111.43, with the USD trading 0.22% higher against the JPY from Friday’s close.
Overnight data revealed that Japan posted a more-than-expected trade surplus (BOP basis) of ¥1076.8 billion in February, compared to market expectations for the nation to post a surplus of ¥981.7 billion and following a deficit of ¥853.4 in the preceding month.
Meanwhile, the Bank of Japan Governor, Haruhiko Kuroda, vowed that the central bank will continue with aggressive easing until achieving 2.0% inflation target.
The pair is expected to find support at 110.50, and a fall through could take it to the next support level of 109.58. The pair is expected to find its first resistance at 111.96, and a rise through could take it to the next resistance level of 112.50.
The currency pair is trading above its 20 Hr and 50 Hr moving averages.

Swiss Unemployment Remained Steady In March
For the 24 hours to 23:00 GMT, the USD rose 0.35% against the CHF and closed at 1.0087 on Friday.
On the data front, Switzerland’s seasonally adjusted unemployment rate remained steady at 3.3% in March, meeting market expectations.
In the Asian session, at GMT0300, the pair is trading at 1.0099, with the USD trading 0.12% higher against the CHF from Friday’s close.
The pair is expected to find support at 1.0049, and a fall through could take it to the next support level of 1.0000. The pair is expected to find its first resistance at 1.0126, and a rise through could take it to the next resistance level of 1.0154.
The currency pair is trading above its 20 Hr and 50 Hr moving averages.

Canada’s Unemployment Rate Rose As Expected In March
For the 24 hours to 23:00 GMT, the USD declined 0.06% against the CAD and closed at 1.3408 on Friday.
Macroeconomic data showed that unemployment rate in Canada registered a rise to 6.7% in March, meeting market expectations. In the previous month, the unemployment rate had recorded a reading of 6.6%. Meanwhile, the nation's net number of people employed increased more-than-anticipated to a level of 19.4K in March, compared to a gain of 15.3K in the previous month.
In the Asian session, at GMT0300, the pair is trading at 1.342, with the USD trading 0.09% higher against the CAD from Friday's close.
The pair is expected to find support at 1.3365, and a fall through could take it to the next support level of 1.3309. The pair is expected to find its first resistance at 1.3451, and a rise through could take it to the next resistance level of 1.3481.
Ahead in the day, traders would keep a close watch on Canada's housing starts for March.
The currency pair is trading above its 20 Hr moving average and showing convergence with its 50 Hr moving average.
