Sample Category Title
AUD/USD Trades at Short-Term Major Support Zone
AUD/USD has turned bearish since the end of March, seeing 6 bearish sessions out of the 7 trading sessions, marking the worst weekly performance this year.
The slump was caused by the strengthening of USD and the fall in iron ore prices.
The current trend remains bearish. On the 4-hourly chart, the price still trades below the 10 and 20 SMAs.
This morning during early European session, AUD/USD hit a 12-week low of 0.7475, the significant support level at 0.7500 was broken.
The range between 0.7475 - 0.7500 is the short-term major support zone.
The bulls are attempting to recover the level at 0.7500. If the bulls are unsuccessful in breaching 0.7500 and holding above the support line at 0.7475, the likelihood will be that the downtrend will continue, and the bears will test the next significant support line at 0.7450.
Conversely, if the bulls are successful in holding the downtrend, we will likely see a rebound here.
Both the daily and 4-hourly Stochastic Oscillator readings are below 20, suggesting a rebound.
The resistance level is at 0.7500, followed by 0.7520 and 0.7535.
The support line is at 0.7475, followed by 0.7450 and 0.7430.
Keep an eye on the Fed Chair Yellen's speech at 21:10 BST this evening, as it will likely affect the strength of USD and the trend of AUD/USD.


DAX Edges Lower To Start off Week, German Investor Confidence Next
The DAX Index has edged lower in Monday trading. Currently, the DAX is trading at 12,208.69. In economic news, Eurozone Sentix Investor Confidence jumped to 23.9, beating the estimate of 20.1 points. On Tuesday, Germany releases ZEW Economic Sentiment, a key indicator which should be treated as a market-mover.
The eurozone economy has shown stronger growth in the first quarter, and this has been reflected in the DAX ,which has recorded gains of 4.8 percent during this time. Germany has led the way, with strong manufacturing and services numbers. With economic conditions improving, investor confidence levels have followed suit and posted strong numbers in Q1. Eurozone Sentix Investor Confidence climbed to 23.9 points in April, pointing to strong optimism among investors and analysts. On Tuesday, Germany releases ZEW Economic Sentiment, which surveys the mood of German investors. The markets are expecting a strong reading for April, with the indicator expected to climb to 13.2 points, up from 12.8 points in March.
The US labor market remains very tight, but there was surprising news on Friday, as Nonfarm Payrolls was a big disappointment. The economy produced just 98 thousand jobs in March, way off the forecast of 174 thousand. However, the DAX shrugged off the weak numbers. The good news is that the weak reading was not accompanied by higher unemployment numbers. The unemployment rate dropped to 4.5% and jobless claims fell sharply to 234 thousand. This means that the soft payrolls report is unlikely to change the Fed's expected course of action of two more hikes in 2017 (a majority of FOMC voting members favor two more hikes, while some members have called for three more hikes this year). According to the CME Group, the markets have circled June as the next likely date for a hike, which is priced in at 67 percent. The Fed would like to see inflation move closer to its target of two percent, and we'll get a look at consumer inflation reports on Friday.
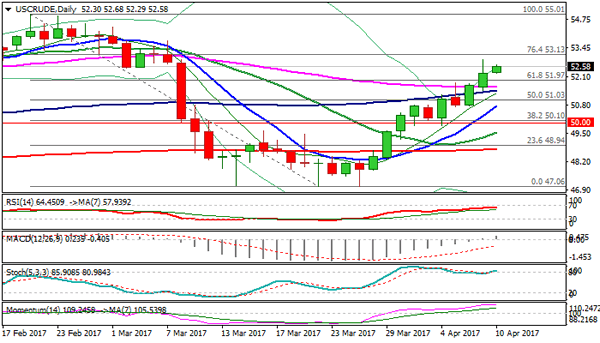
Technical Outlook: Crude Oil Maintains Strong Bullish Stance
US oil maintains strong bullish stance on Monday and holding above Friday's closing level at $52.27, after rally spiked to $52.92, the highest since 08 Mar.
Strong bullish sentiment is supported by bullish daily studies and Friday's close above $51.97 (Fibo 61.8% of $55.01/$47.06 downleg), seeing scope for test of next target at $53.13 (Fibo 76.4% retracement.
Slow stochastic on daily chart turned north and entered again overbought territory after briefly reversing lower, signaling that correction signals are on hold.
Session low at $52.29 marks initial support, ahead of broken Fibo 61.8% at $51.97 and broken daily 55SMA at $51.63.
Res: 52.68; 52.92; 53.13; 53.78
Sup: 52.29; 51.97; 51.63; 51.49
The ‘Mighty’ Dollar Finds Geopolitical Support
Monday April 10: Five things the markets are talking about
Capital markets are showing resilience this morning in the face of last Friday's weaker than expected non-farm payroll report (NFP) and heightened geopolitical tensions, with demand for haven assets fade a tad.
While the U.S jobs report was weaker than some had expected, it's consistent with the U.S. economy growing at +2% this year, the miss is being shrugged off as a one-off due to weather impact.
Nevertheless, geopolitical risk remains a concern in the wake of Syria strikes last week as a U.S destroyer approaches the Korean peninsula.
Last week's meeting between China President Xi and President Trump is being viewed as a success. The world's largest economy has reportedly offered improved market access for U.S financial sector investments and beef exports in a move to avert a trade war.
In Europe, this week features price data from several countries including the U.K, Germany, France and Italy. Given the ECB's focus on its inflation target, this data will be important for the Bank's policy assessment later this month.
Elsewhere, China will release price data along with its merchandise trade numbers, while both Australia and the U.K release their respective jobs report.
In North America, the biggest news is likely to be Friday's U.S retail sales report where no change is expected (+0.2%). On Wednesday, the BoC publishes its monetary policy announcement.
1. Global equities see mixed response to geopolitical tensions
Global stocks are starting this holiday-shortened week stuck in neutral ahead of U.S. earnings season.
Note: Stocks have traded flat over the past month as investors, after the +10% rise since last November's lows, have taken valuations above the long-term averages - 16 times forward earnings, compared to a 15-year average of about +14 times.
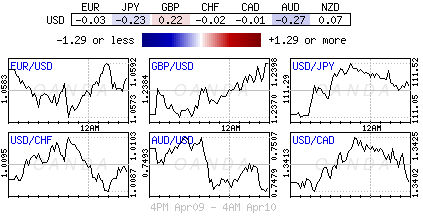
In Japan, the Topix index rose +0.7%, advancing for a second day, while the Nikkei was up on a weak yen (¥111.30) with financials outperforming on rising U.S yields.
Elsewhere, the Aussie S&P/ASX 200 Index added +0.9%. In Hong Kong, the Hang Seng index fell -0.1%, while China's Shanghai Composite slipped -0.5%. In South Korea, the Kospi index declined -0.9%, dropping for a fifth consecutive day for the longest losing streak in 10-months.
In Europe, equity indices are trading generally lower. Banking stocks are trading mixed in the Eurostoxx despite while commodity and mining stocks are lower in the FTSE 100.
U.S stocks are set to open in the 'black' (+0.1%).
Indices: Stoxx50 -0.3% at 3,483, FTSE flat at 7,351, DAX -0.1% at 12,210, CAC-40 -0.5% at 5,110, IBEX-35 -0.4% at 10,486, FTSE MIB -0.2% at 20,252, SMI -0.5% at 8,599, S&P 500 Futures +0.1%
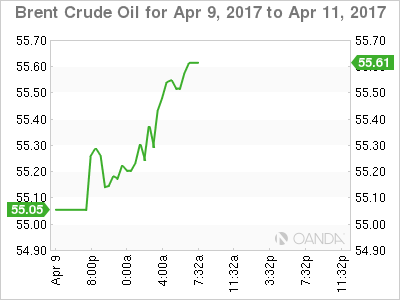
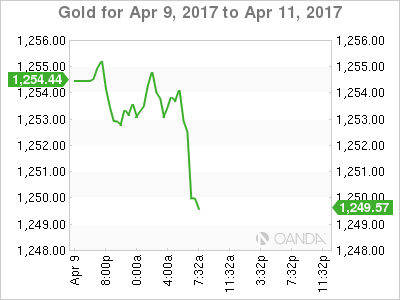
2. Oil up on strong demand, uncertainty over Syria, gold lower
Currently, oil prices are being supported by strong demand and uncertainty over the conflict in Syria. For the time being, a run-up in U.S drilling activity is keeping a lid on these gains.
Brent crude futures are at +$55.49 per barrel, up +25c, or +0.45% from Friday's close, while U.S West Texas Intermediate (WTI) crude futures are up +25c, or +0.46% at +$52.48 a barrel.
However, another increase in U.S. oil drilling - for the twelfth consecutive week and taking the count to 672 rigs, which is the highest since August 2015 - is keeping investors from breaking last week's one-month highs of over +$56 per barrel.
Note: Although Syria has limited oil production; its location in the Middle East and alliances with big oil producers raises concerns about spreading conflict that could disrupt crude shipments. Both Russia and Iran, staunch allies of Syria, condemned the attacks.
In oil supply fundamentals, the market remains oversupplied, even with efforts led by the OPEC to cut supplies to support global prices.
Gold prices remain steady (unchanged at $1,253.86 per ounce) with growing geopolitical tensions continuing to drive safe-haven demand.
Yesterday, aides to Trump differed on where Syrian/U.S policy was heading. However, U.S Secretary of State Tillerson has warned that the Syrian strikes are a warning to other nations, including North Korea.
3. French debt still an issue
Data from the Japanese MoF overnight showed record selling of French government bonds by domestic investors in February. Investors sold -¥1.504T of French debt or OAT's that month.
It was by far the most heavily sold government bond asset in Japan, as net selling of U.S Treasury's - the second most heavily sold asset - amounted to just +¥127B. The French are heading to the polls to elect a new president on April 23. The second round is scheduled for May 7.
Note: Some market participants continue to forecast more selling. Currently, French/Bund spread is at +70 bps, off from February's high of +80 bps.
Elsewhere, the yield on 10-year Aussie bonds backed up +2 bps to +2.57%, while U.S 10's fell -1 bps to +2.37%, after climbing +4 bps on Friday.
4. The 'mighty' dollar finds geopolitical support
Aside of geopolitical support, the USD is finding support from Fed rhetoric.
The Fed's typically more 'dovish' voter Dudley, whose recent comments are being perceived to be increasingly more 'hawkish.' Also, Fed member Bullard also noted that the underwhelming U.S jobs report fro March is in line with their view of +2% inflation and modest growth.
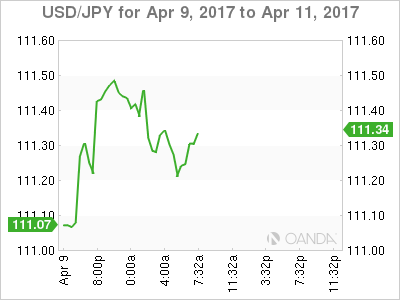
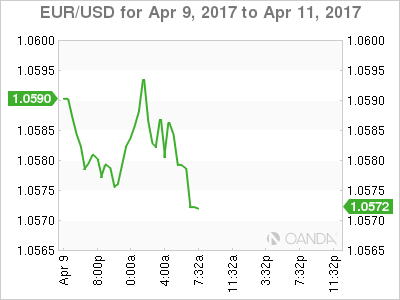
Ahead of the U.S open, the USD is trading atop of its three-week high, aided by geopolitical risks. The EUR (€1.0577) is a tad lower despite continued improvement in the regions confidence data. Data this morning showed that Sentix climbed to 23.9 vs. 20.1e.Teh single unit continues to be pressured by regional political concerns ahead of the French elections. USD/JPY is higher, up +0.3% at ¥111.35 aided by Fed's Dudley affirmation that the Fed was getting closer to shrinking its balance sheet.
Elsewhere, South Korea's won (KRW) fell -0.7%, sinking for a fifth consecutive day and the longest losing streak this year, while the AUD fell -0.2% (A$0.7489) after February home-loan data was weaker than expected.
5. Euro implied volatility surges on new French polls
Market nerves over the outcome of the France's presidential election have increased this morning after the far-left politician Jean-Luc Melenchon jumped in the latest polls, making the election a 'viable' four-way contest. This is supporting the probability of a second-round contest between the Communist-backed candidate and the anti-euro Marine Le Pen.
French/Bund spreads have widened + 3 bps, while the CAC (-0.5%) coming under renewed pressure.
Note: Emmanuel Macron remains the front-runner. Current polls show him tied with Marine Le Pen in the first round of the election, on April 27, but trouncing the National Front leader by -20% in the May 7 runoff.
Note: Liquidity heading into the Easter holiday in Europe is expected to exacerbate the moves in rates and currency markets.
Federal Reserve Chair Yellen Will be Speaking Later Today
- Dollar strengthens against Asian currencies
- Federal Reserve Chair Yellen will be speaking later today
- Bank of Canada (BoC) will be the highlight of the week
Overnight, the Dollar edged mildly higher, but quickly turned to mixed fortunes. The USD is somewhat supported by comments from Federal Reserve officials. St. Louis Federal Reserve President, James Bullard, reiterated opinions of other officials and said the Federal Reserve could start winding down its $4.5T balance sheet later this year. In contrast, New York Federal Reserve President, William Dudley, spoke on Friday and said that shrinking the balance sheet would only prompt a "little pause" in tightening. Weaker employment growth in the US reported on Friday did not affect risk appetite significantly and equity markets emerged relatively unscathed, as did the Dollar. The Dollar also seems to have strengthened as President Trump's threats of tariffs on Chinese goods have been scaled down since the election campaign and the two day summit between the US President and Chinese leader Xi Jinping were conducted in a constructive manner. Both stated that a quick trade agreement needs to be in place and China were also open to renewed access to the financial sector and abolished tariffs on certain US goods.
Today, Federal Reserve Chair, Janet Yellen, will speak, so markets await hints of her view on rates and balance sheet. It is likely that US President Donald Trump's implementation of his election promises of fiscal stimulus could be another factor, and more than likely a main focus.
The Bank of Canada (BoC) rate decision will be the highlight of the week. The Bank of Canada is widely expected to keep their interest rate unchanged at 0.50%. The tone of the statement could remain slightly dovish, in spite of improvements in economic data. Nonetheless, the Canadian Dollar will likely follow more on oil prices as West Texas Intermediate (WTI) crude oil could be heading back to 55.24 resistances due to geopolitical tensions.
In addition to that, we have a busy week on the data front, with UK Inflation and Employment data, German ZEW, the China Consumer Price Index (CPI), Producer Price Index (PPI) and Trade Balance, Australian Employment figures, the US Consumer Price Index (CPI) and Retail Sales data, all of which will be closely watched in a holiday shortened week, ahead of the long Easter weekend.
Spring jokes
Why did the farmer bury all his money?
To make his soil rich!
What did the summer say to the spring?
Help! I'm going to fall.
What kind of garden does a baker have?
A "flour" garden.
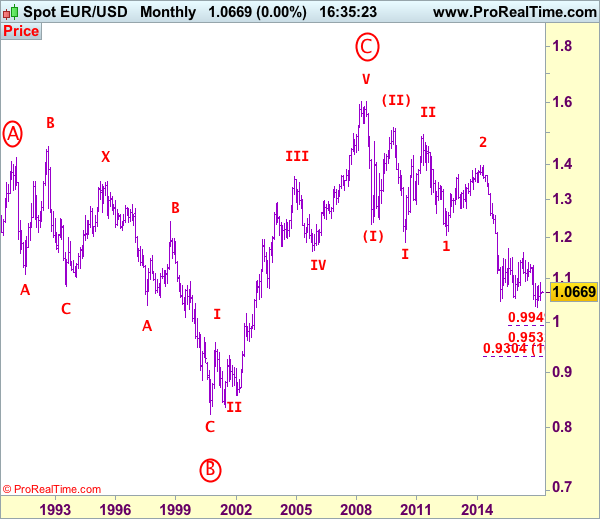
EUR/USD Elliott Wave Analysis
EUR/USD – 1.0877
EUR/USD: Wave (c) of 2 ended at 1.3993 and wave 3 of III has commenced for weakness to 1.0411 (1.236 of wave 1), then 1.0000.
As the single currency has fallen again after brief recovery last week, adding credence to our view that top has been formed at 1.0906 earlier and consolidation with downside bias remains for weakness to 1.0525, however, a daily close below support at 1.0493 is needed to confirm correction from 1.0340 low has ended at 1.0906, bring further fall to 1.0450-55. Looking ahead, below there would signal early downtrend has resumed and extend fall to 1.0400 and later towards this year’s low at 1.0340 later.
Our preferred count on the daily chart remains that a wave (II) from 1.2329 ended at 1.5145 with A-leg ended at 1.4720, followed by wave B at 1.2457, the wave C from there was also a 3 legged move and is labeled as (a): 1.3739, (b): 1.2885, the wave iii of the 5-waver (c) from 1.2885 has ended at 1.4339 and wave iv is a triangle ended at 1.3878 and wave v formed a top at 1.5145. The decline from there is a 5-waver (C) with minor wave (i) of I of (C) ended at 1.4218 with wave (ii) ended at 1.4580, wave (iii) ended at 1.3267 and wave (iv) ended at 1.3692 and wave (v) ended at 1.1876, this is also the low of wave I of (C) and wave II ended at 1.4940, hence wave III is now in progress with a diagonal wave 1 ended at 1.2042, the breach of previous support at 1.1876 (wave I trough) adds credence to our view that the wave 2 has ended at 1.3993, wave 3 has commenced for further weakness to 1.0411, then towards 1.0000.
On the upside, whilst initial recovery to 1.0640-50 cannot be ruled out, reckon upside would be limited to 1.0670-80 and bring another decline. Above 1.0765-70 would defer and suggest first leg of decline from 1.0906 has ended, bring a stronger rebound to 1.0800-10 but price should falter well below 1.0870-75 and bring another decline. In the unlikely event euro breaks above resistance at 1.0906, this would shift risk back the upside for the erratic rise from 1.0340 low to bring retracement of early downtrend to 1.0930-35 (61.8% Fibonacci retracement of 1.1300-1.0340), then 1.1000.
Recommendation: Sell at 1.0680 for 1.0480 with stop above 1.0780.
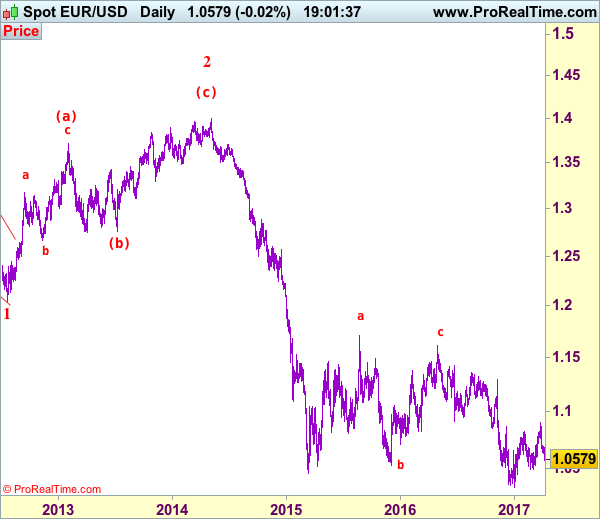
Euro's long-term uptrend started from 0.8228 (26 Oct 2000) with an impulsive structure. The rise from 0.8228 to 0.9593 (5 Jan 2001) is labeled as wave I, the retreat to 0.8352 (6 Jul 2001) is wave II and the rally to 1.3670 (31 Dec 2004) is wave III. Wave IV from there ended at 1.1640 (15 Nov 2005), the subsequent upmove to 1.6040 (July 15, 2008) is treated as wave V, the major selloff from the record high of 1.6040 to 1.2329 (October 27, 2008) signals a reversal has taken place with (I) leg ended at 1.2329 and once (II) ended at 1.5145, wave (III) itself is an extended move with I: 1.1876 and complex wave II ended at 1.4902, wave III has commenced with wave 1 and 2 ended at 1.2042 and 1.3993 respectively, wave 3 of III is now unfolding for weakness towards parity.
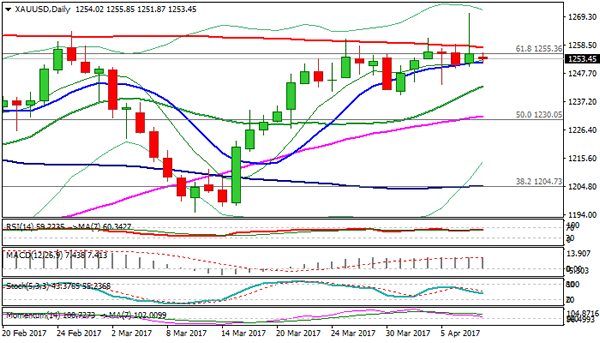
Technical Outlook: GOLD – Strong Upside Rejection On Friday Keeps The Downside Vulnerable
Spot Gold is trading within narrow range on Monday, supported by 10SMA at $1251, but with limited upside action, holding below strong 200SMA barrier at $1257.
Last Friday's spike to fresh five-month high at $1270 was short-lived, as subsequent pullback brought the price back to $1250 zone, where it found footstep.
Friday's strong upside rejection that formed daily candle with long upper shadow, weighs on near-term action, as the price failed to close above 200SMA for the fourth consecutive time.
Near-term studies weakened and see risk of deeper pullback on loss of 10SMA handle, as the price is losing momentum on daily chart.
Gold price may extend pullback from $1270 peak towards next strong support at $1243 (Fibo 38.2% of $1197/$1270 rally / rising 20SMA) before broader bulls re-assert.
200SMA is key and eventual close above it would generate stronger bullish signal.
Res: 1255, 1257, 1263, 1270
Sup: 1251, 1249, 1243, 1239
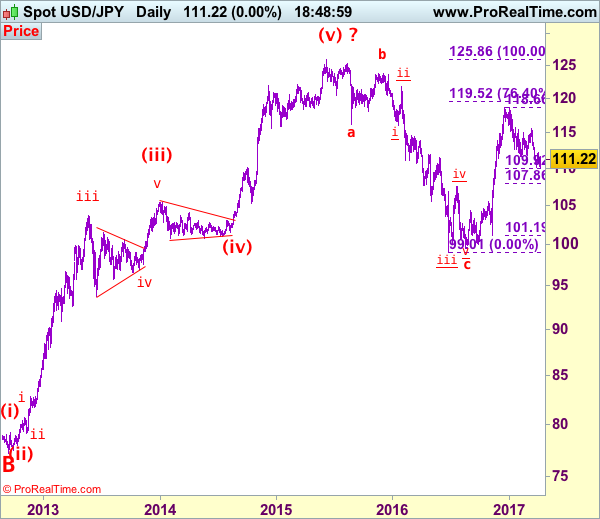
USD/JPY Elliott Wave Analysis
USD/JPY - 111.25
USD/JPY – Wave V of larger degree circle V has possibly ended at 75.31 and major correction has commenced and already met indicated target at 125.00.
Although the greenback fell to as low as 110.13 late last week, as price has recovered again after holding above indicated support at 110.11, retaining our view that further consolidation above this level would be seen and corrective bounce to 111.90-00 cannot be ruled out, however, reckon upside would be limited to 112.80-85 and bring another decline later. A break of said support at 110.11 would signal the erratic decline from 118.66 top is still in progress, bring retracement of early upmove to 109.90-95 (50% Fibonacci retracement of 101.19-118.66) and then 109.50 but reckon downside would be limited to 109.00 and price should stay well above 107.85-90 (61.8% Fibonacci retracement), bring rebound later.
Our preferred count is that, triangle wave IV (with circle) ended at 101.45 and the circle wave V brought dollar down to the record low of 75.31 in 2011 and the subsequent rebound signal major correction has commenced with A leg ended at 84.19, followed by wave B at 77.14 and impulsive wave C is now unfolding (indicated upside target at 125.00 had been met) for gain towards 127.00 level. In the event dollar drops below support at 99.01, this would confirm medium term decline from 125.86 top (2015 high) has resumed for subsequent weakness to 98.00 and possibly 97.00.
Under this count, this wave C is unfolding as impulsive waves with (1) (2), 1 2 ended at 80.67, 79.07, 82.84 and 81.69 respectively, hence the extended wave 3 has ended at 103.74 and wave 4 correction of recent upmove should bring weakness to 92.57, then towards 90.88 but psychological support at 90.00 should limit downside and bring another rally later in wave 5, indicated target at 125.00 had been met and gain to 127.00 cannot be ruled out but reckon price would falter below 130.00.
On the upside, whilst initial recovery to 111.90-00 cannot be ruled out, reckon upside would be limited to 112.80-85 and bring another decline later. A daily close above 113.54 would abort and signal low is formed instead, bring a stronger rebound to 114.00-10 and possibly 115.10-20 but resistance at 115.51 should remain intact, bring another decline.
Recommendation: Sell at 112.80 for 110.80 with stop above 113.80.
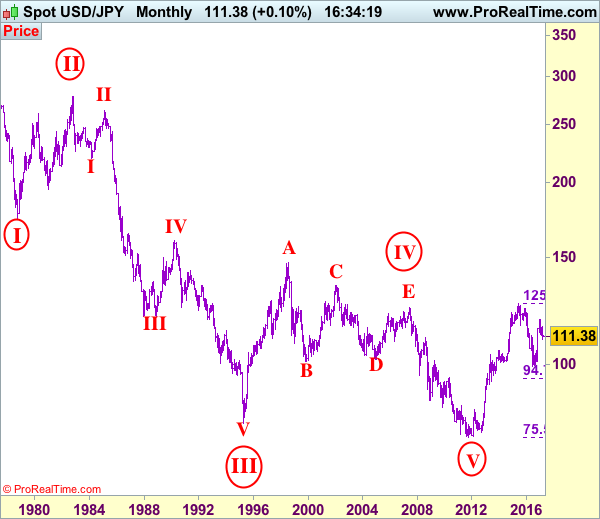
On the monthly chart, we have changed our preferred count that an impulsive wave is unfolding with major wave III with circle ended at 79.75, then followed by wave IV with circle and is labeled as a triangle with A: 147.64 (11 August, 1998), B: 101.25, C: 135.20, D: 101.67 and E leg ended at 124.14 to end the wave IV with circle. Hence, wave V with circle commenced from there and hit a record low of 75.31, however, the subsequent strong rebound signals this circle wave V has possibly ended there, hence gain to (indicated upside target at 122.00 and 125.00 had been met), the retreat from 125.86 suggests wave A of major correction has ended there and wave B correction back to 99.00, then 95.00 would be seen, however, reckon downside would be limited to 90.00, bring another rebound in wave C next year.
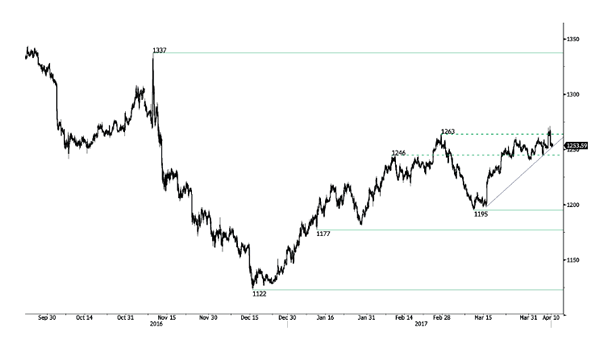
Gold Breaking Resistance At $1263, Silver Random Sell-Off, Crude Oil Continued Bullish Move.
Gold Breaking resistance at $1263.
Gold challenge to near term resistance has paused yet, momentum seems back to bullish despite some consolidation. Resistance is located at 1263 (27/02/2017 high). Hourly support can be found at 1224.10 (16/03/2017 low).
In the long-term, the technical structure suggests that there is a growing upside momentum. A break of 1392 (17/03/2014) is necessary ton confirm it, A major support can be found at 1045 (05/02/2010 low).
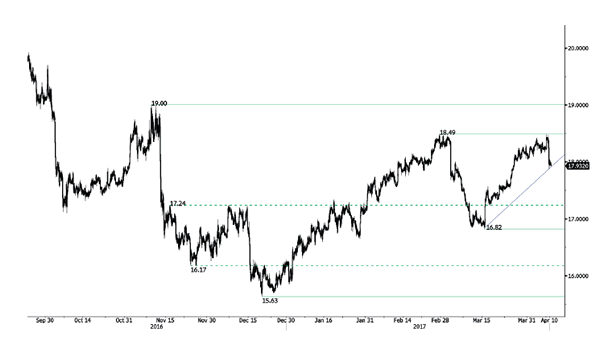
Silver Random sell-off.
Silver is trying to find a new equilibrium after its massive sell-off. Strong resistance is given at a distance at 18.49 (27/02/2017 high). Key support is given at 16.82 (15/03/2017 low).
In the long-term, the death cross indicates that further downsides are very likely. Resistance is located at 25.11 (28/08/2013 high). Strong support can be found at 11.75 (20/04/2009).
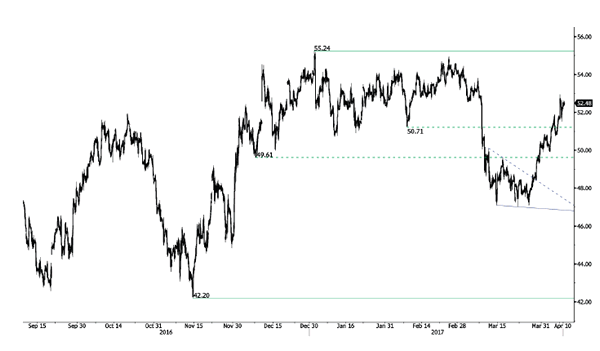
Crude oil Continued bullish move.
Crude oil keeps on increasing. The commodity had been located in a bearish trend since the commodity had been unable to mount a serious challenge to resistance at 55.24 (03/01/2017 high) but now the pair is heading higher. Resistance is given at 51.88 (05/041/2017 high). Hourly support is given at 47.09 (22/03/2017 low).
In the long-term, crude oil has recovered after its sharp decline last year. However, we consider that further weakness are very likely. Strong support lies at 24.82 (13/11/2002) while resistance can now be found at 55.24 (03/01/2017 high).
EUR/CHF Remains Below Its Declining Trendline, EUR/JPY Minor Bounce, EUR/GBP Consolidating After Sharp Decline.
EUR/CHF Remains below its declining trendline.
EUR/CHF has paused near the key support at 1.0684 (see also the falling channel). However, the persistent succession of lower highs favours a bearish bias. Hourly resistances can be found at 1.0691 (07/04/2017 high). The medium-term pattern suggests us to see continued bearish pressures towards key support that can be found at 1.0623 (24/06/2016 low). Expected to see further decline.
In the longer term, the technical structure is mixed. Resistance can be found at 1.1200 (04/02/2015 high). Yet,the ECB's QE programme is likely to cause persistent selling pressures on the euro, which should weigh on EUR/CHF. Supports can be found at 1.0184 (28/01/2015 low) and 1.0082 (27/01/2015 low).
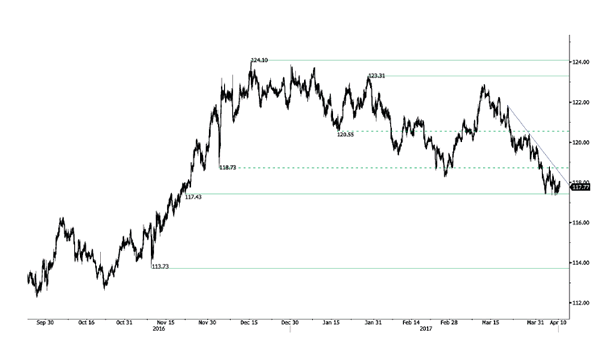
EUR/JPY Minor bounce.
EUR/JPY rejection at 122.88 has triggered a correction. Resistance stands at 122.88 (13/03/0217 high). Support at 117.43 has held up so far however, break would trigger further weakness towards strong support given at 113.73 (09/11/2016 low).
In the longer term, the technical structure validates a medium-term succession of lower highs and lower lows. As a result, the resistance at 149.78 (08/12/2014 high) has likely marked the end of the rise that started in July 2012. Strong support at 94.12 (24/07/2012 low) looks nonetheless far away.
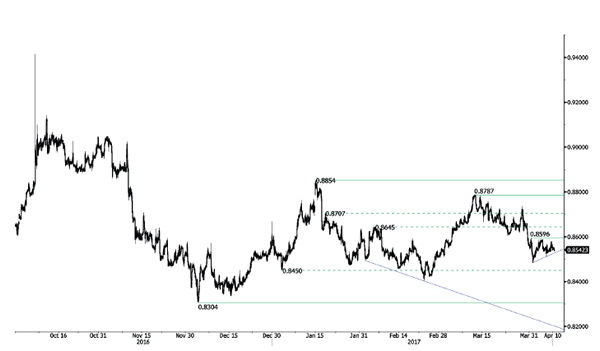
EUR/GBP Consolidating after sharp decline.
EUR/GBP is consolidating following sharp fall. Hourly resistance is given at 0.8591 (05/04/2017 high). Strong resistance is given at 0.8787 (13/03/2017 high). Hourly support can be found at 0.8484 (31/03/2017 low). Expected to show continued weakness.
In the long-term, the pair has largely recovered from recent lows in 2015. The technical structure suggests a growing upside momentum. The pair is trading above from its 200 DMA. Strong resistance can be found at 0.9500 psychological level.