Sample Category Title
Bank Of England Leaves Monetary Policy Unchanged
'The BoE sounds 'less dovish' rather than the expected 'less hawkish'. Interesting'. - Mike van Dulken, Accendo Markets
The Bank of England left its monetary policy unchanged at its March meeting on Thursday. Eight of nine policymakers voted to keep the key interest rate at the record low level of 0.25%. Kristin Forbes, who is due to leave the BoE in June, cast the sole vote in favour of raising interest rates to 0.50%, adding that she was feeling uncomfortable keeping interest rates on hold. According to her, the post-Brexit economic slowdown has not materialised yet. Analysts suggest that the key policy rate will remain unchanged until the Brexit situation becomes clearer. All of the BoE's officials voted anonymously to maintain the asset-buying plan at 435 billion pounds, as markets expected. At the meeting, policymakers stated that slow wage growth and rising inflation, driven by the sharp fall in the value of the Pound, started to put downward pressure on British consumers. Earlier this week, the ONS reported that wage growth fell to 2.2% during the three-month period to January. This drop called into question the BoE's 2017 wage growth forecast of 3%. The BoE also said that it could tolerate a quicker pace of price rises, following a decade of below-target inflation. After the release, the Pound rose to 1.1518 against the Euro and 1.2363 against the US Dollar.
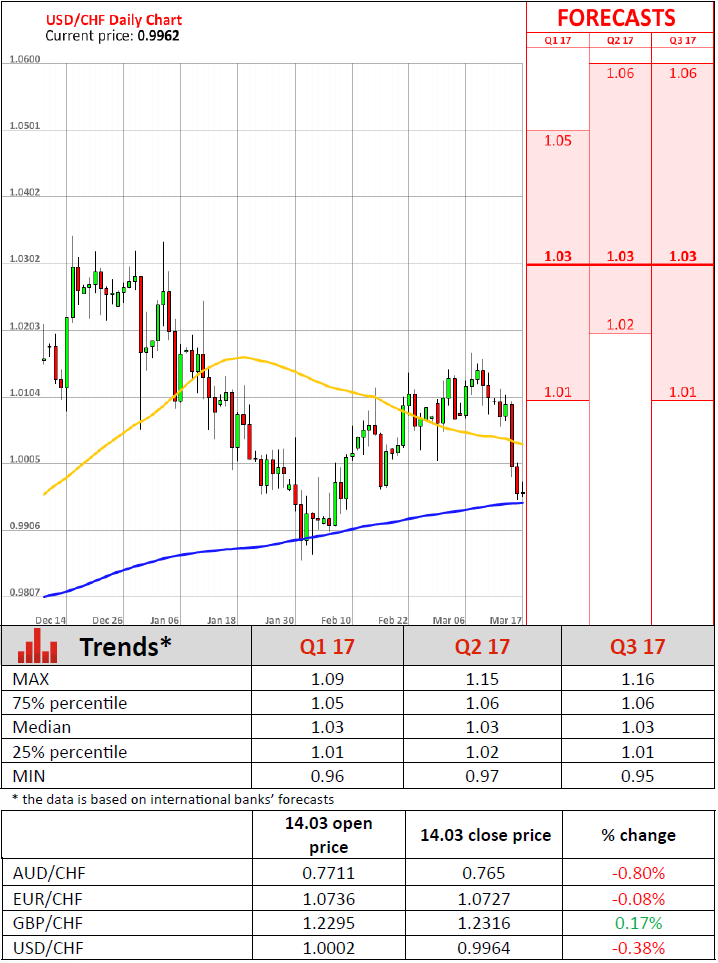
Swiss National Bank Leaves Rates On Hold Amid Overvalued Currency
'2018 seems that it may be the year for the SNB to start normalizing policy'. - Nadia Gharbi, Pictet & Cie
As expected, the Swiss National Bank left its interest rates at historic lows at its monetary policy meeting on Thursday. To avoid further appreciation of the Swiss Franc, policymakers kept the deposit rate at -0.75%, in line with market forecasts. Moreover, the Central bank said it would intervene in the foreign exchange market if necessary, pointing to the 'significantly overvalued' Franc. However, The Swiss Franc traded little changed against the Euro this year but rose around 1.9% against the US Dollar. The Swiss Franc is highly expected to strengthen sharply against most rivals in the near future amid a high-risk aversion environment created by significant uncertainties coming from the upcoming European elections, Donald Trump's trade policies and Britain's exit from the European Union. Earlier this week, The Prime Minister of the Netherlands Mark Rutte lost to its populist rival Geert Wilders during the parliamentary vote. His loss sent shockwaves across Europe, thus adding further uncertainties. In a statement, the SNB also pointed to improving inflation and revised up its 2017 inflation forecast to 0.3%, up from its December estimate of 0.1%. The pace of economic growth in Switzerland is likely to accelerate this year, according to the latest KOF Economic Barometer and PMI.
Housing Construction Accelerates, Applications For Unemployment Benefits Drop, Philly Fed Index Falls
'Builders are buoyed by President Trump's actions on regulatory reform, particularly his recent executive order to rescind or revise the waters of the U.S. rule that impacts permitting'. - Granger MacDonald, NAHB
The number of Americans who filed for unemployment insurance last week decreased to 241,000, a survey from the Labor Department revealed on Thursday, following the preceding week's 243,000 filings. Meanwhile, market analysts anticipated a slight rise to 245,000 during the reported period. The number of new residential building permits issued in February fell 6.2%, the Census Bureau revealed on Thursday. Nevertheless, housing construction advanced 3% and was mainly driven by one-family house applications, whose growth hit a record since September 2007. The spike in construction was mainly attributable to the robust job market and healthier finances. Yet, high mortgage costs and increasing real estate prices remain an issue for potential home buyers. Overall, the situation in the home-building industry remains positive, as the housing market index reached a 12-year high. The diffusion index fell to 32.8 in March, the Philadelphia Fed reported on Thursday. Nonetheless, it remained positive for eight consecutive months. The difference between firms who reported an increase in activity against decrease was 33%. Similarly, the difference between firms reported a rise in employment against unemployment was 17%. So, in general, regional manufacturers maintained optimism.
EUR/USD Reaches Above 1.0750
'Fundamentally, too, the euro zone isn't as fragile as many English-speaking commentators have suggested. Pro-euro sentiment is stable in the currency area's biggest countries.' – Leonid Bershidsky, Bloomberg View
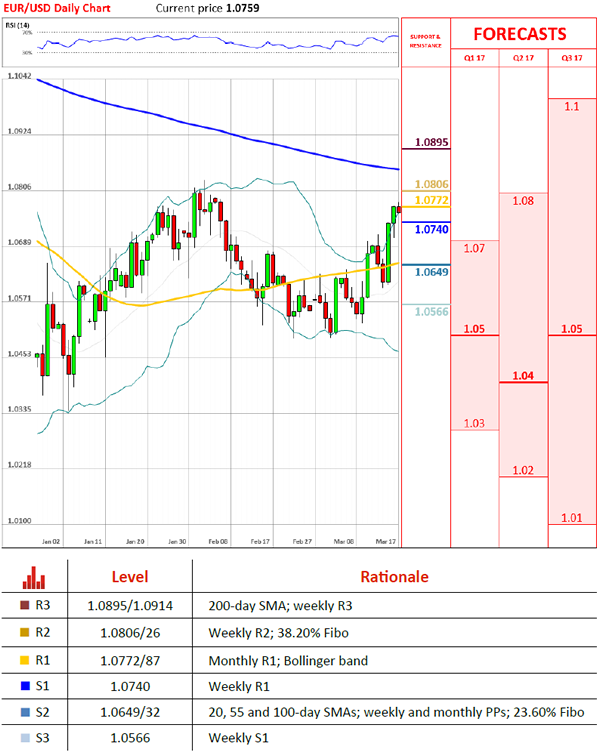
Pair's Outlook
During the early hours of Friday's trading session the common European currency's surge against the US Dollar was stopped by the resistance put up by the upper Bollinger band, which was located at the 1.0786 level. As a result the rate was in a retreat. However, the retreat is likely going to be short lived. As the upper Bollinger band moves higher, the currency exchange rate will set its course to the weekly R2, which is located at 1.0806. There the pair might stop for a while, as the weekly R2 is strengthened by the 38.20% Fibonacci retracement level at 1.0826.
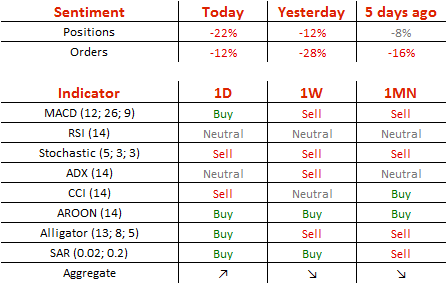
Traders' Sentiment
SWFX traders are bearish on the pair, as 61% of open positions are short, and 56% of set up orders are to sell.
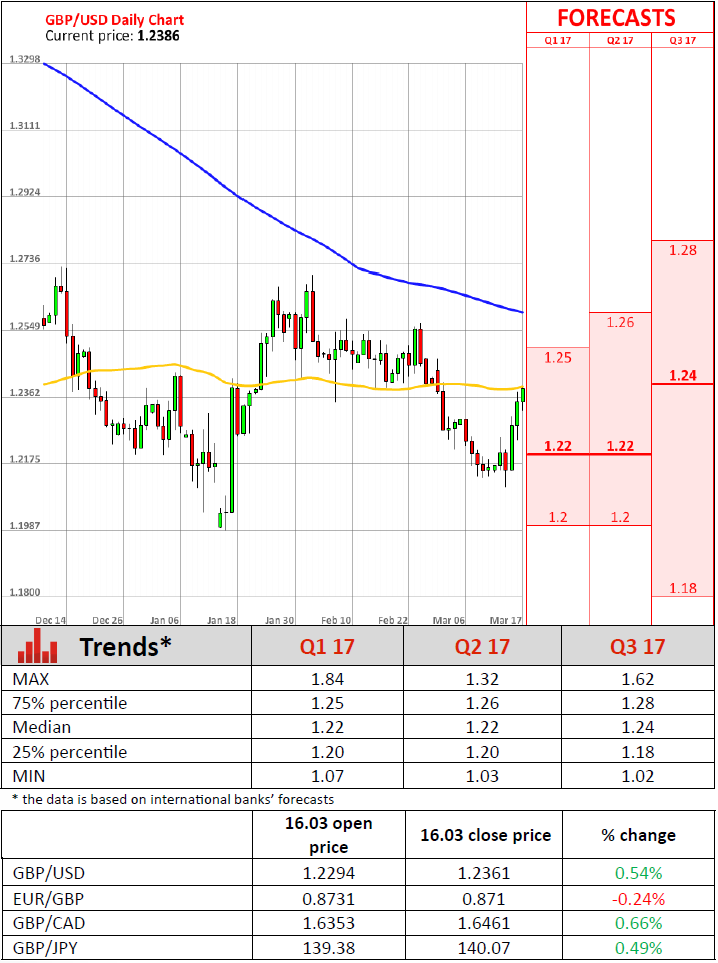
GBP/USD Stable Above 1.23
'The rally could stall here this week but if GBP/USD breaks above 1.2400 on Friday, we could see an extension to 1.25.' – Kathy Lien, BK Asset Management (based on PoundSterlingLive)
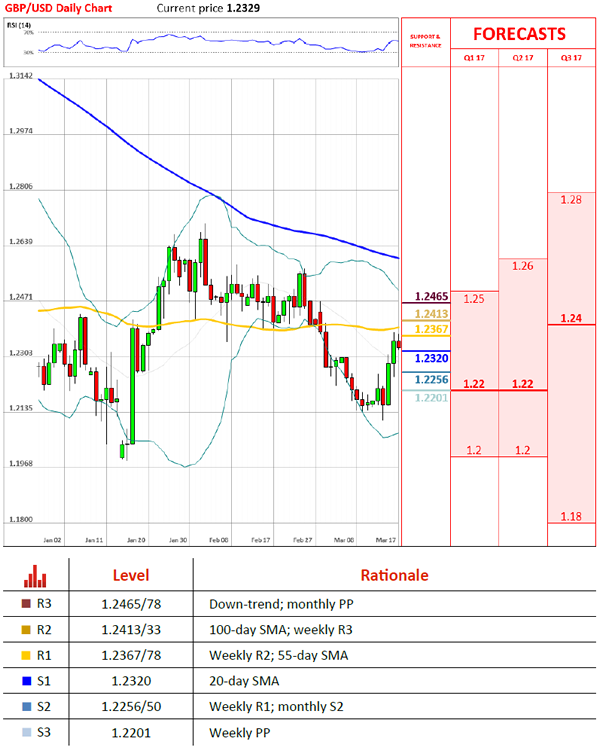
Pair's Outlook
The British Pound was able to post more gains against the US Dollar on Thursday, ultimately closing at a fresh two-week high of 1.2363. The Cable's volatility was limited by the resistance around 1.2370, formed by the weekly R2 and the 55-day SMA. This tough area is likely to prevent the Sterling from appreciating again today, being a minor setback on the pair's path towards retesting the down-trend around 1.2450. Nevertheless, a bearish development is anticipated today, but with the exchange rate retaining position above the 1.23 mark. Technical studies are now able to confirm the possibility of the negative for the Pound outcome.
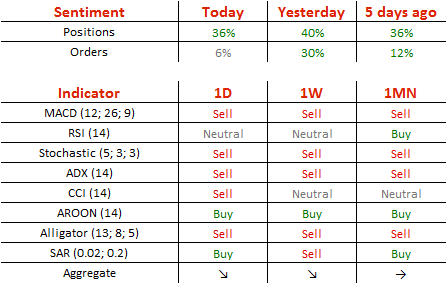
Traders' Sentiment
Market sentiment remains strongly bullish, namely at 68%, but the number of purchase orders declined from 65 to 53% over the day.
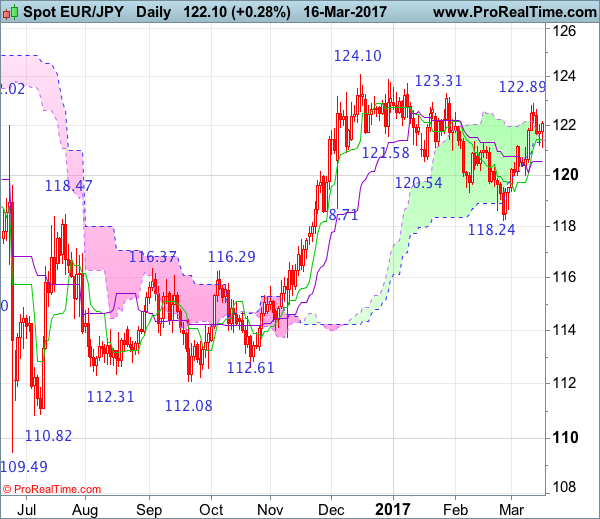
EUR/JPY Candlesticks and Ichimoku Analysis
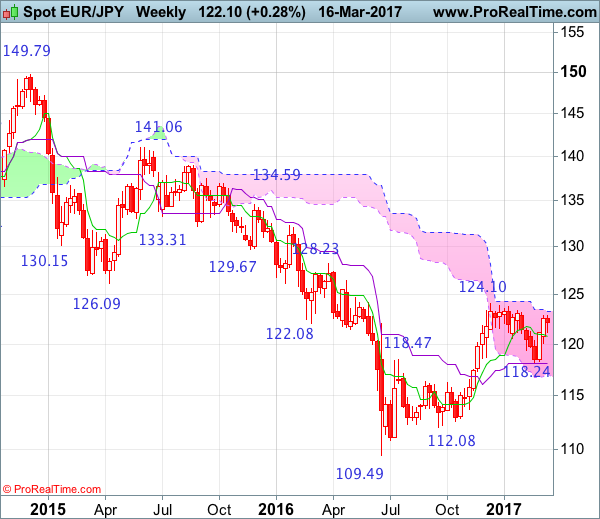
Weekly
- Last Candlesticks pattern: Hammer
- Time of formation: 19 Sep 2016
- Trend bias: Down
Daily
- Last Candlesticks pattern: Hammer
- Time of formation: 9 Nov 2016
- Trend bias: Near term up
EUR/JPY – 122.09
Although the single currency slipped to 121.13 yesterday, as euro found renewed buying interest there and has rebounded, suggesting the pullback from 122.89 has possibly ended there and consolidation with upside bias is seen for gain towards this level, however, break there is needed to signal the rise from 118.24 low has resumed and extend further gain to resistance at 123.31. Looking ahead, only a daily close above resistance at 123.31 would signal the entire fall from 124.10 top has ended at 118.24 back in Feb and bring further subsequent rise towards this level which is likely to hold on first testing.
On the downside, whilst initial pullback to 121.70 cannot be ruled out, reckon the Tenkan-Sen (now at 121.46) would limit downside and bring another upmove later. A drop below said support at 121.13 would abort and suggest top is possibly formed at 122.89, bring further weakness to 120.65-70, then towards support at 120.02, only a daily close below the latter level would provide confirmation, bring further fall to 119.50-60 and possibly 119.00 but still reckon 118.80 would limit downside and price should stay well above said support at 118.24, bring another rebound later.
Recommendation: Buy at 121.50 for 123.50 with stop below 120.50.
On the weekly chart, the single currency has maintained a firm undertone after last week’s rise to 122.89, suggesting bullishness remains for the rebound from 118.24 is still in progress and may extend gain to indicated key resistance at 123.31. Looking ahead, only above this level would signal recent rise from 109.49 low has resumed for retracement of early decline to 125.25-30 (50% Fibonacci retracement of 141.06-109.49), having said that, reckon resistance at 126.47 would cap upside and price should falter below resistance at 128.23, bring retreat later.
On the downside, expect pullback to be limited to 121.40-50 and the Tenkan-Sen (now at 120.78) should hold, bring another rise later to aforesaid upside targets. Only below support at 120.02 (last week’s low) would defer and risk weakness to 119.30-35 but a drop below 118.80 is needed to suggest the rebound from 118.24 has ended, bring retest of this level, a break there would signal the retreat from 124.10 top is still in progress and near term downside bias remains for this move to bring retracement of recent upmove, hence weakness towards the Kijun-Sen (now at 118.09), however, a weekly close below there is needed to signal the rise from 109.49 has ended, bring further decline to 117.30-35 but previous resistance at 116.29 should contain downside due to near term oversold condition, bring rebound later.
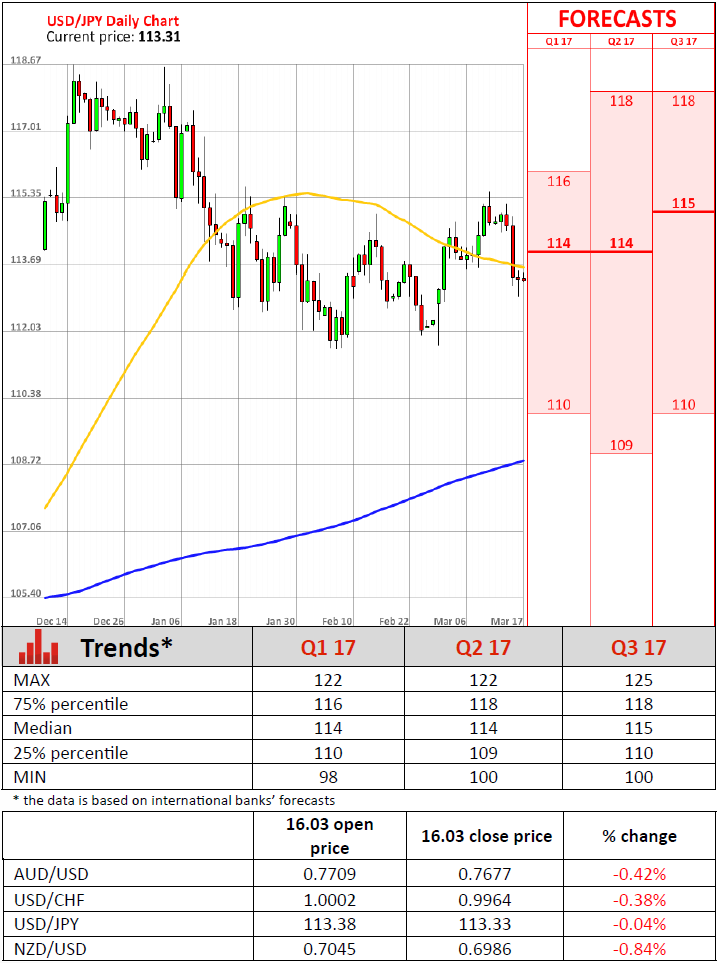
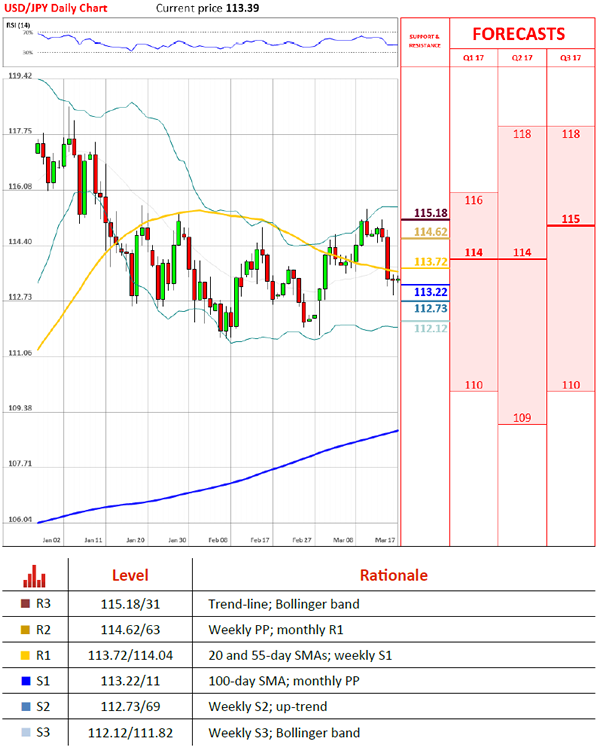
USD/JPY Stuck Between 113.15 And 113.75
'Overall, I think the dollar will continue to be under some pressure for a period of time in which the market has to digest what the Fed is saying.' – Ron Waliczek, INTL FC Stone (based on Business Recorder)
Pair's Outlook
The US Dollar managed to avoid more weakness, remaining relatively unchanged against the Japanese Yen yesterday. The two immediate support clusters were strong enough to limit the losses on Thursday, but at least one of them is expected to give in in the near future. As a result, the USD/JPY pair is to drop under 113.00, leaving the ascending channel's support line to trigger a U-turn. Moreover, a rebound from this up-trend would reconfirm the channel pattern and provide sufficient bullish momentum to climb back to 115.00 and eventually breach that psychological resistance.
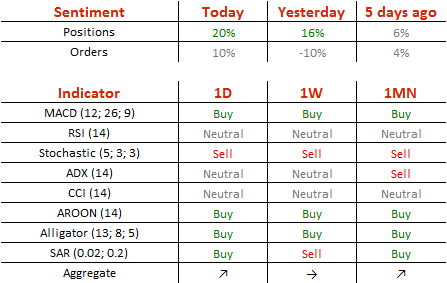
Traders' Sentiment
There are 60% of all open positions being long today, compared to 58% on Thursday. At the same time, the portion of orders to acquire the US Dollar added 10% points. The orders now take up 55% of the market.
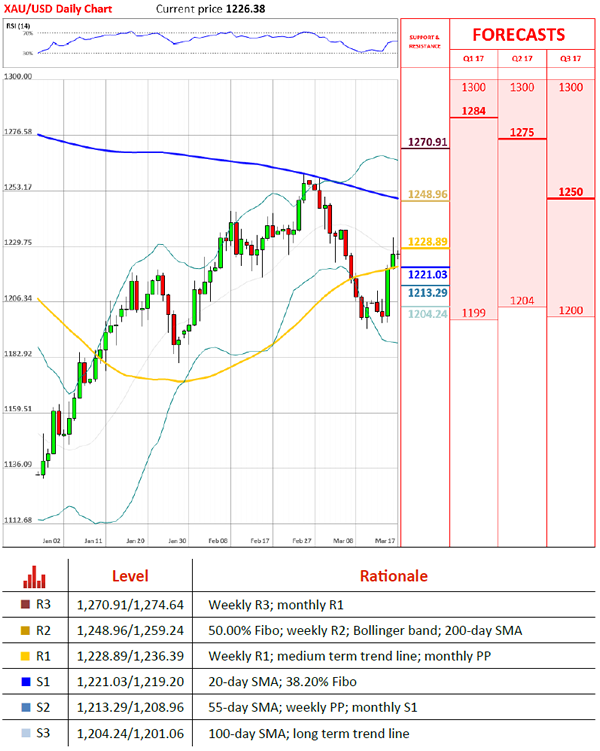
Gold Remains Near 1,225 Level On Friday
'What's happening now is just an inverse trade against the dollar.' – Jiang Shu, Shandong Gold Group (based on Reuters)
Pair's Outlook
On Friday morning the yellow metal's price remained rather unchanged, as the bullion fluctuated just above the 1,225 mark. Previously, during Thursday's trading session the bullion extended the gains, which it scored on the Federal Reserve's rate hike. However, at the 1,233.59 mark the bullion encountered the resistance of a medium term descending channel, which proved strong enough to cause a minor decline in the commodity price. It is most likely that the bullion will make another attempt to break higher, as on Friday morning the decline has stopped, and the yellow metal has begun to approach the weekly R1, which is located at the 1,228.89 level.
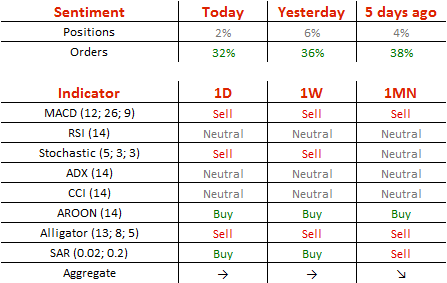
Traders' Sentiment
SWFX traders are almost neutral, as 51% of open positions are long. Meanwhile, 66% of trader set up orders are to buy.
Spot Gold – Hourly Cloud Top Should Contain Dips Before Bulls Resume
Spot Gold maintains positive near-term tone and consolidating under $1233 (top of two-day post-Fed bullish acceleration from $1197).
Failure to clearly break above daily Kijun-sen at $1229 (barrier was cracked but no close above) signals consolidation, before bulls resume.
Bullishly aligned daily studies are also supportive, with thickening daily cloud that contained $1263/$1195 pullback, continuing to underpin.
Close above Kijun-sen barrier will be bullish signal for extension towards $1237 (Fibo 61.8% of $1263/$1195), with extended downticks expected to find solid support at $1221 (hourly cloud top / broken Fibo 38.2% of $1263/$1195).
Alternatively, extension below the latter and violation of $1213 (daily cloud top / Tenkan-sen) would generate stronger bearish signal.
Res: 1229, 1233, 1237, 1244
Sup: 1224, 1221, 1215, 1213
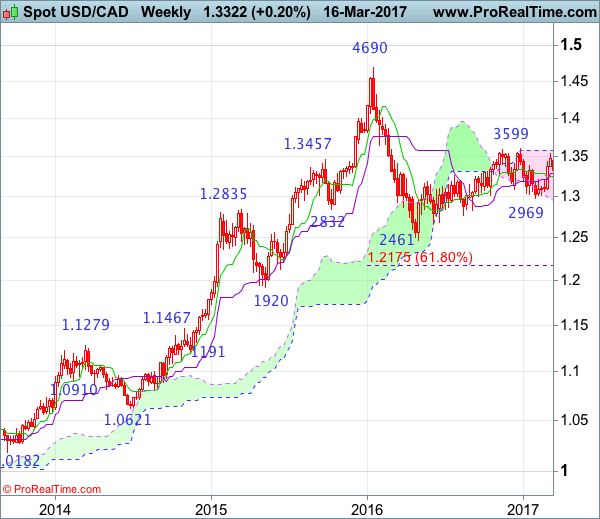
USD/CAD Candlesticks and Ichimoku Analysis
Weekly
- Last Candlesticks pattern: Bullish engulfing
- Time of formation: 02 May 2016
- Trend bias: Up
Daily
- Last Candlesticks pattern: Hammer
- Time of formation: 19 Oct 2016
- Trend bias: Up
USD/CAD – 1.3333
Although the greenback has retreated quite sharply this week and further consolidation below recent high of 1.3599 would be seen and initial downside risk remains for test of the Kijun-Sen (now at 1.3272), reckon downside would be limited to 1.3250 and bring another rebound later, above the Tenkan-Sen (now at 1.3406) would bring rebound to 1.3495-00 but break there is needed to signal the retreat from 1.3535 has ended, bring retest of this level. looking ahead, only a break of this level would retain bullishness and extend early erratic upmove from 1.2461 low to 1.3599, then 1.3660-70 but still reckon upside would be limited to 1.3700 and risk from there is seen for a retreat later.
On the downside, whilst initial fall to 1.3270-75 cannot be ruled out, reckon 1.23240-50 would limit downside and bring another rebound later. Only below previous resistance at 1.3210 would abort and signal top has indeed been formed at 1.3535, bring further fall to 1.3160-65 and possibly towards 1.3100 but price should stay well above support at 1.3056, bring rebound later. Only a daily close below this level would revive bearishness and signal the rebound from 1.2969 has indeed ended, bring further fall to 1.3000 first but said support at 1.2969 should remain intact.
Recommendation: Buy at 1.3250 for 1.3450 with stop below 1.3150.
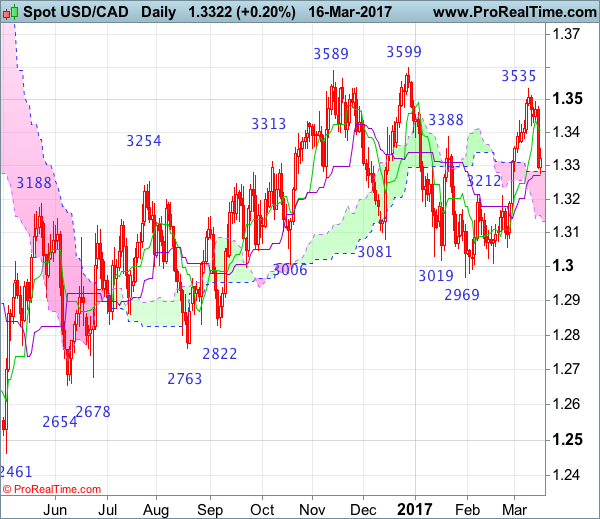
On the weekly chart, despite last week’s rise to 1.3535, this week’s retreat looks set to form a black candlestick and consolidation below resistance at 1.3535 would be seen and pullback to the Kijun-Sen (now at 1.3284) cannot be ruled out, however, reckon the Tenkan-Sen (now at 1.3252) would limit downside and bring another rebound, above 1.3400 would bring rebound to this week’s high at 1.3495 but a weekly close above there is needed to signal retreat from 1.3535 has ended, bring retest of 1.3535, above there would extend recent rise from 1.2969 to indicated resistance at 1.3599, however, a break of this resistance is needed to retain bullishness and signal upmove from 1.2461 (2016 low) has resumed for headway to 1.3700 and later towards 1.3835-40 (61.8% Fibonacci retracement of 1.4690-1.2461) which is likely to cap upside.
On the downside, although pullback to 1.3280-85 cannot be ruled out, reckon downside would be limited to the Tenkan-Sen (now at 1.3252)and bring another rise later. A drop below previous resistance at 1.3210 would suggest a temporary top is formed instead, risk weakness to 1.3150-60, break there would add credence to this view and signal the rebound from 1.2969 has ended, bring further fall to towards 1.3083, however, indicated support at 1.3056 support should hold.