
Sample Category Title
EUR/GBP Elliott Wave Analysis
Although the single currency fell to as low as 0.8403 (just missed our downside target at 0.8400), lack of follow through selling and the subsequent rebound suggest the fall from 0.8857 has ended at 0.8403, hence consolidation above this level is seen with mild upside bias for gain to 0.8630 (50% Fibonacci retracement of 0.8857-0.8403) but a daily close above resistance at 0.8646 is needed to add credence to this view
EUR/GBP – 0.8581
EUR/GBP – The major (A)(B)(C)-(X)-(A)(B)(C) correction from 0.9805 is unfolding and 2nd (A) has possibly ended at 0.6936.
Although the single currency fell to as low as 0.8403 (just missed our downside target at 0.8400), lack of follow through selling and the subsequent rebound suggest the fall from 0.8857 has ended at 0.8403, hence consolidation above this level is seen with mild upside bias for gain to 0.8630 (50% Fibonacci retracement of 0.8857-0.8403) but a daily close above resistance at 0.8646 is needed to add credence to this view and encourage for further gain to 0.8680-85 (61.8% Fibonacci retracement). Having said that, as broad outlook remains consolidative, reckon upside would be limited to 0.8750-60 and price should falter well below said resistance at 0.8857.
Our latest preferred count is that the wave V of a 5-wave series from 0.5682 ended at 0.9805 earlier and major from there has possibly ended at 0.8067 as A-B-C-X-A-B-C. We are keeping our view that the entire correction from 0.9805 has possibly ended at 0.7756 and as labeled as the attached daily chart and impulsive move from 0.9084 has ended at 0.7756 as a 5-waver which marked either the (C) wave or the A leg of (C), a daily close above resistance at 0.8831 would suggest (C) leg has ended and headway towards 0.9084.
On the downside, whilst pullback to 0.8510-15 cannot be ruled out, reckon 0.8495 (previous resistance) should hold and bring another rebound later. Below 0.8422 support would abort and signal the rebound from 0.8403 has ended, bring another test of this level, once this support is penetrated, this would signal the fall from 0.8857 is still in progress and may extend weakness to 0.8350, a sustained breach below there would suggest the rebound from 0.8304 has ended at 0.8857 (tentatively wave b top), then further fall towards said support at 0.8304 which is likely to hold on first testing.
Recommendation: Buy at 0.8515 for 0.8680 with stop below 0.8415.

Euro's long term uptrend started in Feb 1981 at 0.5039 and is unfolding as a (A)-(B)-(C) move with (A): 0.8433 (Feb 1993), (B): 0.5682 (May 2000) and impulsive wave (C) should have ended at 0.9805 with wave III ended at 0.7254 (May 2003), triangle wave IV at 0.6536 (23 Jan 2007) and wave V as well as wave (C) has ended at 0.9805.
We are keeping an alternate count that only wave III ended at 0.9805 and the correction from there is the wave IV and may extend weakness to 0.7700, however, it is necessary to see a daily close above resistance at 0.9143 would change this to be the preferred count.

USD/CAD Elliott Wave Analysis
USD/CAD – 1.3312
USD/CAD – Wave v ended at 0.9407 and a-b-c correction may extend gain to 1.4700
Although the greenback retreated from 1.3210, as the pair found decent demand at 1.3056 late last week and has rallied from there, suggesting low has been formed at 1.2969 back in Jan, hence consolidation with mild upside bias is seen for further gain to resistance at 1.3388, however, break there is needed to signal the fall from 1.3599 has ended and extend further subsequent rise to 1.3450-60 but price should falter below 1.3500-10, bring retreat later.
We are keeping our view that the wave b from 1.0657 (a leg top) has possibly ended at 0.9633 with (a): 0.9800, wave (b): 1.0447 and wave c at 0.9633, the subsequent rise from there is now treated as wave c exceeded indicated upside target at 1.3770-80 and 1.4000 and wave (3) has possibly ended at 1.4690 and wave (4) correction has commenced for retracement back to 1.2832 support, then 1.2410-20.
On the daily chart, our latest preferred count remains that the A of (B) rally from 0.9059 low (7 Nov 2007) unfolded into an impulsive wave with i: 0.9059-1.0380, ii ended at 0.9819, iii at 1.3019 followed by triangle wave iv at 1.2026 , then wave v formed a top at 1.3066 and also ended the wave A. The wave B is unfolding as an double three a-b-c-x-a-b-c and is sub-divided as a: 1.2192, b: 1.2716 and wave c at 1.0784, followed by wave x at 1.1725, another set of a-b-c unfolded with 2nd a at 0.9931, 2nd b at 1.0674. the 2nd c has possibly ended at 0.9407, therefore, consolidation with upside bias is seen for major correction, indicated target at 1.3900 had been met and gain to 1.4700 would follow.
On the downside, whilst pullback to 1.3250 cannot be ruled out, reckon previous resistance at 1.3210-12 (now support) would limit downside and bring another rise later to aforesaid upside targets. Only a break of said support at 1.3056 would abort and signal top is formed, bring test of support at 1.3009, below there would revive bearishness for retest of 1.2969. Looking ahead, a break of this level is needed to signal the fall from 1.3599 top has resumed and bring further fall to 1.2950, then 1.2890-00 but reckon downside would be limited to 1.2822 support and the pair should stay above another previous support at 1.2763.
Recommendation: Buy at 1.3210 for 1.3400 with stop below 1.3110.

Longer term - The selloff from 1.6194 (21 Jan 2002) to 0.9059 (07 Nov 2007) is viewed as (A) wave which is a 5-waver as labeled on the monthly chart as below, the subsequently rally is labeled as (B) with impulsive A leg of (B) ended at 1.3066, wave B of (B) is unfolding which has either ended at 0.9407 or would extend one more fall but downside should be limited to 0.9200 and 0.9000 should hold.

AUD Drops To 0.7620 As US Fed Rate Expectations Soar
News and Events:
AUD ready for debasement
The Australian dollar has been the best performing currency among the G10 complex since the beginning of the year. The Aussie rose more 6% against the greenback and recovered from around $0.72 to around $0.77 at the beginning of February. This sustainable appreciation of the Aussie is mostly the results of two factors: Firstly, the broad dollar depreciation was especially marked against high-yielding currencies such as the Aussie and the Kiwi but also against safe haven currencies such as the Japanese yen and the Swiss franc. Secondly, the sharp increase in iron prices - together with the broad-based recovery in commodity prices - has helped boost expectations for the country’s growth outlook. Indeed, the Aussie is highly dependent on exports (around 20% of GDP) and its dependence on China’s health is also very high as roughly 34% (12-month average) of its exports go to the “Middle Kingdom”.
Despite this encouraging note, dark clouds are gathering on the horizon as the two factors mentioned above are losing momentum. Indeed, China’s iron ore port inventory rose dramatically this year and reached almost 130 million tons as of February 24th. On the other hand, over the same period, steel production continued to inch lower, suggesting that there is a strong imbalance between demand and supply. Finally, on a trade-weighted basis the Aussie is back to levels last seen in summer 2015, which makes the RBA very unhappy with the situation. Indeed, the central bank has reiterated many times that the Aussie is overvalued and may be ready to take some action to adjust this situation. Taking into account the two factors exposed above, we believe that the Aussie rally has come to an end and that a correction is looming. We do not exclude the RBA to cut rates next week but in our opinion it appears very unlikely as US-AUD rates continue to converge. We anticipate AUD/USD to return quickly toward $0.75 and do not rule out further weakness for the pair should the dollar rally continue with $0.74 as the next target.
Overvalued ILS
Expectation for a 25bp Fed rate hike in March has surged to approximately 80% probability from 30% only two weeks ago. US short-end yields have risen 5-10bp, giving USD further support (US 2yr yields now at 1.28%). Global stock markets continue to rally with the Dow ripping through the 21k level. The catalyst remains shaky as traders are pointing to the conciliatory President Trump joint session of congress address as providing markets time to focus on solid US economic data and hawkish Fed rhetoric. Incoming data from the manufacturing sectors indicates steady improvement as ISM manufacturing index increased to 57.5 against 56.2 expectations. EM currencies have been surprisingly resilient to the USD rally given the importance of US rates as primary driver of EM FX. Given the rise in rates we are suspect that the Israeli Shekel (ILS) strength against the USD is overdone. The Bank of Israel has been in a defensive position fighting to weaken the ILS. The central bank has purchased $50 million in January totaling around $2.6bn in foreign currencies. While on Monday, the BoI held it benchmark interest rates at 0.1% focusing on the weak inflation outlook rather than on solid growth. The Israeli economy accelerated above expectations to 4% in 2016, yet data suggests a deceleration in 2017 (especially factoring the uncompetitive ILS). Current central bank projections indicate a 15bp hike in Q4 and another in 2018. A widening US-ILS yields spread suggests that USDILS should trade higher near-term.
Bank of Canada keeps rates unchanged
Yesterday the USDCAD surged above 1.33 after the Bank of Canada held rates its unchanged at 0.5%.
We believe that the BoC is still in wait and see mode since Donald Trump’s ascension to the oval office. The Fed is now expected to increase rates by March and there is clear monetary policy divergence between the US and Canada for the time being.
Trump’s policies are likely to weigh on the Canadian economy and the key issue remains around the NAFTA (North American Free Trade Agreement), which is likely to be renegotiated. The global outlook has not changed much and what the new US president will deliver is of very high interest for Canadian policymakers.
In any case, one cannot blame Trump for subdued economic conditions in Canada, whose central bank revealed in a short statement that its forecasts are in line with recent data.
It is nonetheless clear that fundamentals are mixed. Canadian wage growth has hardly picked up. However, it is worth noting that inflation spiked in January to its highest level in two years but we believe that this is a temporary effect due to higher commodity and oil prices.
Today's Key Issues (time in GMT):
- 4Q F GDP QoQ, exp 0,70%, last 0,70% EUR / 08:00
- 4Q F GDP YoY, exp 3,00%, last 3,00% EUR / 08:00
- Feb Unemployment MoM Net ('000s), exp 4,6, last 57,3 EUR / 08:00
- Jan Retail Sales Real YoY, last -3,50%, rev -4,10% CHF / 08:15
- 4Q Current Account Balance, last 56.7b, rev 59.3b SEK / 08:30
- Feb Reserve Fund, last $16.2b RUB / 08:50
- Feb Wellbeing Fund, last $72.5b RUB / 08:50
- Jan P Unemployment Rate, exp 12,00%, last 12,00%, rev 11,90% EUR / 09:00
- Feb Markit/CIPS UK Construction PMI, exp 52, last 52,2 GBP / 09:30
- Jan PPI MoM, exp 0,70%, last 0,70% EUR / 10:00
- Jan PPI YoY, exp 3,20%, last 1,60% EUR / 10:00
- Jan Unemployment Rate, exp 9,60%, last 9,60% EUR / 10:00
- Feb CPI Estimate YoY, exp 2,00%, last 1,80% EUR / 10:00
- Feb A CPI Core YoY, exp 0,90%, last 0,90% EUR / 10:00
- Feb 28 FGV CPI IPC-S, exp 0,32%, last 0,40% BRL / 11:00
- Jan Electricity Consumption YoY, last -1,00% ZAR / 11:00
- Jan Electricity Production YoY, last 0,80% ZAR / 11:00
- Feb 24 Foreigners Net Bond Invest, last $166m TRY / 11:30
- Feb 24 Foreigners Net Stock Invest, last -$50m TRY / 11:30
- COPOM Minutes BRL / 11:30
- Feb 24 Gold and Forex Reserve, last 393.5b RUB / 13:00
- Feb Markit Brazil PMI Manufacturing, last 44 BRL / 13:00
- Dec GDP MoM, exp 0,30%, last 0,40% CAD / 13:30
- Dec GDP YoY, exp 1,70%, last 1,60% CAD / 13:30
- 4Q Quarterly GDP Annualized, exp 2,00%, last 3,50% CAD / 13:30
- Feb 25 Initial Jobless Claims, exp 245k, last 244k USD / 13:30
- Feb 18 Continuing Claims, exp 2060k, last 2060k USD / 13:30
- Feb 26 Bloomberg Consumer Comfort, last 48 USD / 14:45
- Feb Foreign Reserves, exp 459, last 457,8 DKK / 15:00
- Feb Change in Currency Reserves, last 1.8b DKK / 15:00
- Currency Flows Weekly BRL / 15:30
- Bank of Canada Deputy Governor Timothy Lane Speaks in Montreal CAD / 17:45
- Feb Imports Total, exp $11050m, last $12187m BRL / 18:00
- Feb Exports Total, exp $14540m, last $14911m BRL / 18:00
- Feb Trade Balance Monthly, exp $3325m, last $2725m BRL / 18:00
- ECB's Lautenschlaeger Speaks in London EUR / 19:30
- Feb ANZ Job Advertisements MoM, last -0,20% NZD / 21:00
- 4Q Value of All Buildings SA QoQ, exp 1,50%, last 1,40% NZD / 21:45
- Feb AiG Perf of Services Index, last 54,5 AUD / 22:30
- Feb Commodity Price Index YoY, last -9,10% BRL / 23:00
- Feb Commodity Price Index MoM, last -1,13% BRL / 23:00
- Jan Formal Job Creation Total, exp -35575, last -462366 BRL / 23:00
The Risk Today:
EUR/USD remains trapped in a sideways range below 1.0600. Hourly resistance is given at 1.0679 (16/02/2017 high) while hourly support can be found at 1.0521 (15/02/2017 low). The technical structure suggests deeper weakening. In the longer term, the death cross late October indicated a further bearish bias. The pair has broken key support given at 1.0458 (16/03/2015 low). Key resistance holds at 1.1714 (24/08/2015 high). Expected to head towards parity.
GBP/USD has broken trend support area defined by 1.2426 (17/0272017 low). Hourly resistance is given at 1.2582 (09/02/2017 high) while support area is given around 1.2400. Key support is given at 1.2347 (07/02/2017 low). The pair is still lying below strong resistance given at 1.2771 (05/10/2016 high). The long-term technical pattern is even more negative since the Brexit vote has paved the way for further decline. Long-term support given at 1.0520 (01/03/85) represents a decent target. Long-term resistance is given at 1.5018 (24/06/2015) and would indicate a long-term reversal in the negative trend. Yet, it is very unlikely at the moment.
USD/JPY is showing limited short -terms buying interest after reversing off base lows. Key resistance is given at 115.62 (19/01/2016 high). The technical structure suggests further consolidation below 115.00. We favor a long-term bearish bias. Support is now given at 96.57 (10/08/2013 low). A gradual rise towards the major resistance at 135.15 (01/02/2002 high) seems absolutely unlikely. Expected to decline further support at 93.79 (13/06/2013 low).
USD/CHF continues to improves after testing 1.0021 support. Hourly resistance is implied by upper bound of the uptrend channel. Key resistance is given at a distance at 1.0344 (15/12/2016 high). Expected to see further strengthening. In the long-term, the pair is still trading in range since 2011 despite some turmoil when the SNB unpegged the CHF. Key support can be found 0.8986 (30/01/2015 low). The technical structure favours nonetheless a long term bullish bias since the unpeg in January 2015.
| EURUSD | GBPUSD | USDCHF | USDJPY |
| 1.1300 | 1.3445 | 1.1731 | 121.69 |
| 1.0954 | 1.3121 | 1.0652 | 118.66 |
| 1.0874 | 1.2771 | 1.0344 | 115.62 |
| 1.0529 | 1.2266 | 1.0110 | 114.23 |
| 1.0454 | 1.2254 | 0.9967 | 111.36 |
| 1.0341 | 1.1986 | 0.9862 | 106.04 |
| 1.0000 | 1.1841 | 0.9550 | 101.20 |
Daily Technical Analysis
EURUSD
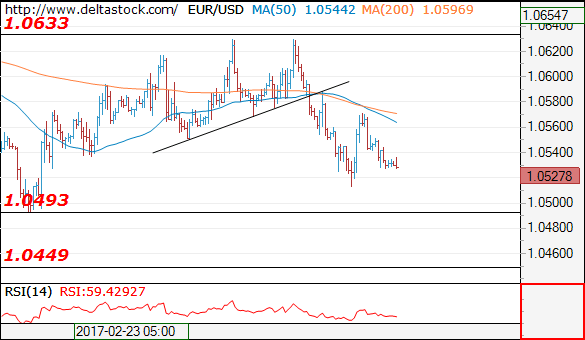
The EURUSD attempted to push lower yesterday bottomed at 1.0514 but closed a little bit higher at 1.0546. As you can see on my H4 chart below, price is moving inside a bearish channel suggests a bearish phase. The bias is neutral in nearest term probably with a little bearish bias testing 1.0500 – 1.0450 support area and the lower line of the bearish channel which is a good place to buy with a tight stop loss. Immediate resistance is seen around 1.0580. A clear break above that area could trigger further bullish pressure testing 1.0630 resistance area. Overall I remain neutral.
GBPUSD
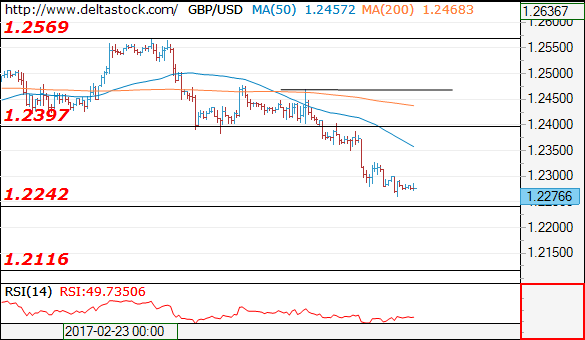
The GBPUSD continued its bearish momentum yesterday broke below 1.2340 key support and hit 1.2260 earlier today in Asian session. The bias is bearish in nearest term testing 1.2250 – 1.2200 support area. Immediate resistance is seen around 1.2340. A clear break back above that area could lead price to neutral zone in nearest term as direction would become unclear. Overall I remain neutral.
USDJPY
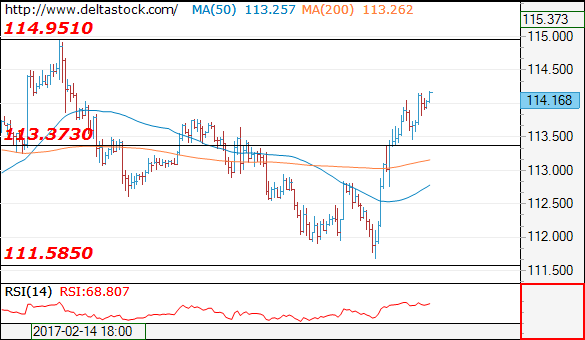
The USDJPY had a bullish momentum yesterday topped at 114.04 and hit 114.15 earlier today in Asian session. The bias remains bullish in nearest term testing 115.00 – 115.60 area which is a good place to sell with a tight stop loss. Immediate support is seen around 113.45. A clear break below that area could lead price to neutral zone in nearest term testing 113.00 or lower. As long as stay below 115.60 I still prefer a bearish scenario.
USDCHF
The USDCHF attempted to push higher yesterday topped at 1.0129 but closed a little bit lower at 1.0088. The bias is neutral in nearest term probably with a little bullish bias testing 1.0140. A clear break above that area would expose 1.0200 region. Immediate support is seen around 1.0065 followed by 1.0030/00 which is a good place to buy with a tight stop loss. Overall I remain neutral.
AUDUSD Is Holding Between Daily Tenkan-Sen And Kijun-Sen But Risk Of Reversal Is Growing
The Aussie is in red today and holding below 20SMA, pressured by Australian trade data miss earlier today.
Downside pressure is increasing after repeated rejections above 0.7700 barrier and subsequent steady descend that took out some important supports.
Near-term studies are bearish and price action is holding within daily Tenkan-sen-sen and Kijun-sen lines (at 0.7686 and 0.7624 respectively) which mark pivotal points.
With near-term focus turned to the downside, immediate risk lies on probe below daily Kijun-sen support that would expose another pivot at 0.7600 (former congestion low / Fibo 23.6% of 0.7158/0.7739), loss of which would generate stronger reversal signal.
The notion is supported by reversal of weekly slow stochastic from overbought zone and triple weekly Doji that gives strong signal of stall of the rally from 0.7159.
Conversely, return and close above daily Tenkan-sen is needed to sideline immediate downside risk.
Res: 0.7686, 0.7705, 0.7739, 0.7758
Sup: 0.7624, 0.7600, 0.7575, 0.7517

USDJPY – Strong Recovery After Rejection Below Daily Cloud Extends
Strong recovery after significant downside rejection below daily cloud turns near-term focus higher.
The rally extends into third day, as Tuesday's long-tailed candle and yesterday's long bullish candle strongly underpin near-term recovery that is now eyeing top of narrowing daily cloud (currently at 114.80).
In addition, daily chart double-bottom, formed at 111.60/67 zone, would also prop bulls for attack at 114.80/94 pivots (daily cloud top/15 Feb spike high), as twist of daily cloud next week is also seen as supportive factor.
Broken bear-trendline off 118.65 offers solid support at 113.60, together with rising cloud base/broken daily Kijun-sen (currently at 113.47) which are expected to ideally contain corrective dips.
Res: 114.30, 114.80, 114.94, 115.36
Sup: 113.60, 113.47, 112.98, 112.75
Cable Broke Below Daily Cloud And Hit Fibo61.8% Support, Further Downside Seen Likely
Cable extends weakness from upside rejection at 1.2568 and broke below daily cloud (spanned between 1.2311/79) to hit strong support at 1.2260 (Fibo 61.8% of 1.1986/1.2704 rally), the lowest level since 19 Jan.
Long bearish candles of past four days maintain strong bearish tone for further weakness.
Close below 1.2260 is needed to signal fresh extension lower and open next target at 1.2155 (Fibo 76.4%), with acceleration towards psychological 1.2000 support, not ruled out.
Twist of daily cloud in two days, ads on negative outlook.
Former strong support, now reverted to resistance, daily 100SMA (currently at 1.2405) is expected to cap extended corrective rallies on oversold slow stochastic on daily chart.
Res: 1.2311. 1.2379. 1.2405. 1.2454
Sup: 1.2260. 1.2200. 1.2155. 1.2100
EURUSD – Bearish Bias Below 55SMA
The Euro maintains bearish bias and probes again below already cracked Fibo 61.8% support at 1.0525, following four consecutive failures to close above 55SMA (currently at 1.0589).
Long upper shadows of daily candles of last Thu/Fri/Mon continue to weigh on the market, along with 10/55SMA bear cross. Eventual close below 1.0525 is needed to confirm bearish stance for attempts through fresh low of 22 Feb at 1.0492 and open way towards 1.0454 (Fibo 76.4% of 1.0339/1.0827 rally).
Yesterday's daily cloud twist supports scenario, as cloud is widening (currently spanned between 1.0605 and 1.0616).
Falling daily Tenkan-sen offer initial resistance at 1.0562, with corrective upticks expected to ideally stay under the cloud.
Recent spike highs at 1.0630 zone that were left on strong upside rejections, mark another pivotal barrier, break above which would activate alternative scenario and neutralize immediate downside threats.
Daily Kijun-sen (currently at 1.0660) and lower tops at 1.0675 mark upper breakpoints.
Res: 1.0562, 1.0589, 1.0616, 1.0630
Sup: 1.0512, 1.0492, 1.0454, 1.0388
Forex Technical Analysis
EUR/USD
Current level - 10527
Yesterday's slide reached a local low at 1.0512 and current rebound should be considered corrective, preceding another leg downwards, to 1.0450. Intraday allow one more upswing before renewal of the downtrend.
| Resistance | Support | ||
| intraday | intraweek | intraday | intraweek |
|
1.0580 |
1.0705 |
1.0512 |
1.0500 |
|
1.0630 |
1.0870 |
1.0450 |
1.0350 |
USD/JPY
Current level - 114.16
The bias remains positive, for a rise towards 114.95, en route to 115.60 area. Crucial support lies at 113.37.
| Resistance | Support | ||
| intraday | intraweek | intraday | intraweek |
|
114.95 |
118.65 |
113.37 |
111.40 |
|
115.60 |
120.00 |
111.60 |
109.80 |
GBP/USD
Current level - 1.2276
The downtrend is intact, ready for a test of 1.2240 support zone. I favor a break through the latter and continuation of the slide towards 1.2120. Initial intraday resistance lies at 1.2325, followed by the crucial 1.2400.
| Resistance | Support | ||
| intraday | intraweek | intraday | intraweek |
|
1.2325 |
1.2570 |
1.2240 |
1.2240 |
|
1.2400 |
1.2705 |
1.2120 |
1.1984 |
USD Extends Gains On Rate Hike Expectations, But No USD Euphoria
Sunrise Market Commentary
- Rates: EMU CPI and Friday’s Yellen speech negative for core bonds
Dovish Fed governor Brainard joined the recent Fed chorus, hinting at a near term rate hike. Ahead of Yellen’s speech tomorrow evening, we expect US Treasuries to remain under downward pressure. The correction lower in the Bund can continue as well, especially if EMU CPI hits the psychological 2%-mark today. - Currencies: USD extends gains on rate hike expectations, but no USD euphoria
Yesterday, USD investors adapted positions to rising chances of a March rate hike. The USD gains were substantial, but not excessive. Both EUR/USD and USD/JPY didn’t break major technical levels. Today, some consolidation might be on the cards as there are no important data in the US. EUR/GBP is nearing a first technical resistance.
The Sunrise Headlines
- US and global equities soared, as data reinforced expectations that a Fed rate hike is imminent. Investors see that as a sign of strengthening economic growth. Asian stocks advance modestly despite a buoyant WS yesterday.
- EU states could regain control over matters ranging from regional development to consumer protection, Jean-Claude Juncker, has suggested, setting out ideas to shore up the bloc after Brexit.
- Fed governor Brainard, a dove, said that the Fed should be prepared to increase its benchmark interest rate “soon” as the job market pushes closer to full employment and inflation moves towards the central bank’s target.
- The kiwi dollar pared some of its losses after RBNZ Governor Wheeler said risks to interest rate moves are equally balanced. NZD/USD trades now around 0.7132.
- UK PM May suffered a defeat on her draft Brexit law after the Lords rebuffed a government plea to leave it intact. It voted in favour of an amendment that protects the right of EU nationals to remain living in the UK after Brexit.
- Brent oil dropped to $56/barrel from $57/barrel after EIA data showed US crude stockpiles rose to a record. Gold spot (1246.90$/ounce) recovered in US trading to snap two days of declines, but slid lower overnight on Fed Brainard.
- Today, the market calendar slows down with only EMU inflation as key economic release ECB Lautenschlaeger speaks after European closure, while France and Spain tap the markets
Currencies: USD Extends Gains On Rate Hike Expectations, But No USD Euphoria
Dollar propelled by March rate hike bets
On Wednesday, the rising probability of a March Fed rate hike propelled the dollar. The US currency (and equities) ignored that US president Trump failed to give details on his economic and fiscal plans. The US Manufacturing ISM was very strong, but at the time of the publication, the dollar had already reached the intraday highs. USD/JPY finished the session at 113.73 (from 112.77). The rise of the dollar against the euro was more modest. EUR/USD closed the day at 1.0547.
Overnight, Fed’s Brainard joined the chorus of Fed speakers advocating a rate hike “soon”. The comments caused a limited further dollar uptick early in Asia. However, FX and interest rate markets have largely discounted a March rate hike. USD/JPY hovers sideways in the 114 area, near the recent highs. EUR/USD stabilizes in the 1.0535 area. Most Asian equities show modest gains (except for mainland China), that fall shy though with WS euphoria yesterday. The more modest risk sentiment might slow further USD gains.
Today, the market expects the February EMU HICP inflation to increase from 1.8% to 2.0% Y/Y. So, the ECB target might be reached. The core is expected stable at a rather low 0.9%. The headline inflation number, together with strong eco data, increases chances that the ECB will prematurely dial back its asset purchases in H2 of 2017. Regarding central bankers, ECB Lautensclaeger, a hawk, will speaks after closure. Yesterday, USD investors adapted positions for a March Fed rate hike. The continuation of the risk rally was also slightly USD positive. The trade-weighted dollar gained about 1% since to the start of the rebound Tuesday. This is a good gain, but shows no USD euphoria. Especially the decline of EUR/USD was moderate. The market was probably still a bit ‘euro short’ due to recent uncertainty on France. Today, we expect some consolidation on yesterday’s rally. (no important US data. 2% EMU inflation in theory could be slightly supportive for the euro). At the same time, the dollar is well supported in a context of rising global yields. Equities remain a wildcard. A correction could cause some modest USD profit taking, but for now there is no clear sign that the reflation trade might change course
Global context. The dollar corrected lower since the start of January, but bottomed early February supported by Trump’s tax promise. Underlying euro weakness due to political uncertainty in the area was a factor too. Over the previous days the focus shifted from US fiscal policy to the Fed talk, preparing markets for a rate hike in the near future. We assume EUR/USD 1.0874 to be a solid resistance and favour a sell EUR/USD on upticks approach. 1.0494 is first intermediate support ahead of the 1.0341 correction low. The downside test of USD/JPY is also rejected. USD/JPY 111.60/111.16 (Range bottom/38% retracement of the 99.02/118.66 rally) remains key support. On the topside 114.96 is a first point of reference. So, USD sentiment is constructive, but for now both EUR/USD and USD/JPY haven’t broken any important technical level yet.
EUR/USD declines as USD rebound, but no important support is broken yet.
EUR/GBP
EUR/GBP nearing first (minor) resistance
Yesterday, the UK manufacturing PMI declined more than expected, but Sterling hardly reacted. Even so, there were tentative signs of underlying sterling softness, as EUR/GBP lost hardly ground despite the EUR/USD decline. Around noon, sterling selling intensified. Uncertainty on the outcome of the Brexit vote in the House of Lords added to sterling caution. Later in the session the Upper House indeed voted for a change in PM May’s Brexit law. The vote probably won’t change the government’s Brexit roadmap in a profound way. Even so, it illustrates that the Brexit process is facing plenty of hurdles. Sterling lost gradually further ground. EUR/GBP finished the day at 0.8579. Cable dropped below the 1.23 level, mostly on USD strength.
Today, the UK construction PMI is expected to decline slightly from 52.2 to 52.00. The report is not so important for markets, but a negative surprise, after yesterday’s miss in the manufacturing measure, might be slightly sterling negative. There will also be headlines on the rejection of the Brexit Bill. Sterling sentiment has softened a bit of late. It was/is difficult for cable to outperform EUR/USD as is often the case with USD strength. Early last week, the euro sell-off pushed EUR/GBP to the 0.84 area, but a sustained break lower didn’t occur. EUR/GBP is currently nearing a first resistance at 0.8592. A break would suggest a further loss of momentum of sterling. Longer term, we have a sterling negative view, as the Brexit will negatively impact the UK economy
EUR/GBP: nearing a first resistance at 0.8592.