Sample Category Title
GBP/USD Daily Outlook
Daily Pivots: (S1) 1.2246; (P) 1.2325; (R1) 1.2371; More...
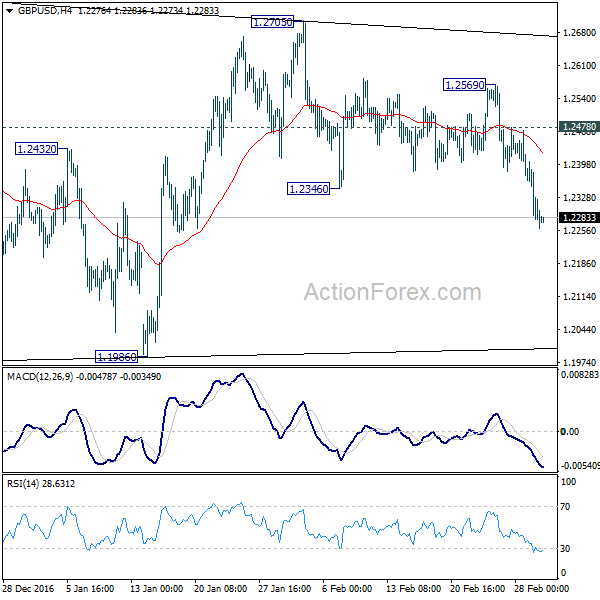
Intraday bias in GBP/USD remains on the downside for 1.1946/86 support zone. The consolidation pattern from 1.1946 has possibly completed at 1.2705 too. Break of 1.1946 will confirm our bearish view and resume the larger down trend. Nonetheless, on the upside, above 1.2478 minor resistance will delay the bearish case and turn bias neutral first.
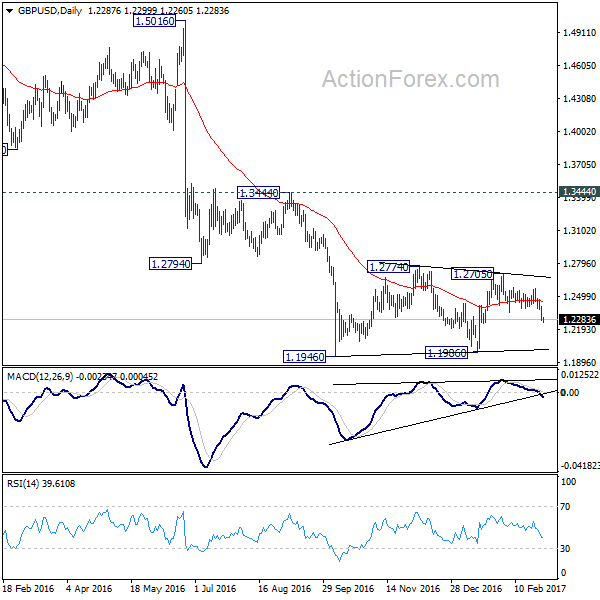
In the bigger picture, fall from 1.7190 is seen as part of the down trend from 2.1161. There is no sign of medium term bottoming yet. Sustained trading below 61.8% projection of 2.1161 to 1.3503 from 1.7190 at 1.2457 will target 100% projection at 0.9532. Overall, break of 1.3444 resistance is needed to confirm medium term bottoming. Otherwise, outlook will remain bearish.
EUR/USD Daily Outlook
Daily Pivots: (S1) 1.0550; (P) 1.0590 (R1) 1.0616; More.....
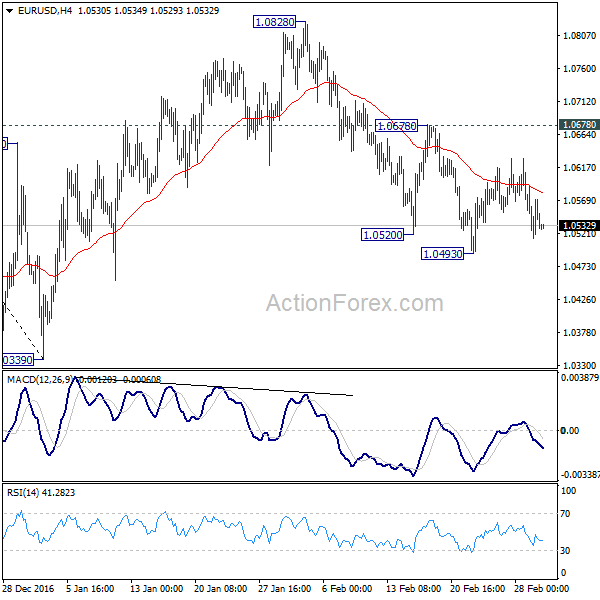
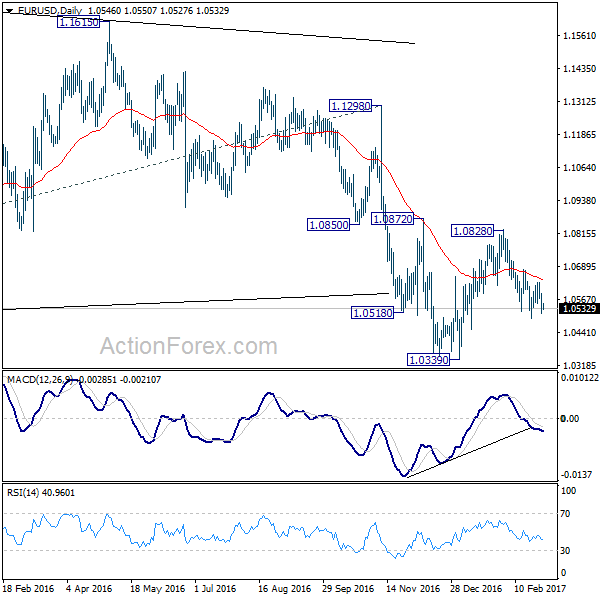
EUR/USD is still bounded in range of 1.0493/0678 and intraday bias remains neutral first. With 1.0678 minor resistance intact, deeper decline is still expected. We're viewing fall from 1.0828 as resuming the larger down trend. Below 1.0493 will target 1.0339 low first. Break will confirm our bearish view and target parity. However, break of 1.0678 will dampen our view and turn focus back to 1.0828 resistance instead.
In the bigger picture, whole down trend from 1.6039 (2008 high) is in progress. Such down trend is expected to extend to 61.8% projection of 1.3993 to 1.0461 from 1.1298 at 0.9115. On the upside, break of 1.1298 resistance is needed to confirm medium term bottoming. Otherwise, outlook will stay bearish in case of rebound.
USD/CHF Daily Outlook
Daily Pivots: (S1) 1.0051; (P) 1.0089; (R1) 1.0127; More.....
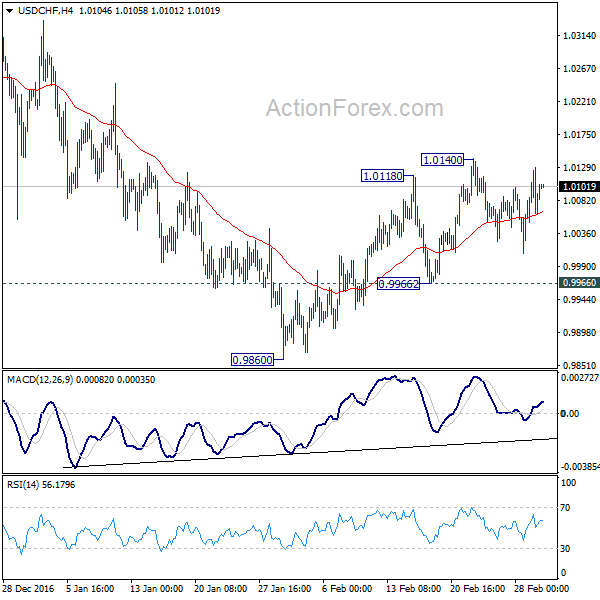
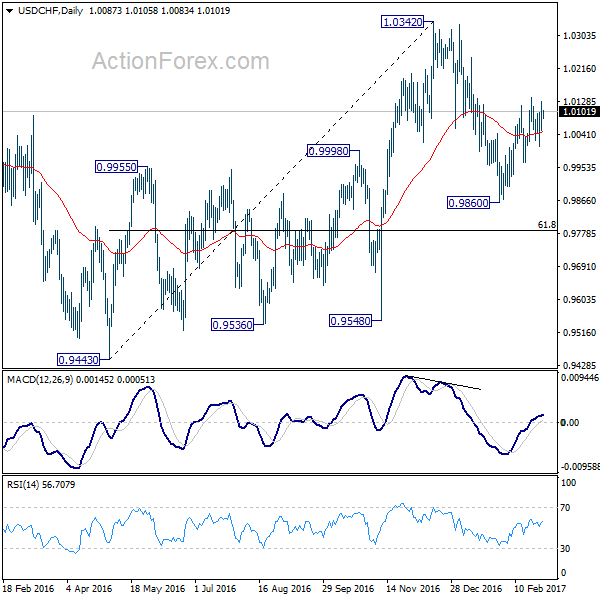
USD/CHF is still bounded in range of 0.9966/1.0140. Intraday bias remains neutral for the moment. With 0.9966 support intact, further rise is expected. Above 1.0140 will turn bias to the upside and target a test on 1.0342 resistance. Based on neutral medium term outlook, we'd be cautious on topping at around 1.0342. Meanwhile, break of 0.9966 will indicate completion of the rebound from 0.9860. And intraday bias will be turned back to the downside for 0.9860.
In the bigger picture, prior rejection from 1.0327 resistance argues that USD/CHF is staying in a medium term sideway pattern. In any case, decisive break of 1.0342 resistance is needed to confirm underlying strength. Otherwise, we'll stay neutral in the pair first. In case of another fall, we'd expect strong support from 0.9443/9548 support zone. Meanwhile firm break of 1.0342 will target 38.2% retracement of 1.8305 to 0.7065 at 1.1359.
USD/JPY Daily Outlook
Daily Pivots: (S1) 112.93; (P) 113.48; (R1) 114.28; More...
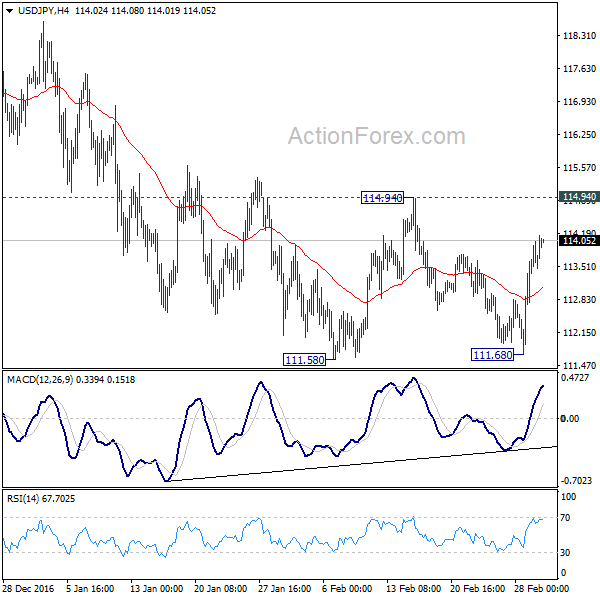
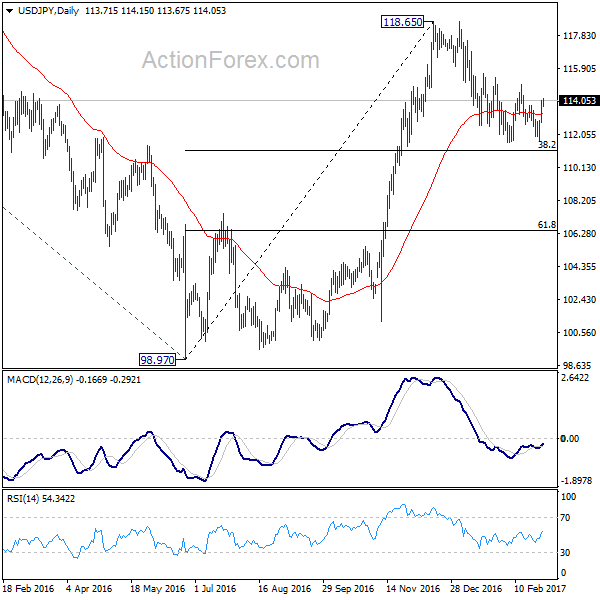
USD/JPY is still staying inside range of 111.58/114.94 and intraday bias remains neutral. Price actions from 118.65 are viewed as a corrective move. Firm break of 114.94 resistance will indicate that it's completed, on a double bottom pattern (111.58, 111.68). In such case, intraday bias will be turned to the upside for retesting 118.65. Also, the whole rise from 98.97 is likely resuming. On the downside, in case of another fall, we'd still expect strong support from 38.2% retracement of 98.97 to 118.65 at 111.13 to contain downside and bring rebound.
In the bigger picture, price actions from 125.85 high are seen as a corrective pattern. The impulsive structure of the rise from 98.97 suggests that the correction is completed and larger up trend is resuming. Decisive break of 125.85 will confirm and target 61.8% projection of 75.56 to 125.85 from 98.97 at 130.04 and then 135.20 long term resistance. Rejection from 125.85 and below will extend the consolidation with another falling leg before up trend resumption.
AUD/USD Daily Outlook
Daily Pivots: (S1) 0.7641; (P) 0.7670; (R1) 0.7704; More...
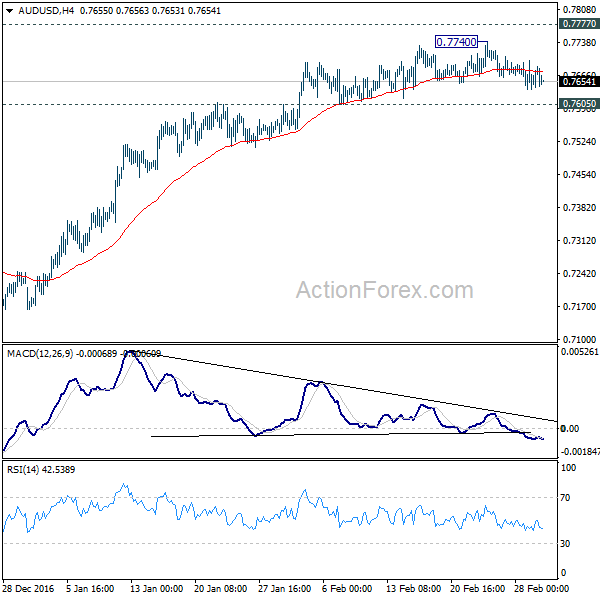
AUD/USD is still staying in range of 0.7605/7740 and intraday bias remains neutral. Another rise cannot be ruled out. However, considering bearish divergence condition in 4 hour MACD, upside should be limited by 0.7777/7833 resistance zone and bring near term reversal. On the downside, break of 0.7605 support will indicate that rise from 0.7158 has completed already and turn bias back to the downside for 55 day EMA (now at 0.7570) first.
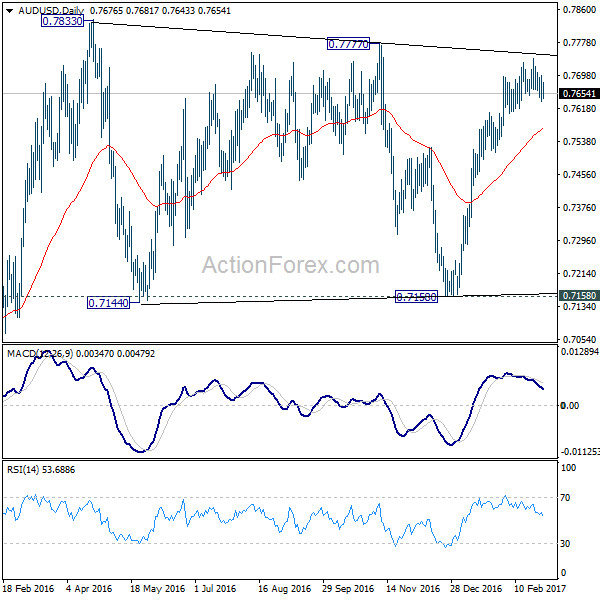
In the bigger picture, we're still treating price actions from 0.6826 low as a correction. And, as long as 38.2% retracement of 0.9504 to 0.6826 at 0.7849 holds, long term down trend from 1.1079 is expected to resume sooner or later. Break of 0.6826 low will target 0.6008 key support level. However, firm break of 0.7849 will indicate that rise from 0.6826 is developing into a medium term rebound, rather than a sideway pattern. In such case, stronger rise should be seek to 55 month EMA (now at 0.8186) and above.
USD/CAD Daily Outlook
Daily Pivots: (S1) 1.3286; (P) 1.3322; (R1) 1.3360; More...
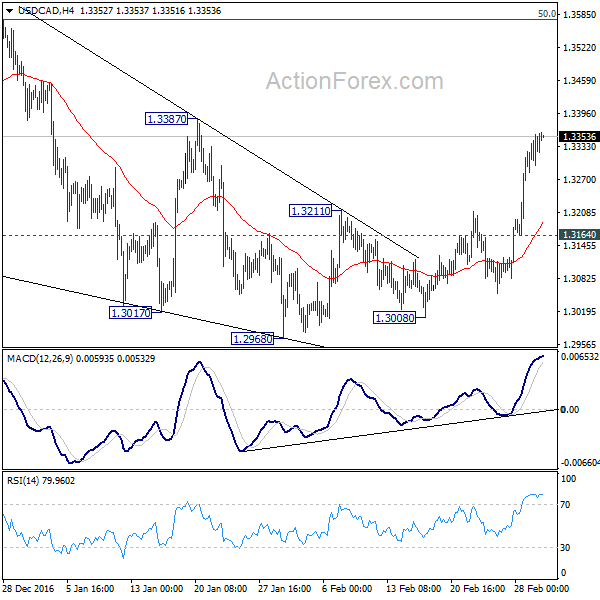
Intraday bias in USD/CAD remains on the upside as rebound from 1.2968 continues. As noted before, pull back from 1.3598 has completed at 1.2968 already. Break of 1.3387 will target a test on 1.3598 resistance next. Also, break there will extend the larger rally from 1.2460 towards next fibonacci level at 1.3838. On the downside, though, below 1.3164 minor support will turn bias back to the downside for 1.2968 support instead.
In the bigger picture, price actions from 1.4689 medium term top are seen as a correction pattern. The first leg has completed at 1.2460. The second leg is likely still in progress and could target 61.8% retracement of 1.4689 to 1.2460 at 1.3838. We'd look for reversal signal there to start the third leg. Break of 1.2968 wold at least bring at retest of 1.2460 low. However, sustained trading above 1.3838 would pave the way to retest 1.4689 high.
Strong Risk Appetite Pushed Stocks to Record, Dollar Strengthened with Hesitation
Strong risk appetite boosted US markets to new record highs overnight. DJIA jumped 303.31 pts, or 1.46%, to close at 21115.55. S&P 500 rose 32.32 pts, or 1.37%, to close to 2395.96. NASDAQ also gained 78.59 pts, or 1.35%, to end at 5904.03. All three indices closed at records. Positive sentiments also pulled treasury yields higher with 10 year yield rose 0.105 to close at 2.463 and revived underlying bullishness. Dollar was boosted by increased speculation of March Fed hike as the Dollar index hitting at high at 101.97. The break of 101.76 in the dollar index confirmed resumption of recent rebound from 99.23. However, development in the currency markets doesn't warrant decisive momentum in the greenback yet. EUR/USD is held above 1.0493 support, AUD/USD above 0.7605 support. USD/CHF is limited below 1.0140 resistance and USD/JPY is held below 114.94 resistance. The strength in the greenback is more apparent in GBP/USD and USD/CAD only. More evidence is needed to confirm bullishness in the greenback.
Fed Brainard: Rate hike appropriate "soon"
Markets continued to raise bet on a rate hike by Fed in March. Fed fund futures are now pricing in 66.4% chance of it, comparing to 65.4% a day ago. Fed governor Lael Brainard said yesterday that "we are closing in on full employment, inflation is moving gradually toward our target, foreign growth is on more solid footing and risks to the outlook are as close to balanced as they have been in some time." She noted "bear-term risks to the United States from abroad appear to have diminished." And, "recoveries are gaining traction in China, Europe and Japan, in part reflecting greater confidence in their respective policy environments." Hence, "assuming continued progress, it will likely be appropriate soon to remove additional accommodation, continuing on a gradual path."
Fed Beige Book positive but not overwhelming
Fed released the Beige Book economic report based on information collected from early January through mid February. The reported noted that some district reported "widening labor shortages." At this point, wages only rose "modestly or moderately" though, in general. A few districts reported "some pickup in the pace of wage growth." Meanwhile, "businesses were generally optimistic about the near-term outlook but to a somewhat lesser degree than in the prior report." Overall, all 12 Fed districts reported "modest-to-moderate" growth and inflation cooled a little bit.
BoC on hold
As widely anticipated, BOC kept its monetary policy unchanged with the overnight rate at 0.5%, the Bank rate at 0.75% and the deposit rate at 0.25%. The central bank acknowledged that both global and domestic economic indicators were consistent with its projection of improving growth laid out in January. It also note Canadian growth in 4q16 came in 'slightly stronger than expected'. However, policymakers maintained a cautious tone noting that 'material excess capacity' remained and that the central bank is 'attentive to the impact of significant uncertainties weighing on the outlook'. Therefore, the risks and slacks in the economy justified leaving the policy rate at exceptionally low level.
On the data front, Japan monetary base rose 21.4% yoy in February. Australia trade surplus narrowed to AUD 1.3b in January, building approvals rose 1.8% mom. Swiss will release GDP and retail sales in European session. Germany will release import price index. UK will release construction PMI. Eurozone will release PPI, CPI and unemployment rate. US will release Challenger job cuts and jobless claims in US session. Canada will release GDP.
USD/CAD Daily Outlook
Daily Pivots: (S1) 1.3286; (P) 1.3322; (R1) 1.3360; More...
Intraday bias in USD/CAD remains on the upside as rebound from 1.2968 continues. As noted before, pull back from 1.3598 has completed at 1.2968 already. Break of 1.3387 will target a test on 1.3598 resistance next. Also, break there will extend the larger rally from 1.2460 towards next fibonacci level at 1.3838. On the downside, though, below 1.3164 minor support will turn bias back to the downside for 1.2968 support instead.
In the bigger picture, price actions from 1.4689 medium term top are seen as a correction pattern. The first leg has completed at 1.2460. The second leg is likely still in progress and could target 61.8% retracement of 1.4689 to 1.2460 at 1.3838. We'd look for reversal signal there to start the third leg. Break of 1.2968 wold at least bring at retest of 1.2460 low. However, sustained trading above 1.3838 would pave the way to retest 1.4689 high.
Economic Indicators Update
| GMT | Ccy | Events | Actual | Forecast | Previous | Revised |
|---|---|---|---|---|---|---|
| 23:50 | JPY | Monetary Base Y/Y Feb | 21.40% | 23.20% | 22.60% | |
| 0:30 | AUD | Trade Balance (AUD) Jan | 1.30B | 3.82B | 3.51B | 3.33B |
| 0:30 | AUD | Building Approvals M/M Jan | 1.80% | -0.50% | -1.20% | -2.50% |
| 6:45 | CHF | GDP Q/Q Q4 | 0.40% | 0.00% | ||
| 7:00 | EUR | German Import Price Index M/M Jan | 0.50% | 1.90% | ||
| 8:15 | CHF | Retail Sales (Real) Y/Y Jan | -3.50% | |||
| 9:30 | GBP | Construction PMI Feb | 52 | 52.2 | ||
| 10:00 | EUR | Eurozone PPI M/M Jan | 0.60% | 0.70% | ||
| 10:00 | EUR | Eurozone PPI Y/Y Jan | 3.20% | 1.60% | ||
| 10:00 | EUR | Eurozone Unemployment Rate Jan | 9.60% | 9.60% | ||
| 10:00 | EUR | Eurozone CPI Estimate Y/Y Feb | 1.90% | 1.80% | ||
| 10:00 | EUR | Eurozone CPI - Core Y/Y Feb A | 0.90% | 0.90% | ||
| 12:30 | USD | Challenger Job Cuts Y/Y Feb | -38.80% | |||
| 13:30 | CAD | GDP M/M Dec | 0.30% | 0.40% | ||
| 13:30 | USD | Initial Jobless Claims (FEB 25) | 245k | 244k | ||
| 15:30 | USD | Natural Gas Storage | -89B |
Possible Wave Structure In Play For The Cable
Key Points:
- Price action enters a support zone.
- RSI Oscillator strongly oversold.
- Short term retracement back towards 1.2346 likely in the coming session.
The Cable has been on a roller coaster over the past few days as price action broke down and dropped through the short term channel formation. However, despite the intraday bias being bearish, the currency is currently reaching the limits of its decline and we are likely to see a rebound in the coming session.
In particular, the defining indicator is the RSI Oscillator which has been trending sharply lower broadly in line with price action’s recent machinations. However, the oscillator has now entered oversold territory and there is subsequently building pressure for some relief. Additionally, price action has also entered a historically important area, from late 2016, which has seen reversals occurring. Subsequently, the 1.2259 support level will be relatively critical in the upcoming session if any retracement is to occur.
However, the medium time frame could be a different story with a key swing point at 1.2346 remaining in-tact largely consigning the pair to further declines. In fact, there really isn’t any sign of any form of medium term bottoming just yet which may suggest a deeper decline in play. Subsequently, sustained trading below the 61.8% Fibonacci retracement level is likely to mean further break downs to come.
Fundamentally, the Cable has a busy few days ahead with the UK Construction and Services PMI figures due out. In particular, Friday’s Services PMI is likely to be closely watched by the market and will need to exceed the forecast of 54.1 to reverse its current trajectory.
Regardless of the medium term view, the extent of the short term decline has likely run its course especially given the currently oversold RSI Oscillator. In addition, there are plenty of reasons to see a retracement given that price action has also just entered a historic reversal and liquidity zone. Subsequently, the most likely scenario is where the Cable rises back to challenge the support/resistance zone around 1.2346, and possibly back inside the intraday equidistant channel that had formed between 1.2400 and 1.2500. However, keep a close watch on any penetrative moves below the 1.2259 support area as this could be signalling further declines ahead.
Loonie Rally Ready For A Brief Pause
Key Points:
- Post-breakout rally running out of steam.
- ABC wave could be taking place.
- Technical bias remains bullish in the medium to long-term.
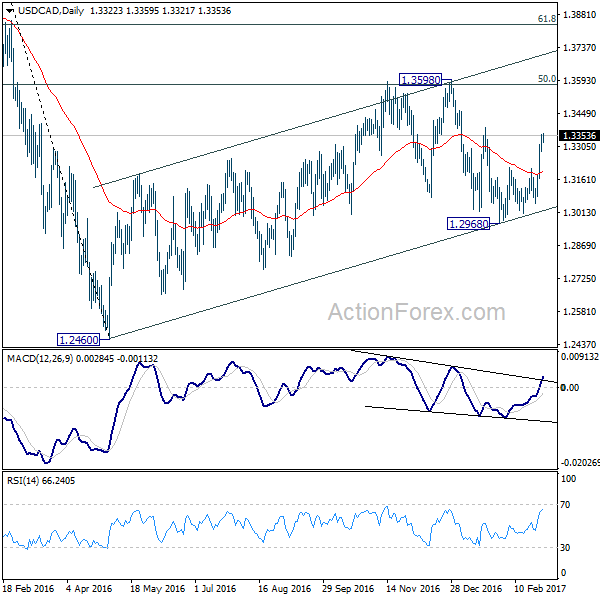
Following its breakout from that falling wedge, the USDCAD has absolutely been on fire and has now moved all the way back to the 1.3356 mark in only a handful of sessions. However, the pair may need to cool off in the near-term given some mounting resistance to the recent bullish phase. As a result, it's worth taking a look at some of the technicals to form a bias moving forward.
Firstly, we need to establish whether the Loonie's momentum has run dry or if we are instead going to see further gains moving ahead. Well, as shown on the daily chart below, the rally seems to be stalling somewhat as it approaches the 1.3356 level which, coincidently, happens to be the 61.8% Fibonacci retracement. Combined with a highly overbought stochastic reading, the probability of seeing a reversal to the downside is looking fairly good which could have some interesting implications for the pair.
Indeed, moving into a decline could mean that we are in the early stages of a corrective wave formation. Specifically, an ABC wave could be on the horizon and this would broadly be in line with the Loonie's long-term technical bias. Of course, we will need some more confirmation before committing to this forecast and this would come as a result of seeing the near-term downtrend reach the 1.3214 mark and subsequently reversing.
At the 1.3214 level, support should kick in strongly, hence the rather early suggestion of a corrective ABC wave. This support would largely be a result of the 38.2% Fibonacci retracement and the 100 day moving average which should, at its current trajectory, provide some dynamic support around this price. All going according to plan, this will inspire a reversal to the upside and the completion of a ‘C' leg that could extend all the way to the 1.3470 mark.
Ultimately, there seems to be a rather solid chance of a seeing this ABC wave take hold in the imminent future. More precisely, the combination of both strong bullish and bearish sentiment alongside the robust zones of support and resistance should result in the desired price action. Whether gains extend beyond the forecasted end of the pattern is anyone's guess but, if they do, it could mean we are faced with an Elliot wave capable of seeing the upside of the channel challenged. As a result, the Loonie could certainly be worth keeping an eye on moving ahead.
US Tax Reform Plan To Direct BOC Monetary Policy Outlook
As widely anticipated, BOC kept its monetary policy unchanged with the overnight rate at 0.5%, the Bank rate at 0.75% and the deposit rate at 0.25%. The central bank acknowledged that both global and domestic economic indicators were consistent with its projection of improving growth laid out in January. It also note Canadian growth in 4q16 came in 'slightly stronger than expected'. However, policymakers maintained a cautious tone noting that 'material excess capacity' remained and that the central bank is 'attentive to the impact of significant uncertainties weighing on the outlook'. Therefore, the risks and slacks in the economy justified leaving the policy rate at exceptionally low level.
In the discussions of economic developments, BOC remained wary that 'exports continue to face the ongoing competitiveness challenges described in the January MPR'. It added that despite improvement in the employment situation, 'subdued growth in wages and hours worked continue to reflect persistent economic slack in Canada, in contrast to the US'. The central bank also reiterated its vigilance over 'significant uncertainties' and risks weighing on the outlook. We believe one of the biggest uncertainties and risks facing Canada is the new US administration tax and trade policies.
US President Donald Trump failed to surprise the market at his State of the Union address earlier this week. While he reiterated that plans to make historic tax reforms and increase infrastructural spending worth of as much as US$1 trillion, the details are lacking. On tax reform, Trump indicated that his team 'is developing historic tax reform that will reduce the tax rate on our companies so they can compete and thrive anywhere and with anyone' and would also 'provide massive tax relief for the middle class'. Although the fact that Trump had not specifically mentioned border adjustment tax (BAT) at the joint session address might diminish the chance that such tax would be implemented, the risks cannot be ruled out. We believe Canada would be seriously affected if BAT is enacted given the close US-Canada trade relations.
According to the US trade office, Canada is US' second largest goods trading partner (after China) with US$575B in total (two way) goods trade during 2015. The market would be closely watching the detailed tax plans, scheduled for release in coming weeks, to see if BAT would be adopted. If yes, if key Canadian exports, i.e. energy, would be exempted from the new tax.
Indeed, there are several scenarios that could happen to the new US-Canada trade relations. In case BAT is adopted, Canada's export-reliant economy would be severely affected. We expect Canadian dollar to fall around 5% against US dollar. BOC would turn even more dovish, making further rate cut possible. However, if BAT is adopted with exemption in the energy sector, BOC would remain cautious, monitory the impact on non-energy exports. However, policymakers would be less urgent to cut rates further. The best scenario for Canada is no BAT in US' new tax reform plan. In the case, BOC would likely change to a more neutral tone from the current dovish one. The chance of a BOC rate hike in late-2017 is also increased.