
Sample Category Title
USD/JPY Candlesticks and Ichimoku Analysis
Weekly
- Last Candlesticks pattern: Long white candlestick
- Time of formation: 14 Nov 2016
- Trend bias: Near term up
Daily
- Last Candlesticks pattern: Hammer
- Time of formation: 09 Nov 2016
- Trend bias: Down
USD/JPY – 118.06
Although the greenback slipped last week to as low as 116.04, dollar found renewed buying interest there and has staged a strong rebound, suggesting the pullback from last month's high of 118.66 has possibly ended there and consolidation with upside bias is seen for test of 117.82 resistance, however, a daily close above there is needed to retain bullishness and bring retest of 118.66. Looking ahead, once this level is penetrated, this would extend recent upmove from 99.01 low for further gain to 119.50-55 (76.4% retracement of 125.86-99.01) and then psychological level at 120.00.
On the downside, expect pullback to be limited to 117.40-50 and support at 117.20-21 should contain downside, bring another rise later. Only below 116.42 would risk test of said support at 116.04 but break there is needed to signal a temporary top is formed, bring retracement of recent upmove to the Kijun-Sen (now at 115.16) and then 114.75-80, however, 114.00-10 would remain intact.
Recommendation : Buy at 117.50 for 119.50 with stop below 116.50.

On the weekly chart, as the greenback has maintained a firm undertone after recent rally in Q4 2016, suggesting the upmove from 99.01 low is still in progress and above 118.66 (last month's high) may extend further gain to 119.50-55 (76.4% retracement of 125.86-99.01), then 120.00 psychological level but reckon previous chart resistance at 121.69 should hold from here, bring retreat later.
On the downside, although initial pullback to 117.40-50 cannot be ruled out, reckon downside would be limited to 117.00 and bring another rise. Only below support at 116.04 would defer and prolong consolidation below said recent high at 118.66, bring retracement to 114.70-75 and then 114.00 but reckon downside would be limited to 112.85-90, bring another upmove later.

Trade Idea : USD/CHF – Buy at 1.0215
USD/CHF - 1.0259
Most recent candlesticks pattern : N/A
Trend : Up
Tenkan-Sen level : 1.0235
Kijun-Sen level : 1.0225
Ichimoku cloud top : 1.0188
Ichimoku cloud bottom : 1.0160
New strategy :
Buy at 1.0225, Target: 1.0325, Stop: 1.0190
Position : -
Target : -
Stop : -
The greenback has risen again after finding renewed buying interest at 1.0210, suggesting the rally from 1.0057 (last week's low) is still in progress and may extend further gain to 1.0290-00 but break of resistance at 1.0322 (last week's high) is needed to retain bullishness and extend recent upmove to 1.0344 resistance (last month's high), then towards 1.0390-00 which is likely to hold from here due to near term overbought condition.
In view of this, we are looking to buy dollar on pullback as support at 1.0210 should limit downside. Only below 1.0180-85 support would abort and signal an intra-day top is formed, risk weakness to 1.0160 but still reckon support at 1.0144 would contain weakness.

EUR/GBP Daily Outlook
Daily Pivots: (S1) 0.8471; (P) 0.8568; (R1) 0.8620; More...
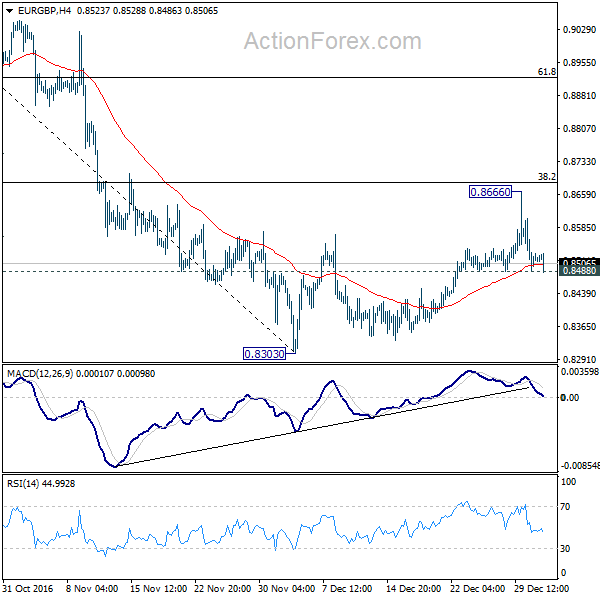
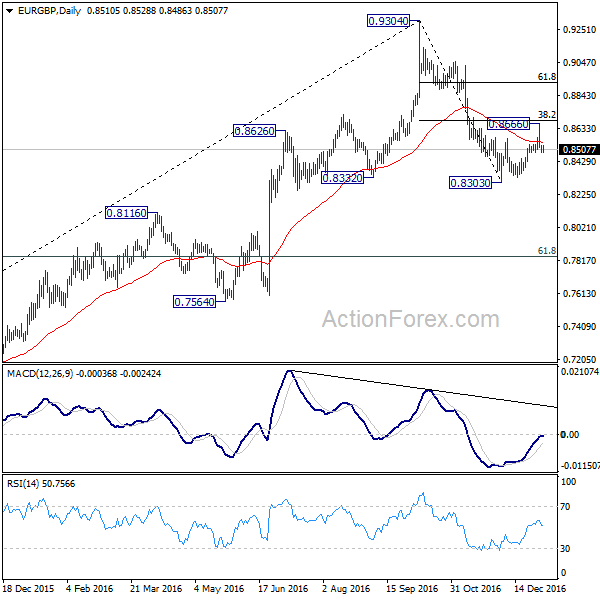
EUR/GBP failed to take out 38.2% retracement of 0.9304 to 0.8303 at 0.8685 and retreated. Intraday bias is turned neutral first. Break of 0.8488 minor support will argue that the recovery from 0.8303 is completed. And more importantly, bias will be turned back to the downside to extend the larger fall from 0.9304 through 0.8303 low. In that case, we'd look for bottoming around 0.8116.
In the bigger picture, price actions from 0.9304 are viewed as a medium term corrective pattern. Deeper fall cannot be ruled out yet. But we'd expect strong support around 55 weeks EMA (now at 0.8230) to contain downside. Overall, the corrective pattern would take some time to complete before long term up trend resumes at a later stage. Break of 0.9304 will pave the way to 0.9799 (2008 high).
Subscribe to our daily and mid-day newsletter to get this report delivered to your mail box
EUR/AUD Daily Outlook
Daily Pivots: (S1) 1.4503; (P) 1.4609; (R1) 1.4703; More...
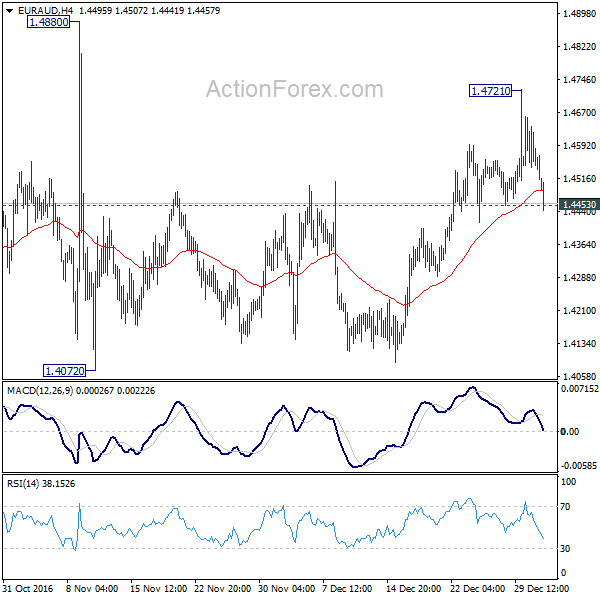
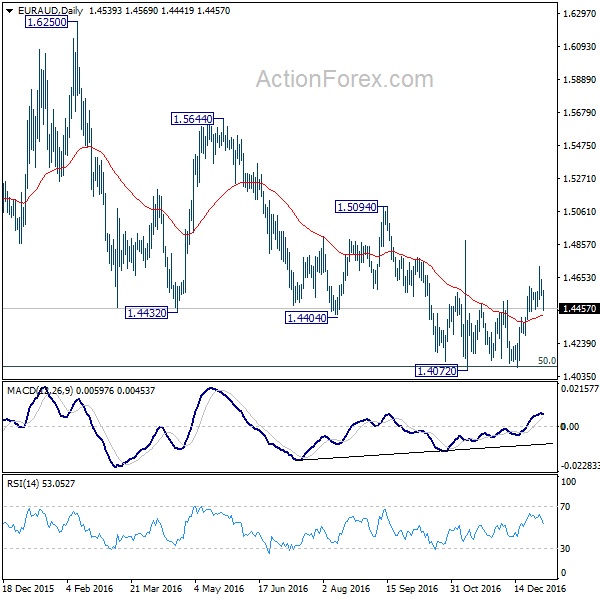
Break of 1.4453 minor support argues that's EUR/AUD's rebound is completed at 1.4721. And the development keeps the pair in range of 1.4072/4880. Intraday bias is turned neutral first. On the downside, break of 1.4072 will extend the correction from 1.6587 towards next key support level 1.3671. Meanwhile, decisive break of 1.4880 resistance will indicate that such correction from 1.6587 is completed and turn near term outlook bullish for 1.5094 resistance next.
In the bigger picture, price actions from 1.6587 medium term top are viewed as a consolidative pattern. 50% retracement of 1.1602 to 1.6587 at 1.4095 was already met. While further fall cannot be ruled out, we'd expect strong support above 1.3671 to contain downside and bring rebound. Up trend from 1.1602 should not be finished and will resume later. Break of 1.5094 will be the first sign of resumption of up trend from 1.1602 and target retesting 1.6587 resistance first.
Subscribe to our daily and mid-day newsletter to get this report delivered to your mail box
GBP/JPY Daily Outlook
Daily Pivots: (S1) 143.19; (P) 143.89; (R1) 145.12; More...
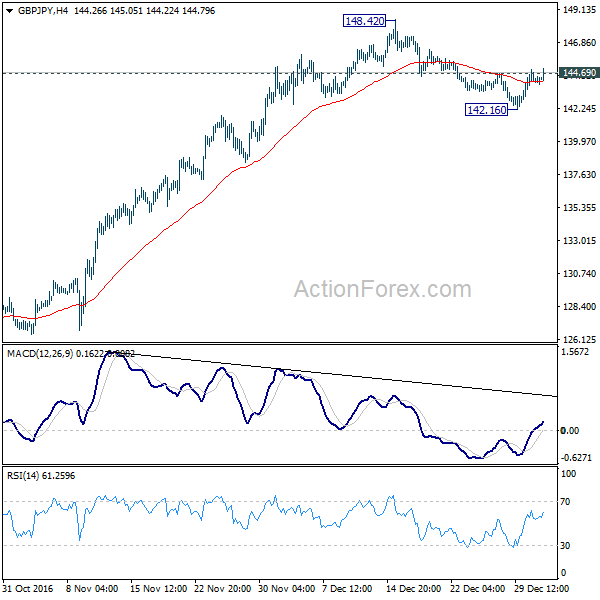
Break of 144.69 minor resistance argues that pull back from 148.42 is finished at 142.16. Intraday bias in GBP/JPY is turned back to the upside for 148.42. Break there will extend the whole rise from 122.36. Still, such rally is seen as a corrective move. Hence, we'd expect strong resistance from 150.43 long term fibonacci level to limit upside. Break of 142.16 should confirm short term topping and bring decline to 55 day EMA (now at 140.03) and below.
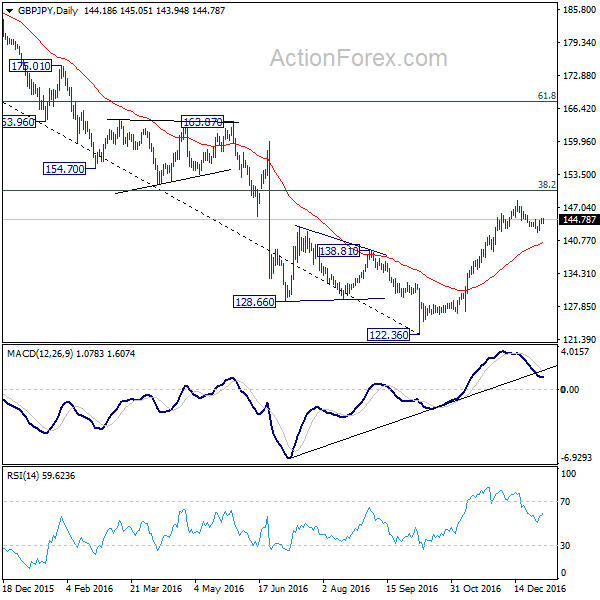
In the bigger picture, the down trend from 195.86 top (2015 high) should have made a medium term bottom at 122.36 after hitting 100% projection of 195.86 to 154.70 from 163.87 at 122.71. Rise from there is now expected to develop into a medium term corrective pattern. Upside should be limited by 38.2% retracement of 195.86 to 122.36 at 150.4 for setting the medium term range.
Subscribe to our daily and mid-day newsletter to get this report delivered to your mail box
Trade Idea : GBP/USD – Sell at 1.2305
GBP/USD - 1.2275
Most recent candlesticks pattern : N/A
Trend : Down
Tenkan-Sen level : 1.2289
Kijun-Sen level : 1.2309
Ichimoku cloud top : 1.2336
Ichimoku cloud bottom : 1.2304
New strategy :
Sell at 1.2305, Target: 1.2205, Stop: 1.2340
Position : -
Target : -
Stop : -
Although cable staged a strong rebound last week from 1.2200 to 1.2388, the subsequent selloff from there suggests top has been made there and consolidation with downside bias is seen for further fall to 1.2240, however, break of support at 1.2220 is needed to signal recent decline has resumed for retest of 1.2200, below there would extend weakness to 1.2170 and later 1.2150 but 1.2120-25 (50% projection of 1.2728-1.2200 measuring from 1.2388) should limit downside.
In view of this, we are looking to sell cable on recovery as 1.2300-10 should limit upside. Only above 1.2340-50 would defer and suggest the retreat from 1.2388 has ended, bring retest of this level first.

EUR/JPY Daily Outlook
Daily Pivots: (S1) 122.27; (P) 123.04; (R1) 123.92; More...
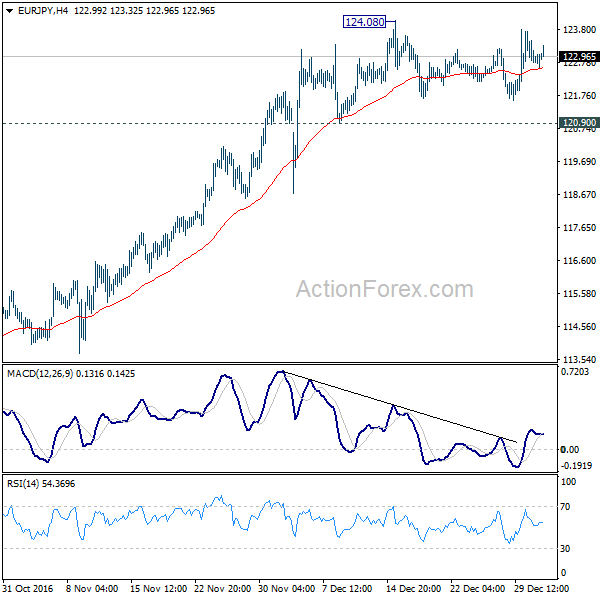
EUR/JPY is staying in range below 124.08 and intraday bias remains neutral for the moment. Consolidation could extend but overall, further rally is in favor as long as 120.90 support holds. Above 124.08 will target 126.09 key resistance next. Considering bearish divergence condition in 4 hours MACD, we'd be cautious on topping around 126.09. Meanwhile, break of 120.90 will indicate short term topping and turn bias to the downside for 55 days EMA (now at 119.81).
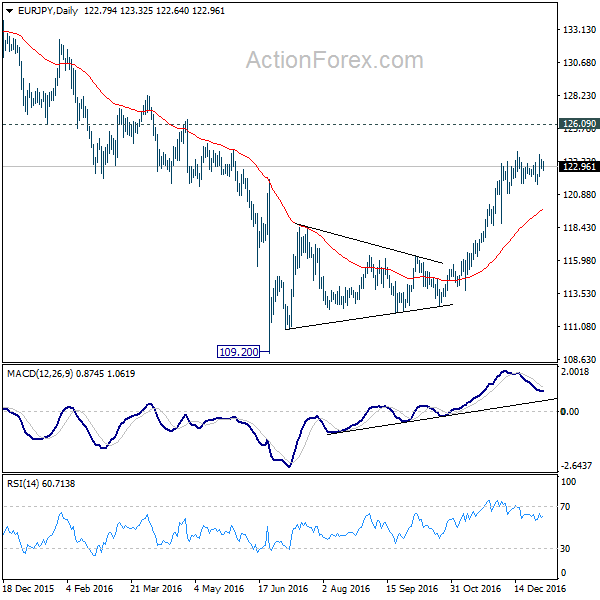
In the bigger picture, price actions from 109.20 medium term bottom are seen as correcting whole down trend from 149.76 to 109.20. There is prospect of another rise towards 126.09 key resistance level before completion. But even in that case, we'd expect strong resistance between 126.09 and 141.04 to limit upside, at least on first attempt.
Subscribe to our daily and mid-day newsletter to get this report delivered to your mail box
Trade Idea : EUR/USD – Sell at 1.0480
EUR/USD - 1.0435
Most recent candlesticks pattern : N/A
Trend : Down
Tenkan-Sen level : 1.0459
Kijun-Sen level : 1.0477
Ichimoku cloud top : 1.0548
Ichimoku cloud bottom : 1.0536
New strategy :
Sell at 1.0480, Target: 1.0380, Stop: 1.0515
Position : -
Target : -
Stop : -
The single currency has fallen again after meeting renewed selling interest at 1.0490 earlier today, suggesting the selloff from last week's high at 1.0654 is still in progress and may extend further weakness to 1.0400, however, break of previous support at 1.0372 is needed to retain bearishness and signal early downtrend has resumed for retest of 1.0352 low later.
In view of this, would not chase this fall here and would be prudent to sell euro on recovery as the Kijun-Sen (now at 1.0477) should limit upside and bring another decline. A break above previous support at 1.0506 (now resistance) would defer and risk a stronger rebound to the lower Kumo (now at 1.0536) first.

EUR/CHF Daily Outlook
Daily Pivots: (S1) 1.0697; (P) 1.0727; (R1) 1.0745; More...
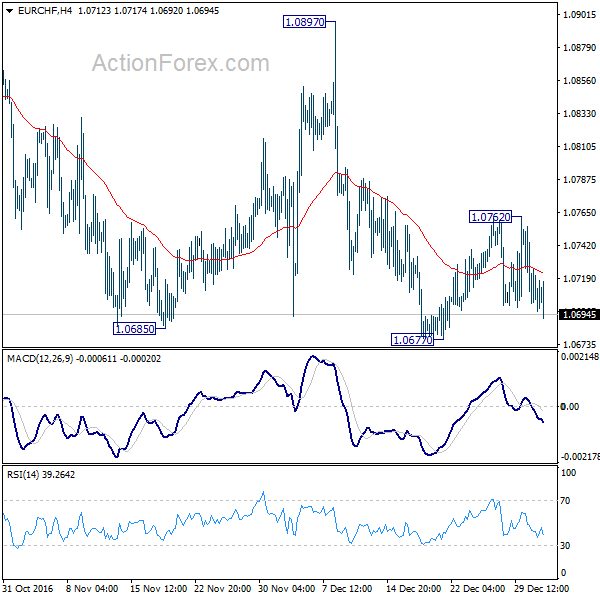
EUR/CHF is staying in consolidation above 1.0677 and intraday bias remains neutral. Above 1.0762 will extend the corrective rise from 1.0677. But overall, outlook will stay bearish as long as 1.0897 resistance holds. Corrective pattern from 1.1198 is still in progress and another fall is expected. Below 1.0677 will target key support level at 1.0620 next. Though, decisive break of 1.0897 resistance will suggest reversal and turn near term outlook bullish.
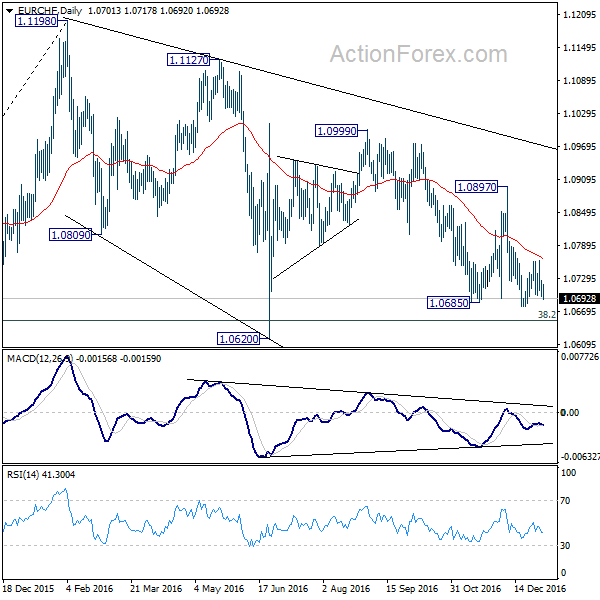
In the bigger picture, the decline from 1.1198 is seen as a corrective move. Such correction is still in progress and retest of 38.2% retracement of 0.9771 to 1.1198 at 1.0653 could be seen. Sustained trading below 1.0653 will target 50% retracement at 1.0485. Meanwhile, break of 1.0897 resistance is needed to be the sign of completion of the correction. Otherwise, risk will stay on the downside in case of recovery.
Subscribe to our daily and mid-day newsletter to get this report delivered to your mail box
Trade Idea : USD/JPY – Buy at 117.45
USD/JPY - 117.97
Most recent candlesticks pattern : N/A
Trend : Up
Tenkan-Sen level : 117.63
Kijun-Sen level : 117.42
Ichimoku cloud top : 116.84
Ichimoku cloud bottom : 116.62
New strategy :
Buy at 117.45, Target: 118.45, Stop: 117.10
Position : -
Target : -
Stop : -
As the greenback has surged again after brief pullback to 117.21, suggesting the rally from 116.04 (last week's low) is still in progress and may extend gain towards resistance at 118.25, however, a break above there is needed to signal the pullback from 118.66 has ended, bring retest of this level later.
In view of this, we are looking to buy dollar on pullback as the Kijun-Sen (now at 117.43) should limit downside and support at 117.21 should remain intact. Only a firm break below said support at 117.21 would defer and risk correction to 116.80-85 before prospect of another upmove.
