
Sample Category Title
Trade Idea: EUR/GBP – Sell at 0.8560
EUR/GBP - 0.8486
Recent wave: Major double three (A)-(B)-(C)-(X)-(A)-(B)-(C) is unfolding and 2nd (A) has possibly ended at 0.6936.
Trend: Near term up
New strategy :
Sell at 0.8560, Target: 0.8430, Stop: 0.8600
Position : -
Target : -
Stop : -
Although the single currency rallied to 0.8669 late last week, the subsequent sharp retreat suggests top has possibly been formed there and consolidation with downside bias is seen for weakness to 0.8450, then 0.8420-30, however, break of 0.8375 is needed to signal the rebound from 0.8304 (last month's low) has ended, bring further subsequent decline to 0.8332 support.
In view of this, we are looking to sell euro on recovery as 0.8550-60 should limit upside. Only break of 0.8605-10 would abort and suggest the retreat from 0.8669 has ended instead, risk retest of this last week's high later.
Our preferred count is that, after forming a major top at 0.9805 (wave V), (A)-(B)-(C) correction is unfolding with (A) leg ended at 0.8400 (A: 0.8637, B: 0.9491 and 5-waver C ended at 0.8400. Wave (B) has ended at 0.9413 and impulsive wave (C) has either ended at 0.8067 or may extend one more fall to 0.8000 before prospect of another rally. Current breach of indicated resistance at 0.9043 confirms our view that the (C) leg has ended and bring stronger rebound towards 0.9150/54, then towards 0.9240/50.

Trade Idea: USD/CAD – Sell at 1.3500
USD/CAD - 1.3436
Recent wave: Only wave v of c has ended at 0.9407 and wave C of major A-B-C correction is underway for headway to 1.4700
Trend: Near term up
New strategy :
Sell at 1.3500, Target: 1.3300, Stop: 1.3560
Position: -
Target: -
Stop:-
Although the greenback retreated after rising to 1.3599 last week, suggesting top has possibly been formed there and consolidation with mild downside bias is seen for retracement of recent rise, below 1.3385-90 would add credence to this view and extend weakness to 1.3355-60, then towards 1.3300-10 later which is likely to contain downside.
In view of this, we are looking to sell on recovery as 1.3500-10 should limit upside. Only above resistance at 1.3558 would abort and signal the retreat from 1.3599 has ended, bring retest of this level first, once this resistance is penetrated, this would extend recent upmove to 1.3650-60 first.
To recap, wave B from 1.3066 is unfolding as an a-b-c and is sub-divided as a: 1.2192, b: 1.2716 and wave c is a 5-waver with i: 1.1983, ii: 1.2506, extended wave iii with minor iii at 1.0206, wave iv ended at 1.0781 and wave v as well as wave iii has ended at 0.9931, hence the subsequent choppy trading is the wave iv which is unfolding as (a)-(b)-(c) with (a) leg of iv ended at 1.0854, followed by (b) leg at 1.0108 and (c) leg as well as the wave iv ended at 1.0674. The wave v is sub-divided by minor wave (i): 0.9980, (ii): 1.0374, (iii): 0.9446, (iv): 0.9913 and (v) as well as v has possibly ended at 0.9407, therefore, consolidation with upside bias is seen for major correction, indicated target at 1.3700 and 1.4000 had been met and further gain to 1.4700 would be seen later.

GBP/USD Mid-Day Outlook
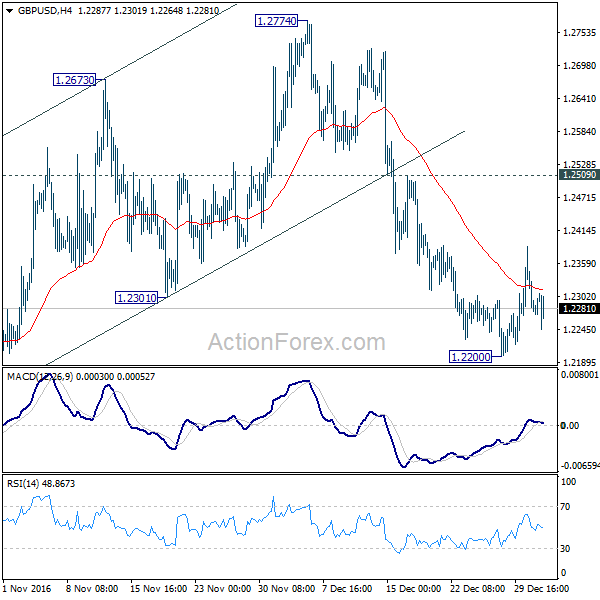
Daily Pivots: (S1) 1.2262; (P) 1.2324; (R1) 1.2405; More...
Intraday bias in GBP/USD remains neutral for consolidation above 1.2200. Overall outlook is unchanged. That is, corrective rise from 1.1946 has completed at 1.2774. Recovery from 1.2200 should be limited 1.2509 resistance and bring fall resumption. Below 1.2200 will target a test on 1.1946 low. Decisive break there will confirm larger down trend resumption.
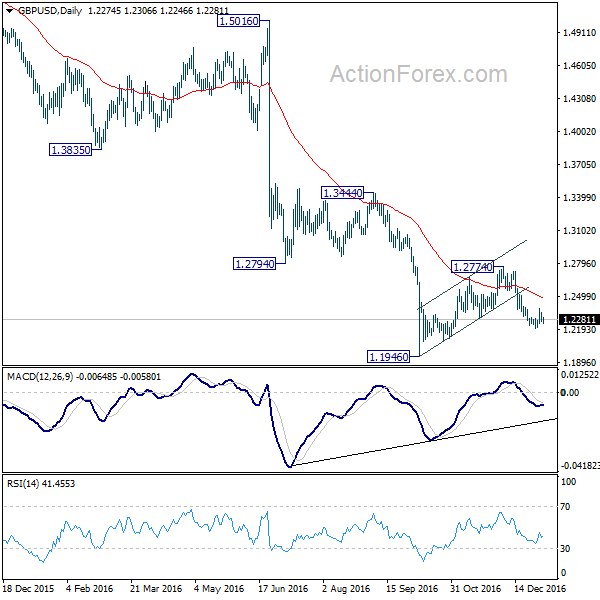
In the bigger picture, fall from 1.7190 is seen as part of the down trend from 2.1161. There is no sign of medium term bottoming yet. Sustained trading below 61.8% projection of 2.1161 to 1.3503 from 1.7190 at 1.2457 will target 100% projection at 0.9532. Overall, break of 1.3444 resistance is needed to confirm medium term bottoming. Otherwise, outlook will remain bearish.
Subscribe to our daily and mid-day newsletter to get this report delivered to your mail box
USD/CHF Mid-Day Outlook
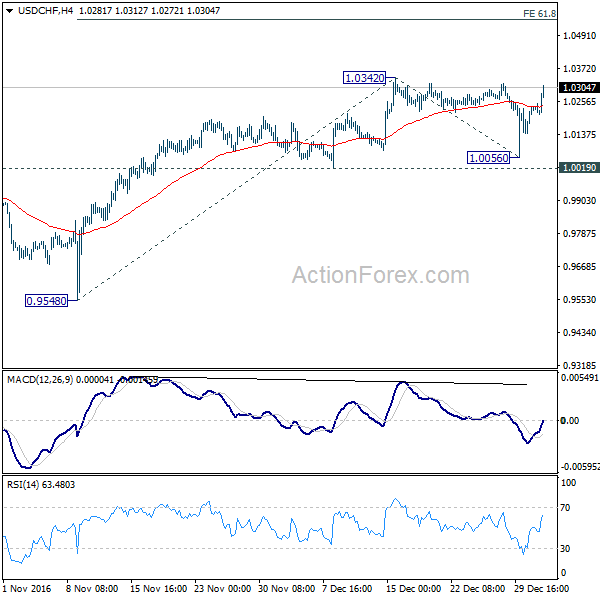
Daily Pivots: (S1) 1.0078; (P) 1.0155; (R1) 1.0255; More.....
USD/CHF rises sharply today and focus is back on 1.0342 resistance. Break will confirm resumption of recent up trend. In that case, intraday bias will be turned back to the upside for 61.8% projection of 0.9548 to 1.0342 from 1.0056 at 1.0547. In case of another retreat, we'd expect downside to be contained by 1.0019 support and bring rebound.
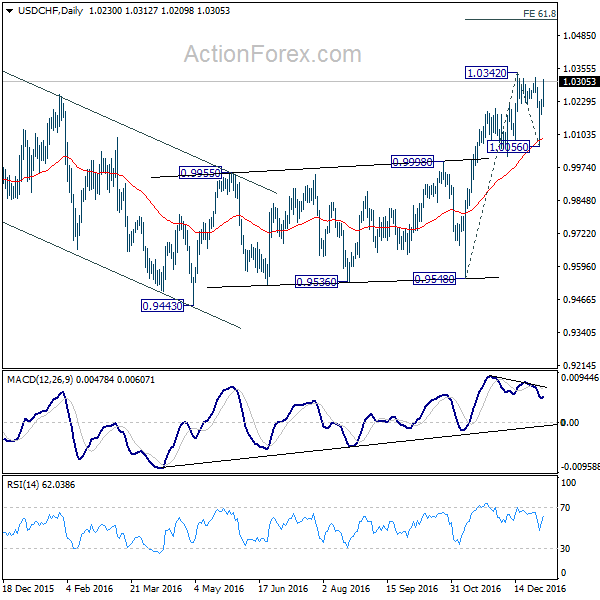
In the bigger picture, the corrective fall from 1.0327 should have completed at 0.9443 already. Rise from 0.9443 could be resuming the long term rally from 2011 low at 0.7065. But decisive break of 1.0327 is needed to confirm. In that case, next medium term upside target will be 38.2% retracement of 1.8305 to 0.7065 at 1.1359. Rejection from 1.0327 will extend the sideway pattern with another fall back to 0.9443/9540 support zone.
Subscribe to our daily and mid-day newsletter to get this report delivered to your mail box
USD/JPY Mid-Day Outlook
Daily Pivots: (S1) 116.28; (P) 116.73; (R1) 117.44; More...
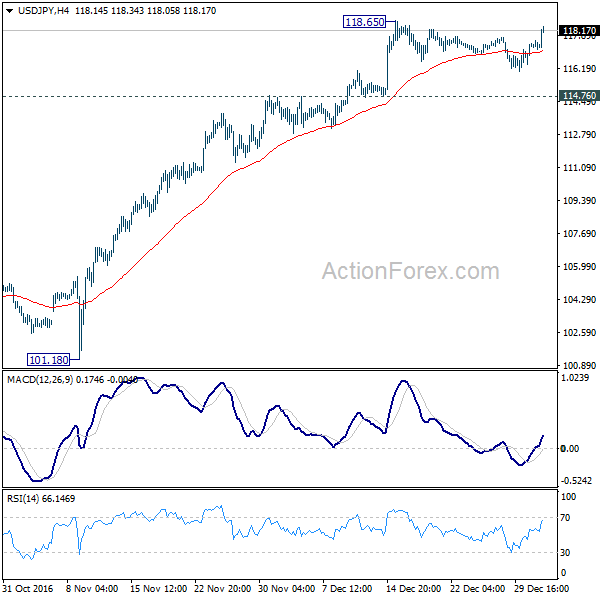
USD/JPY's rebound continues and focus is back on 118.65 resistance. Break will confirm resumption of whole rise from 98.97. In such case, intraday bias will be turned back to the upside for retesting 125.85 high. We'd be cautious on topping at 125.85 on first attempt. In case of another retreat, downside should be contained by 114.76 support and bring rally resumption finally.
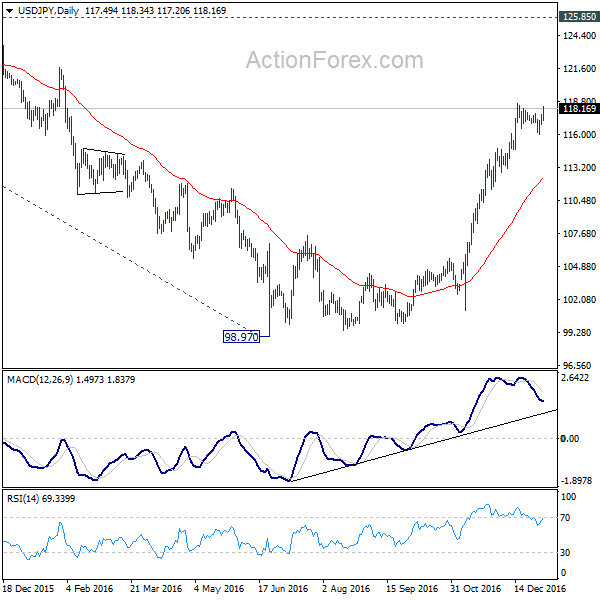
In the bigger picture, price actions from 125.85 high are seen as a corrective pattern. The impulsive structure of the rise from 98.97 suggests that the corrective is completed and larger up trend is resuming. Decisive break of 125.85 will confirm and target 61.8% projection of 75.56 to 125.85 from 98.97 at 130.04 and then 135.20 long term resistance.
Subscribe to our daily and mid-day newsletter to get this report delivered to your mail box
EUR/USD Mid-Day Outlook
Daily Pivots: (S1) 1.0449; (P) 1.0551 (R1) 1.0620; More.....
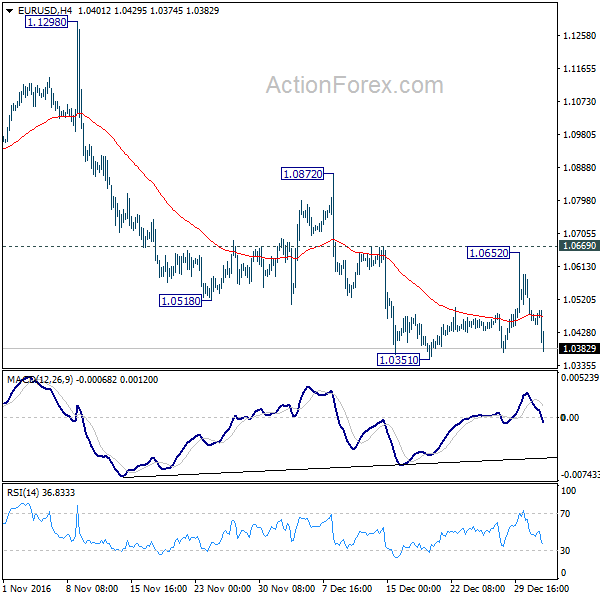
EUR/USD drops sharply today and focus is back on 1.0351 low. Break will resume the larger down trend and target parity next. In case of another recovery, we'd expect upside to be limited by 1.0669 resistance and bring down trend resumption. However, firm break of 1.0669 will argue that stronger recovery is underway back to 1.0872 resistance instead.
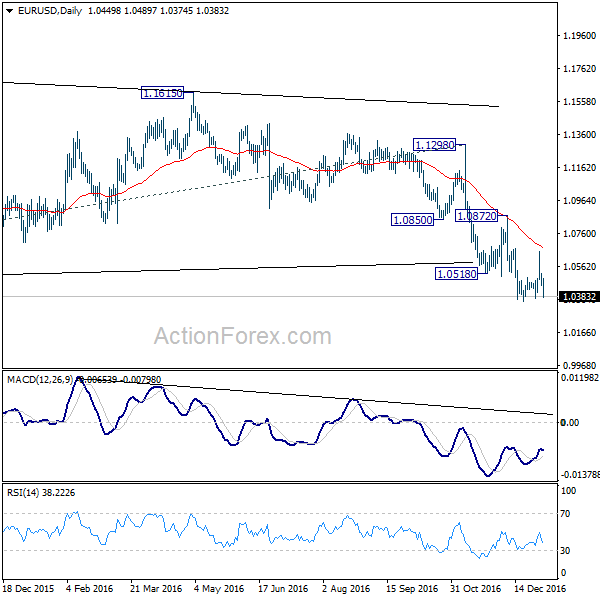
In the bigger picture, break of 1.0461 key support indicates that consolidation from there has completed as a triangle at 1.1298. And, the down trend from 1.6039 (2008 high) is resuming. Current downtrend is now expected to target 61.8% projection of 1.3993 to 1.0461 from 1.1298 at 0.9115. On the upside, break of 1.1298 resistance is needed to confirm medium term bottoming. Otherwise, outlook will stay bearish in case of rebound.
Subscribe to our daily and mid-day newsletter to get this report delivered to your mail box
Dollar Surges on Euro Weakness on Talk of Italy
Quick update: ISM manufacturing jumped to 54.7 in December, above expectation of 53.7 and hit the highest level since December 2014. Price paid surged to 65.5. Employment also improved to 53.1. Dollar index breaks recent high and hits 103.82 so far.
Dollar surges broadly today, except versus Aussie, as helped by the selloff in Euro. Dollar index reaches as high as 103.52 and is set to test recent high at 103.65. Nonetheless, Dollar bulls could stay cautious ahead of key economic data to be released this week, including Friday's non-farm payroll, as well as FOMC Minutes. Euro is weighed down by talk that Italy might eventually leave the Eurozone, and receives little help from better than expected German data. Oil price resumes rally as the agreement of OPEC and non-OPEC countries on production cut kicks start. WTI crude oil surges to 18-month high at 55.24. Gold is weighed down by the strength in dollar and dips below 1150 handle.
UK PMI manufacturing jumped to 56.1 in December, up from 53.6 and beat expectation of 56.1. That's the highest level in 30 months. Markit noted that "the UK manufacturing sector starts 2017 on a strong footing. The headline PMI hit a two-and-a-half year high in December, with rates of expansion in output and new orders among the fastest seen during the survey's 25-year history." And, "a plus point from the December survey was that the expansion was led by the investment and intermediate goods sectors, suggesting capital spending and corporate demand took the reins from the consumer in driving industrial growth forward."
Ifo head Clemens Fuest said to a German newspaper Tagesspiegel that "the standard of living in Italy is at the same level as in 2000. If that does not change, the Italians will at some stage say: 'We don't want this euro zone any more'." German unemployment dropped -17k in December, much better than expectation of -5k. Unemployment rate was unchanged at 6.0%, staying at the lowest level since the beginning of the data series back in 1992. German CPI rose 0.7% mom, 1.7% yoy in December, above expectation of 0.6% mom, 1.4% yoy. Also from Europe, Swiss SVME PMI dropped to 56.0 in December, down from 56.6, in line with consensus.
The Caixin PMI manufacturing for China rose to 51.9 in December, much better than expectation of being unchanged at 50.9. That's the best reading in three years since January 2013. Caixin noted that "a further rise in production at Chinese manufacturers supported the higher PMI reading in December. Notably, the rate of output growth accelerated to a 71-month high, with a number of panelists commenting on stronger underlying demand and new client wins." And, "data indicated that improved domestic demand was the key driver of new business growth, however, as new export sales were unchanged in December." Nonetheless, released earlier in the week, the official PMI manufacturing dropped to 51.4, down from 51.7 and below expectation of 51.6.
EUR/USD Mid-Day Outlook
Daily Pivots: (S1) 1.0449; (P) 1.0551 (R1) 1.0620; More.....
EUR/USD drops sharply today and focus is back on 1.0351 low. Break will resume the larger down trend and target parity next. In case of another recovery, we'd expect upside to be limited by 1.0669 resistance and bring down trend resumption. However, firm break of 1.0669 will argue that stronger recovery is underway back to 1.0872 resistance instead.
In the bigger picture, break of 1.0461 key support indicates that consolidation from there has completed as a triangle at 1.1298. And, the down trend from 1.6039 (2008 high) is resuming. Current downtrend is now expected to target 61.8% projection of 1.3993 to 1.0461 from 1.1298 at 0.9115. On the upside, break of 1.1298 resistance is needed to confirm medium term bottoming. Otherwise, outlook will stay bearish in case of rebound.
Economic Indicators Update
| GMT | Ccy | Events | Actual | Consensus | Previous | Revised |
|---|---|---|---|---|---|---|
| 01:45 | CNY | Caixin PMI Manufacturing Dec | 51.9 | 50.9 | 50.9 | |
| 08:30 | CHF | SVME PMI Dec | 56 | 56 | 56.6 | |
| 08:55 | EUR | German Unemployment Change Dec | -17k | -5k | -5k | |
| 08:55 | EUR | German Unemployment Rate Dec | 6.00% | 6.00% | 6.00% | |
| 09:30 | GBP | Manufacturing PMI Dec | 56.1 | 53.3 | 53.4 | 53.6 |
| 13:00 | EUR | German CPI M/M Dec P | 0.70% | 0.60% | 0.10% | |
| 13:00 | EUR | German CPI Y/Y Dec P | 1.70% | 1.40% | 0.80% | |
| 15:00 | USD | ISM Manufacturing Dec | 54.7 | 53.7 | 53.2 | |
| 15:00 | USD | ISM Prices Paid Dec | 65.5 | 55.5 | 54.5 | |
| 15:00 | USD | Construction Spending M/M Nov | 0.90% | 0.50% | 0.50% | 0.60% |
Subscribe to our daily and mid-day newsletter to get this report delivered to your mail box
Trade Idea: EUR/JPY – Buy at 122.60
EUR/JPY - 122.88
Recent wave: wave v of (C) ended at 94.12 and major correction in wave A has ended at 149.79
Trend: Sideways
New strategy :
Buy at 112.60, Target: 114.60, Stop: 112.00
Position: -
Target: -
Stop:-
Although the single currency slipped to 121.58 last week, as euro found renewed buying interest there and staged a strong rebound to 123.86, suggesting the pullback from 124.10 top has possibly ended there and consolidation with upside bias is seen, break of 123.86 would add credence to this view, bring retest of 124.10 but above there is needed to confirm recent upmove has resumed in wave v of larger degree wave iii to 124.40-50, then towards 125.00.
In view of this, we are looking to reinstate long on dips. Below 122.00 would defer and risk another test of said support at 121.58 but break there is needed to signal temporary top has been formed, bring retracement of recent upmove to 121.10-20 and possibly test of support at 120.91.
Our latest preferred count is that wave (ii) is ABC-X-ABC which ended at 123.33 and wave (iii) is unfolding with wave iii ended at 100.77, followed by wave iv at 111.57 and wave v as well as the wave (iii) has ended at 97.04, followed by wave (iv) at 111.43 and wave (v) has ended at 94.12 which is also the end of the larger degree v, this also implied the major wave (C) has also ended there, hence major correction has commenced from there with (A) leg unfolding in its lower degree wave c which has possibly ended at 145.69. Under this count, A-B-C wave (B) has commenced with A leg ended at 136.23, wave B at 143.79 and wave C has possibly ended at 149.79.
Our larger degree count is that the decline from 139.26 is wave (C) and is sub-divided into a diagonal triangle i-ii-iii-iv-v with wave i - 105.44, wave ii- 123.33, wave iii - 97.03, wave iv - 111.43, followed by the final wave v as well as the end of wave (C) at 94.12, this also mark the bottom of larger degree wave B. Under this count, major rise in wave C has commenced as an impulsive wave with minor wave III ended at 145.69, wave V is still in progress for further gain to 150.00. Having said that, this so-called wave V could well be the first leg of larger degree 5-waver wave C and this wave C should bring at least a retest of wave A top at 169.97 (July 2008).

Trade Idea: AUD/USD – Sell at 0.7300
AUD/USD – 0.7200
Recent wave: Wave 5 ended at 1.1081 and major correction has commenced for fall to 0.7000 and then towards 0.6500-10
Trend: Sideways
Original strategy :
Sell at 0.7340, Target: 0.7140, Stop: 0.7400
Position: -
Target: -
Stop: -
New strategy :
Sell at 0.7300, Target: 0.7100, Stop: 0.7360
Position: -
Target: -
Stop:-
As aussie recovered after holding above last week's low at 0.7158, suggesting further consolidation above this level would be seen and test of resistance at 0.7247 (last week's high) cannot be ruled out, however, reckon upside would be limited to 0.7295-00 (38.2% Fibonacci retracement of 0.7525-0.7158) and bring another decline. A break of said support at 0.7158 would extend recent decline in wave (C) to 0.7100-10, however, loss of downward momentum should prevent sharp fall below 0.7070 and reckon psychological support at 0.7000 would hold from here, bring rebound later.
In view of this, we are looking to sell aussie on recovery as 0.7295-00 should limit upside, bring another decline. Above 0.7340-45 (50% Fibonacci retracement of 0.7525-0.7158) would defer and risk a stronger rebound to 0.7385 (61.8% Fibonacci retracement) but still reckon price would falter below 0.7430-35 and bring another selloff.
On the 4-hour chart, the move from 0.8066 is the wave 5 with i: 0.8860, ii: 0.8315, wave iii is an extended move ended at 1.0183, iv: 0.9706 and wave v has ended at 1.1081 (also the top of entire wave 5). The subsequent selloff is the major correction which is unfolding as ABC-X-ABC and 2nd A leg has ended at 0.8848, followed by a-b-c wave B which ended at 0.9758, hence, 2nd C wave is now in progress and indicated downside target at 0.7000 and 0.6950 had been met, so further fall to 0.6710-20 cannot be ruled out.

EUR/USD Candlesticks and Ichimoku Analysis
Weekly
- Last Candlesticks pattern: Shooting star
- Time of formation: 03 May 2016
- Trend bias: Down
Daily
- Last Candlesticks pattern: Shooting star
- Time of formation: 3 May 2016
- Trend bias: Sideways
EUR/USD – 1.0405
Although the single currency staged another strong rebound last week to 1.0654, renewed selling interest emerged there and euro has dropped again, suggesting the rebound from 1.0352 (last month's low) has ended there, hence bearishness remains for test of 1.0372 support but break there is needed to add credence to this view, bring retest of said recent low at 1.0352 but break there is needed to confirm recent downtrend has resumed for further fall to 1.0300 and later towards 1.0200 which is likely to hold from here.
On the upside, whilst initial recovery to 1.0490-00 cannot be ruled out, reckon upside would be limited to 1.0550-55 and bring another decline later. Above the Kijun-Sen (now at 1.0612) would defer and risk another test of said resistance at 1.0654 but only a daily close above there would defer and suggest a temporary low is formed, bring retracement of recent decline to 1.0710-15 (38.2% Fibonacci retracement of 1.1300-1.0352), then towards 1.0820-30 (50% Fibonacci retracement) but price should falter below resistance at 1.0873.
Recommendation: Sell again at 1.0550 for 1.0300 with stop above 1.0650.

On the weekly chart, although the single currency recovered to 1.0654 last week, euro met resistance there and has fallen again, retaining our bearishness for early downtrend to extend further weakness, break of 1.0352 support would bring subsequent fall to 1.0220-30 (1.618 times projection of 1.1616-1.0912 measuring from 1.1366) and later 1.0150 but near term oversold condition should prevent sharp fall below latter level and reckon psychological support at 1.000 would remain intact.
On the upside, expect recovery to be limited to 1.0470-80 and 1.0550-60 should limit upside, bring another decline. Above 1.0592 resistance would risk test of last week's high at 1.0654 but break there is needed to signal a temporary low is formed, bring retracement of recent decline to 1.0710-15 (38.2% Fibonacci retracement of 1.1300-1.0352), then towards 1.0820-30 (50% Fibonacci retracement) but upside should be limited to the Kijun-Sen (now at 1.0859) and price should falter below resistance at 1.0873.
