
Sample Category Title
US Consumer Confidence surges to 108.7 in Oct, strong labor market and income optimism
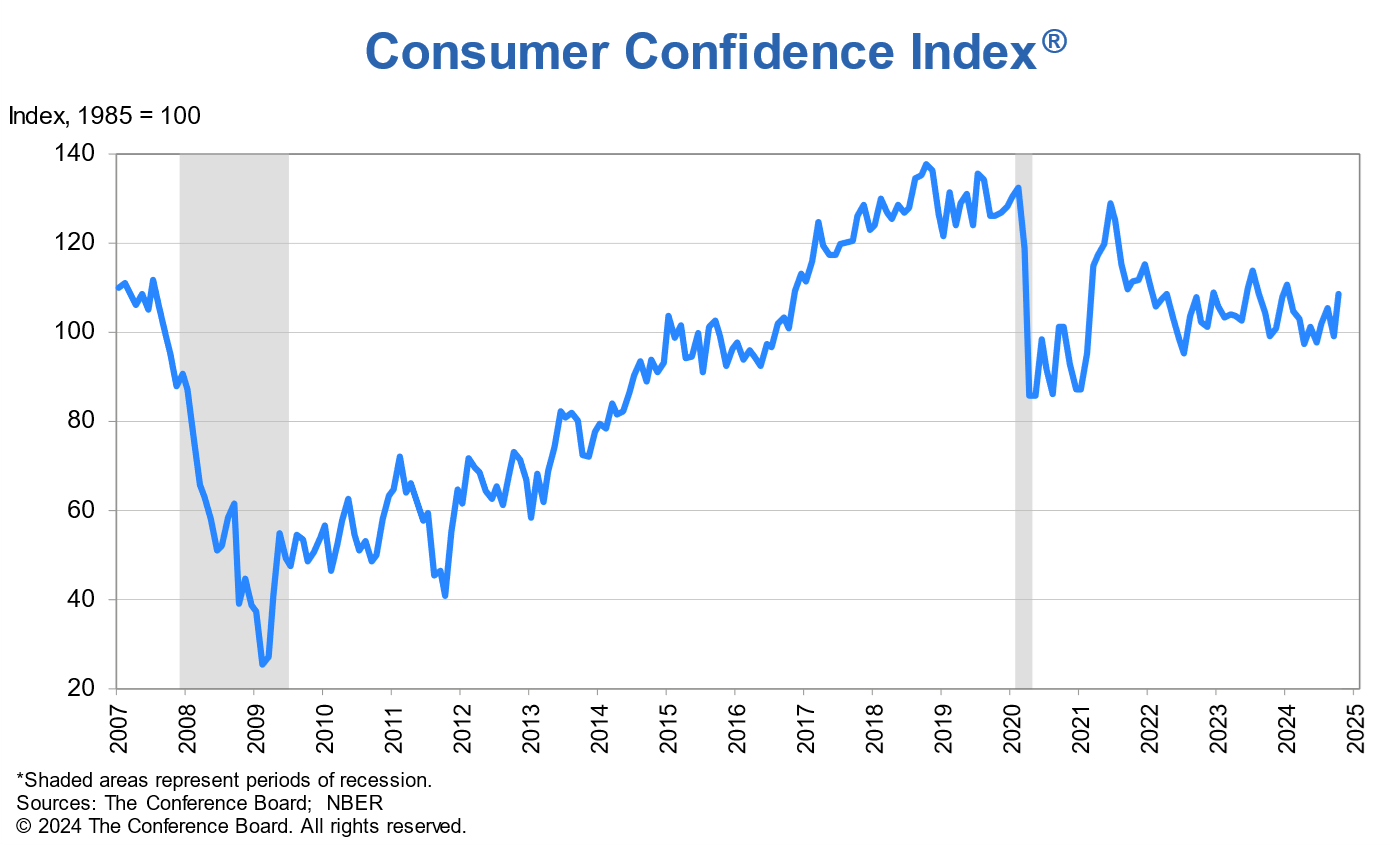
US Conference Board Consumer Confidence Index rose sharply from 99.2 to 108.7 in October, significantly surpassing the expected 98.9 and marking the highest monthly gain since March 2021. Although this increase keeps the index within its two-year range, it reflects a notable boost in consumer sentiment driven by improving views on the economy and labor market.
Present Situation Index, a gauge of consumers’ perceptions of current economic conditions, climbed 14.2 points to 138.0, highlighting a strong rebound in how Americans view the job market and business environment.
Additionally, Expectations Index rose 6.3 points to 89.1, moving well above the recession-warning threshold of 80, indicating that consumers are increasingly positive about future economic conditions.
Dana M. Peterson, Chief Economist at The Conference Board, noted that October’s data saw improvements across all five components of the index. Consumers reported a more positive assessment of business conditions, reflecting recent labor market strength. Views on current job availability also improved, suggesting renewed optimism in employment prospects. Notably, consumers expressed greater optimism about future business conditions and income expectations, and for the first time since July 2023, showed cautious optimism regarding future job availability.
EUR/USD Mid-Day Outlook
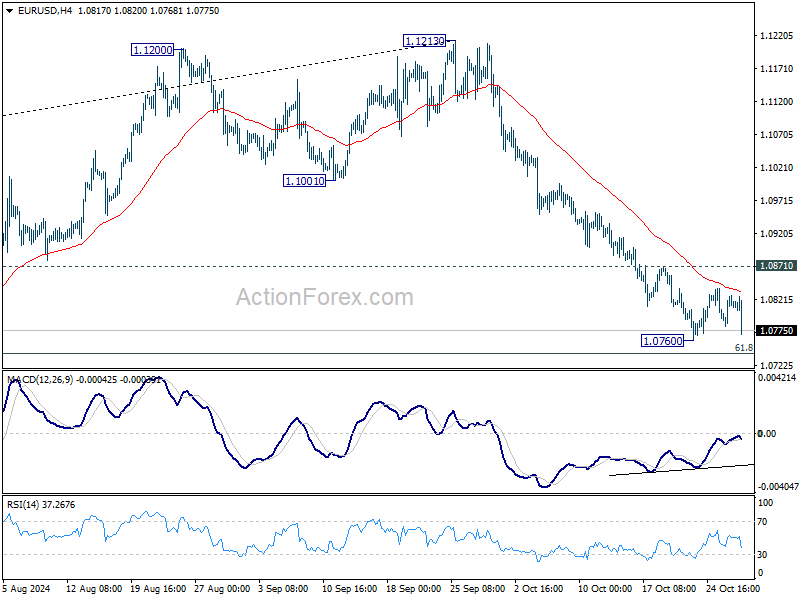
Daily Pivots: (S1) 1.0787; (P) 1.0807; (R1) 1.0833; More...
EUR/USD falls notably after rejection by 55 4H EMA (now at 1.0832), but stays above 1.0760 temporary low. Intraday bias remains neutral first. Further decline is expected as long as 1.0871 resistance holds. Below 1.0760 will target 61.8% retracement of 1.0447 to 1.1213 at 1.0740. Firm break there will target 1.0601 support next. However, considering bullish convergence condition in 4H MACD, break of 1.0871 will indicate short term bottoming, and turn bias back to the upside for 55 D EMA (now at 1.0956).
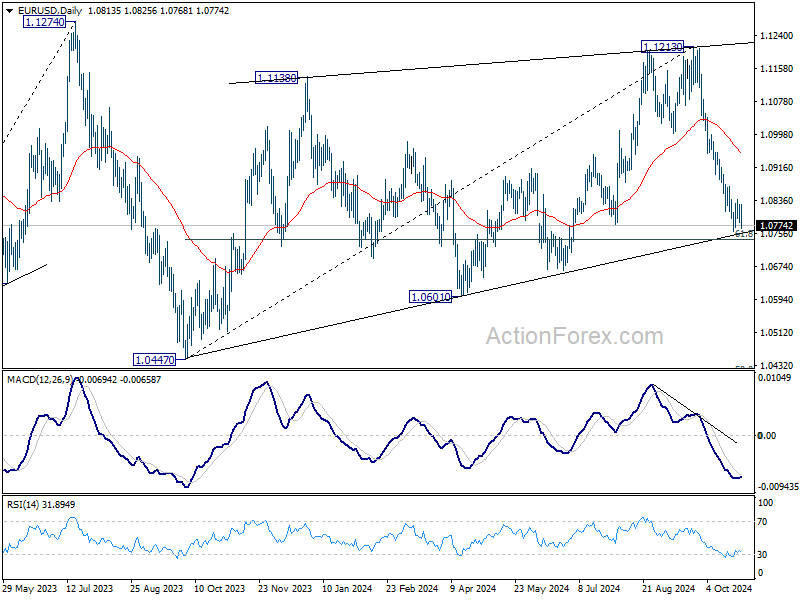
In the bigger picture, price actions from 1.1274 (2023 high) are seen as a consolidation pattern to up trend from 0.9534 (2022 low), with fall from 1.1213 as the third leg. Downside should be contained by 50% retracement of 0.9534 (2022 low) to 1.1274 at 1.0404, to bring up trend resumption at a later stage.
GBP/USD Mid-Day Outlook
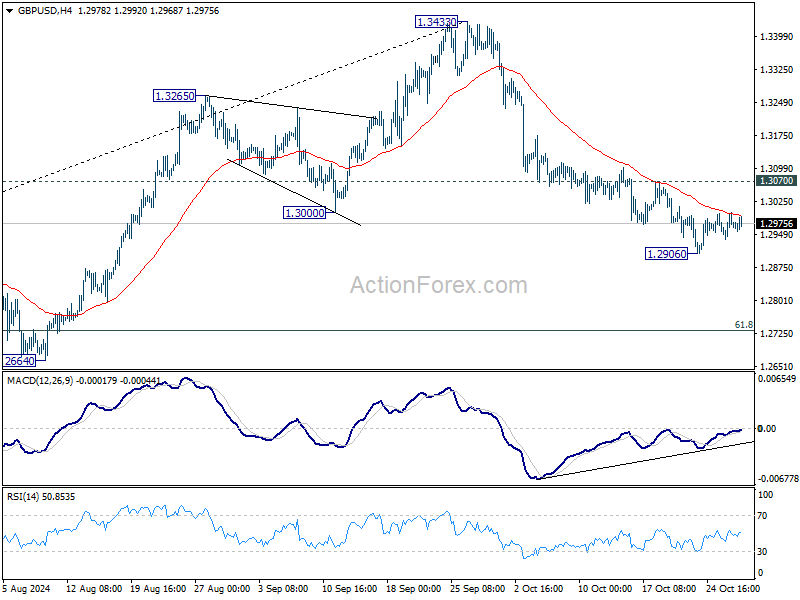
Daily Pivots: (S1) 1.2940; (P) 1.2971; (R1) 1.3001; More...
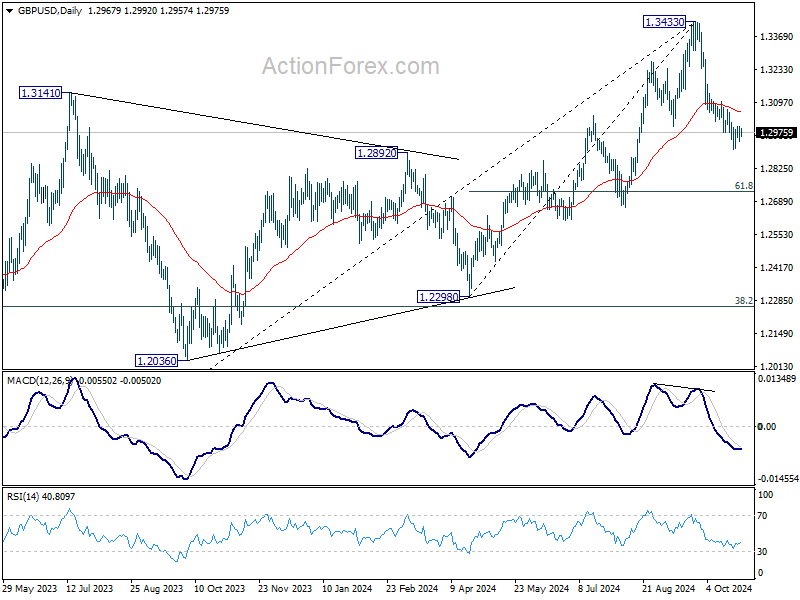
GBP/USD is still bounded in consolidation above 1.2906 and intraday bias stays neutral. Further decline is expected as long as 1.3070 minor resistance holds. Below 1.2906 will target 61.8% retracement of 1.2298 to 1.3433 at 1.2732. However, considering bearish divergence condition in 4H MACD, firm break 1.3070 resistance will indicate short term bottoming, and turn bias back to the upside for stronger rebound.
In the bigger picture, considering mildly bearish divergence condition in D MACD, a medium term top is likely in place at 1.3433 already. Price actions from there are seen as correction to whole up trend from 1.0351 (2022 low). Deeper decline would be seen to 38.2% retracement of 1.0351 to 1.3433 at 1.2256, which is close to 1.2298 structural support. Strong support should be seen there to bring rebound.
USD/JPY Mid-Day Outlook
Daily Pivots: (S1) 152.51; (P) 153.20; (R1) 153.98; More...
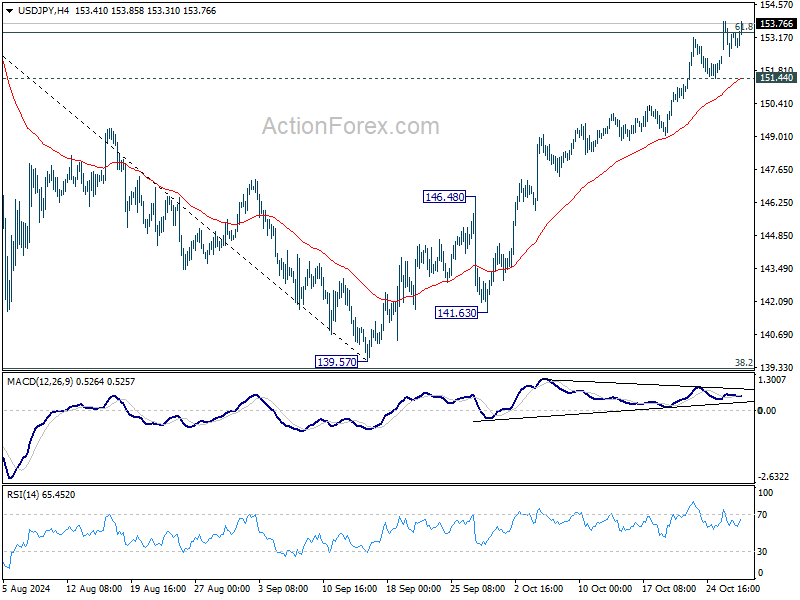
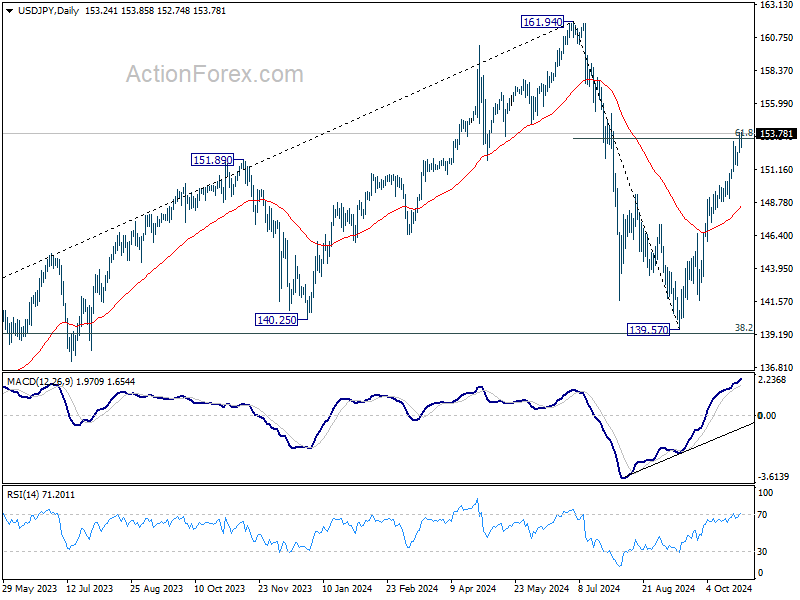
Intraday bias in USD/JPY remains on the upside as rise from 139.57 is in progress. Sustained trading above 61.8% retracement of 161.94 to 139.57 at 153.39 will pave the way to retest 161.94 high. On the downside, below 151.44 minor support will turn intraday bias neutral again first.
In the bigger picture, price actions from 161.94 are seen as a corrective pattern to rise from 102.58 (2021 low). The range of medium term consolidation should be set between 38.2% retracement of 102.58 to 161.94 at 139.26 and 161.94. Nevertheless, sustained break of 139.26 would open up deeper medium term decline to 61.8% retracement at 125.25.
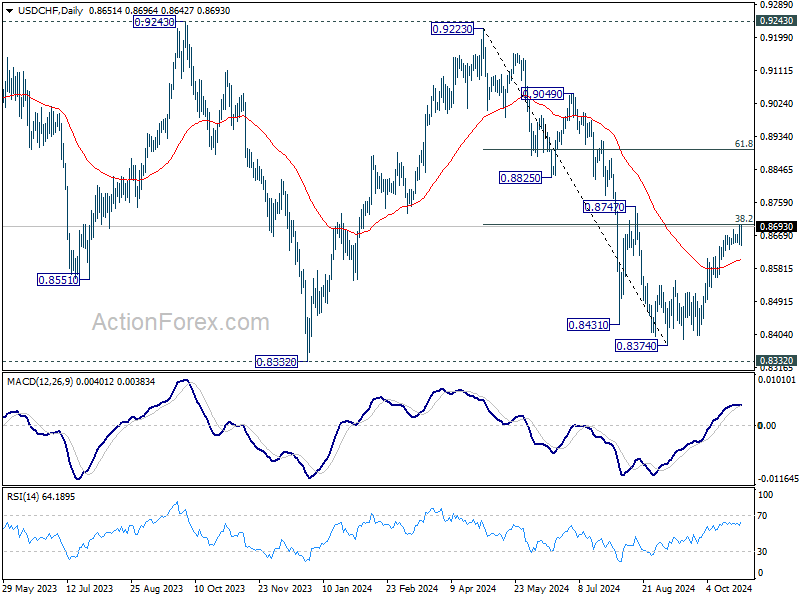
USD/CHF Mid-Day Outlook
Daily Pivots: (S1) 0.8633; (P) 0.8667; (R1) 0.8686; More…
USD/CHF rebounded strongly after drawing support from 55 4H EMA (now at 0.8649), but stays below 0.8699 temporary top. Intraday bias remains neutral first. Further rally remains in favor as long as 55 D EMA (now at 0.8603) holds. On the upside, decisive break of 38.2% retracement of 0.9223 to 0.8374 at 0.8698 will argue that fall from 0.9223 has completed after defending 0.8332 low. Further rally should then be seen to 61.8% retracement at 0.8899 next.
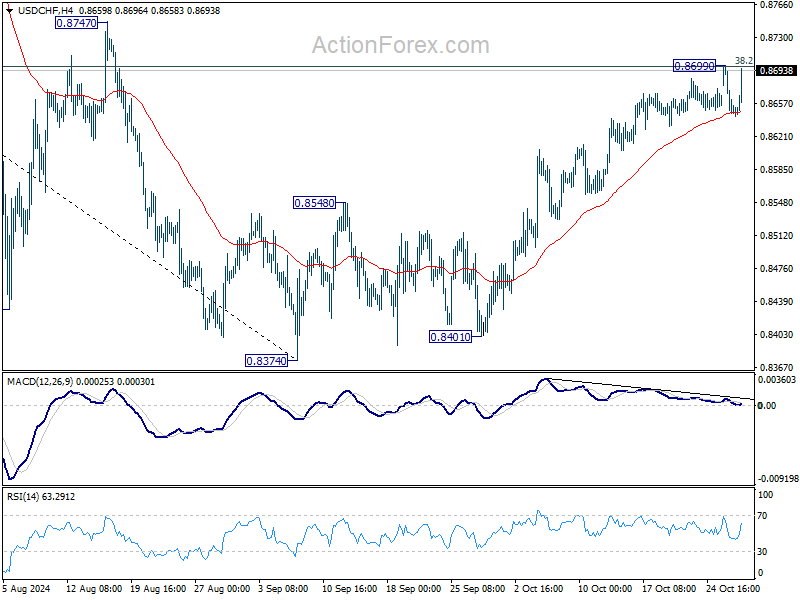
In the bigger picture, price actions from 0.8332 (2023 low) are currently seen as a medium term corrective pattern, with fall from 0.9223 as the second leg. Strong support could be seen from 0.8332 to bring rebound. Yet, overall outlook will continue to stay bearish as long as 0.9243 resistance holds. Firm break of 0.8332, however, will resume larger down trend from 1.0146 (2022 high).
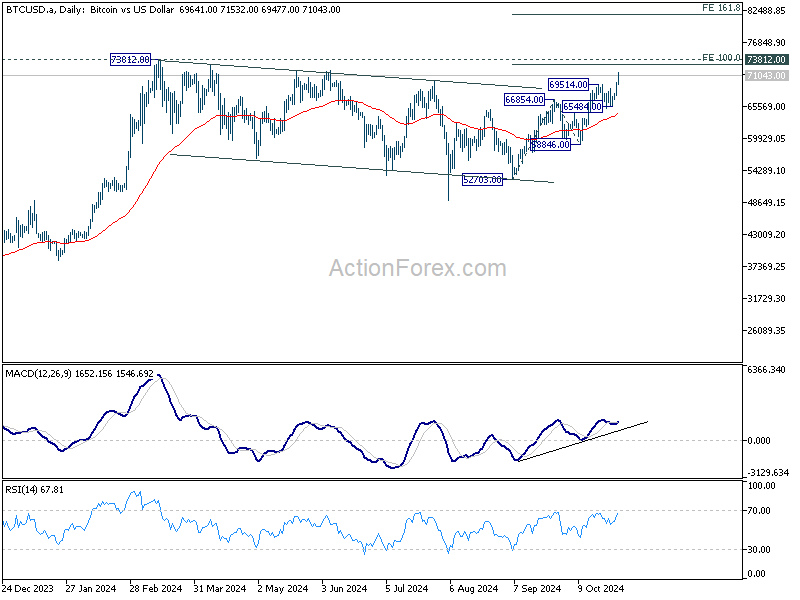
Dollar Gains as Bond Yields Surge, Bitcoin Breaks Above 70K on Post-Election Hopes
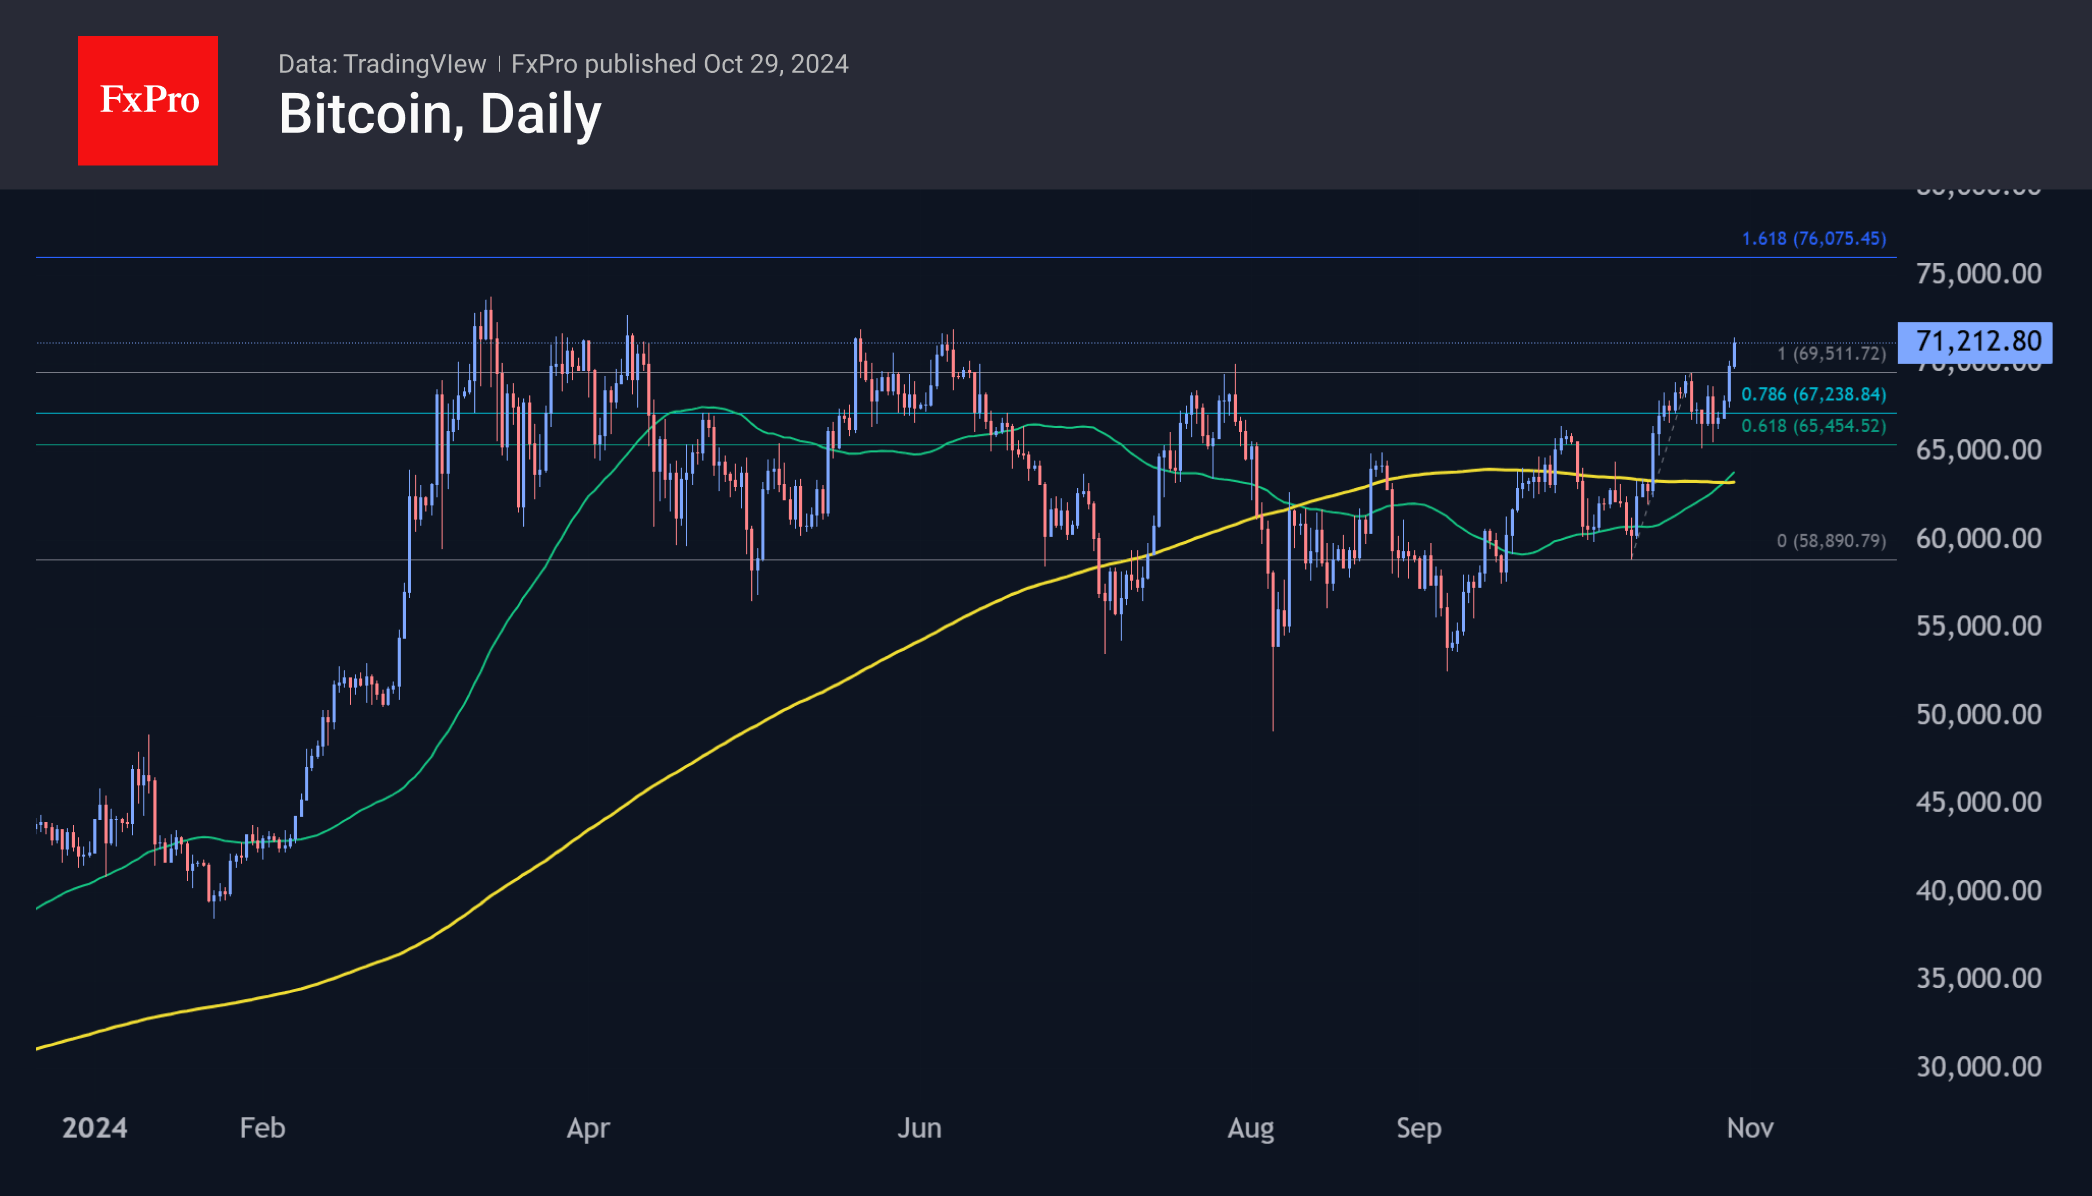
Dollar extended its broad gains today, bolstered by the jump in US 10-year Treasury yield, which surpassed 4.3% as expectations grow for an expansive fiscal agenda following the US presidential election. In parallel, Bitcoin has surged past 70K for the first time since June, driven by speculation that post-election developments could accelerate efforts to expand the US cryptocurrency market and clear regulatory paths for broader crypto adoption.
Amid Dollar’s rally, British Pound stands out as the only major currency to hold resilient. In contrast, Australian Dollar and Swiss Franc are today’s weakest performers. For Aussie, traders are eyeing tomorrow’s crucial CPI data, hoping for progress in disinflation that would support RBA’s shift towards a more neutral stance on inflation. Yen remains weak, with a close watch on whether Japanese officials might intervene if USD/JPY nears the next psychological level at 155.
Technically, further rally is expected in Bitcoin as long as 69514 resistance turned support holds. Decisive break of 73812 high will confirm long term up trend resumption. Next near term target will be 100% projection of 52703 to 66854 from 58846 at 81742.
In Europe, at the time of writing, FTSE is down -0.15%. DAX is up 0.18%. CAC is up 0.19%. UK 10-year yield is up 0.039 at 4.303. Germany 10-year yield is up 0.048 at 2.338. Earlier in Asia, Nikkei rose 0.77%. Hong Kong HSI rose 0.49%. China Shanghai SSE fell -1.08%. Singapore Strait Times rose 0.18%. Japan 10-year JGB yield rose 0.0021 to 0.977.
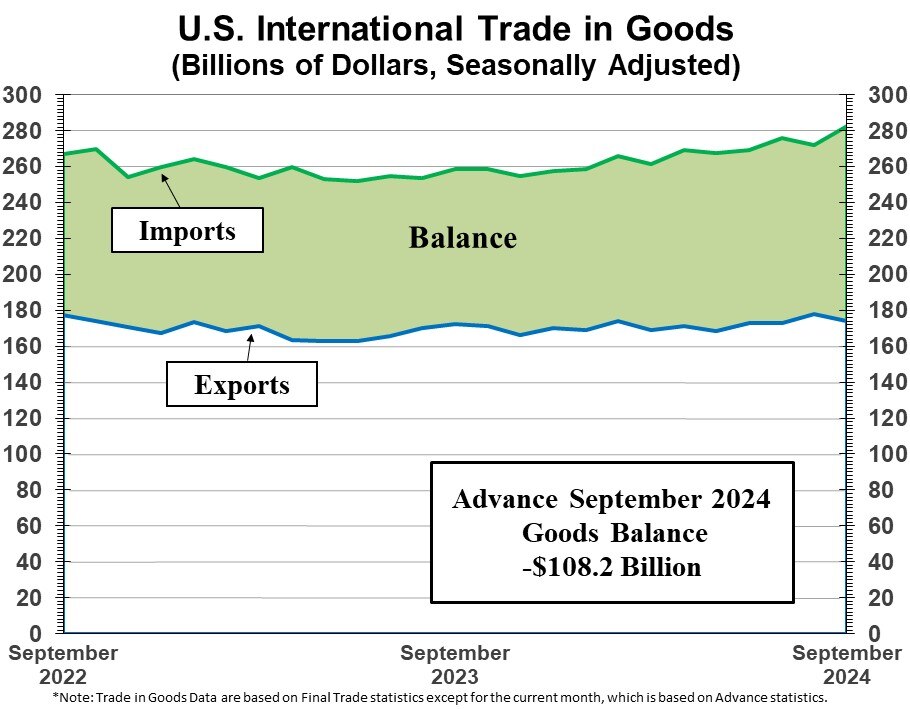
US goods trade deficit widens to USD -108.2B vs exp USD -96.1B
US goods exports fell USD -3.6B or -0.2% mom to USD 174.2B in September. Goods imports rose USD 10.4B or 3.8% mom to USD 282.4B. Trade deficit widened from USD -94.2B to USD -108.2B, larger than expectation of USD -96.1B.
Wholesale inventories fell -0.1% mom to USD 905.0B. Retail inventories rose 0.8% mom to USD 824.3B.
Germany’s Gfk consumer sentiment rises to -18.3, remains fragile
Germany’s GfK Consumer Climate index for November improved from -21.0 to -18.3, exceeding forecast of -20.5 and marking its highest level since April 2022. However, the underlying sentiment remains subdued, as economic expectations continued to trend downward for the third consecutive month, dropping -0.5 to -0.2, the lowest level since March.
Rolf Bürkl, consumer expert at the NIM, cautioned that while consumer sentiment has improved, it remains historically low due to persistent uncertainties driven by "crises, wars and rising prices".
He noted that rising company insolvencies, job cut plans, and discussions around shifting production abroad are "preventing a more significant recovery in consumer sentiment."
Japan’s unemployment rate falls to 2.4%, job availability remains strong
Japan’s unemployment rate fell from 2.5% to 2.4% in September, below expectations of 2.5%.
While the total number of employed individuals declined slightly by -0.1% to seasonally adjusted 67.82m, the number of unemployed fell -2.3% to 1.68m, marking the second consecutive monthly decrease.
Additionally, job availability ratio rose 0.01 to 1.24, meaning there were 124 job openings for every 100 job seekers, reflecting strong demand for labor.
USD/CHF Mid-Day Outlook
Daily Pivots: (S1) 0.8633; (P) 0.8667; (R1) 0.8686; More…
USD/CHF rebounded strongly after drawing support from 55 4H EMA (now at 0.8649), but stays below 0.8699 temporary top. Intraday bias remains neutral first. Further rally remains in favor as long as 55 D EMA (now at 0.8603) holds. On the upside, decisive break of 38.2% retracement of 0.9223 to 0.8374 at 0.8698 will argue that fall from 0.9223 has completed after defending 0.8332 low. Further rally should then be seen to 61.8% retracement at 0.8899 next.
In the bigger picture, price actions from 0.8332 (2023 low) are currently seen as a medium term corrective pattern, with fall from 0.9223 as the second leg. Strong support could be seen from 0.8332 to bring rebound. Yet, overall outlook will continue to stay bearish as long as 0.9243 resistance holds. Firm break of 0.8332, however, will resume larger down trend from 1.0146 (2022 high).
US goods trade deficit widens to USD -108.2B vs exp USD -96.1B
US goods exports fell USD -3.6B or -0.2% mom to USD 174.2B in September. Goods imports rose USD 10.4B or 3.8% mom to USD 282.4B. Trade deficit widened from USD -94.2B to USD -108.2B, larger than expectation of USD -96.1B.
Wholesale inventories fell -0.1% mom to USD 905.0B. Retail inventories rose 0.8% mom to USD 824.3B.
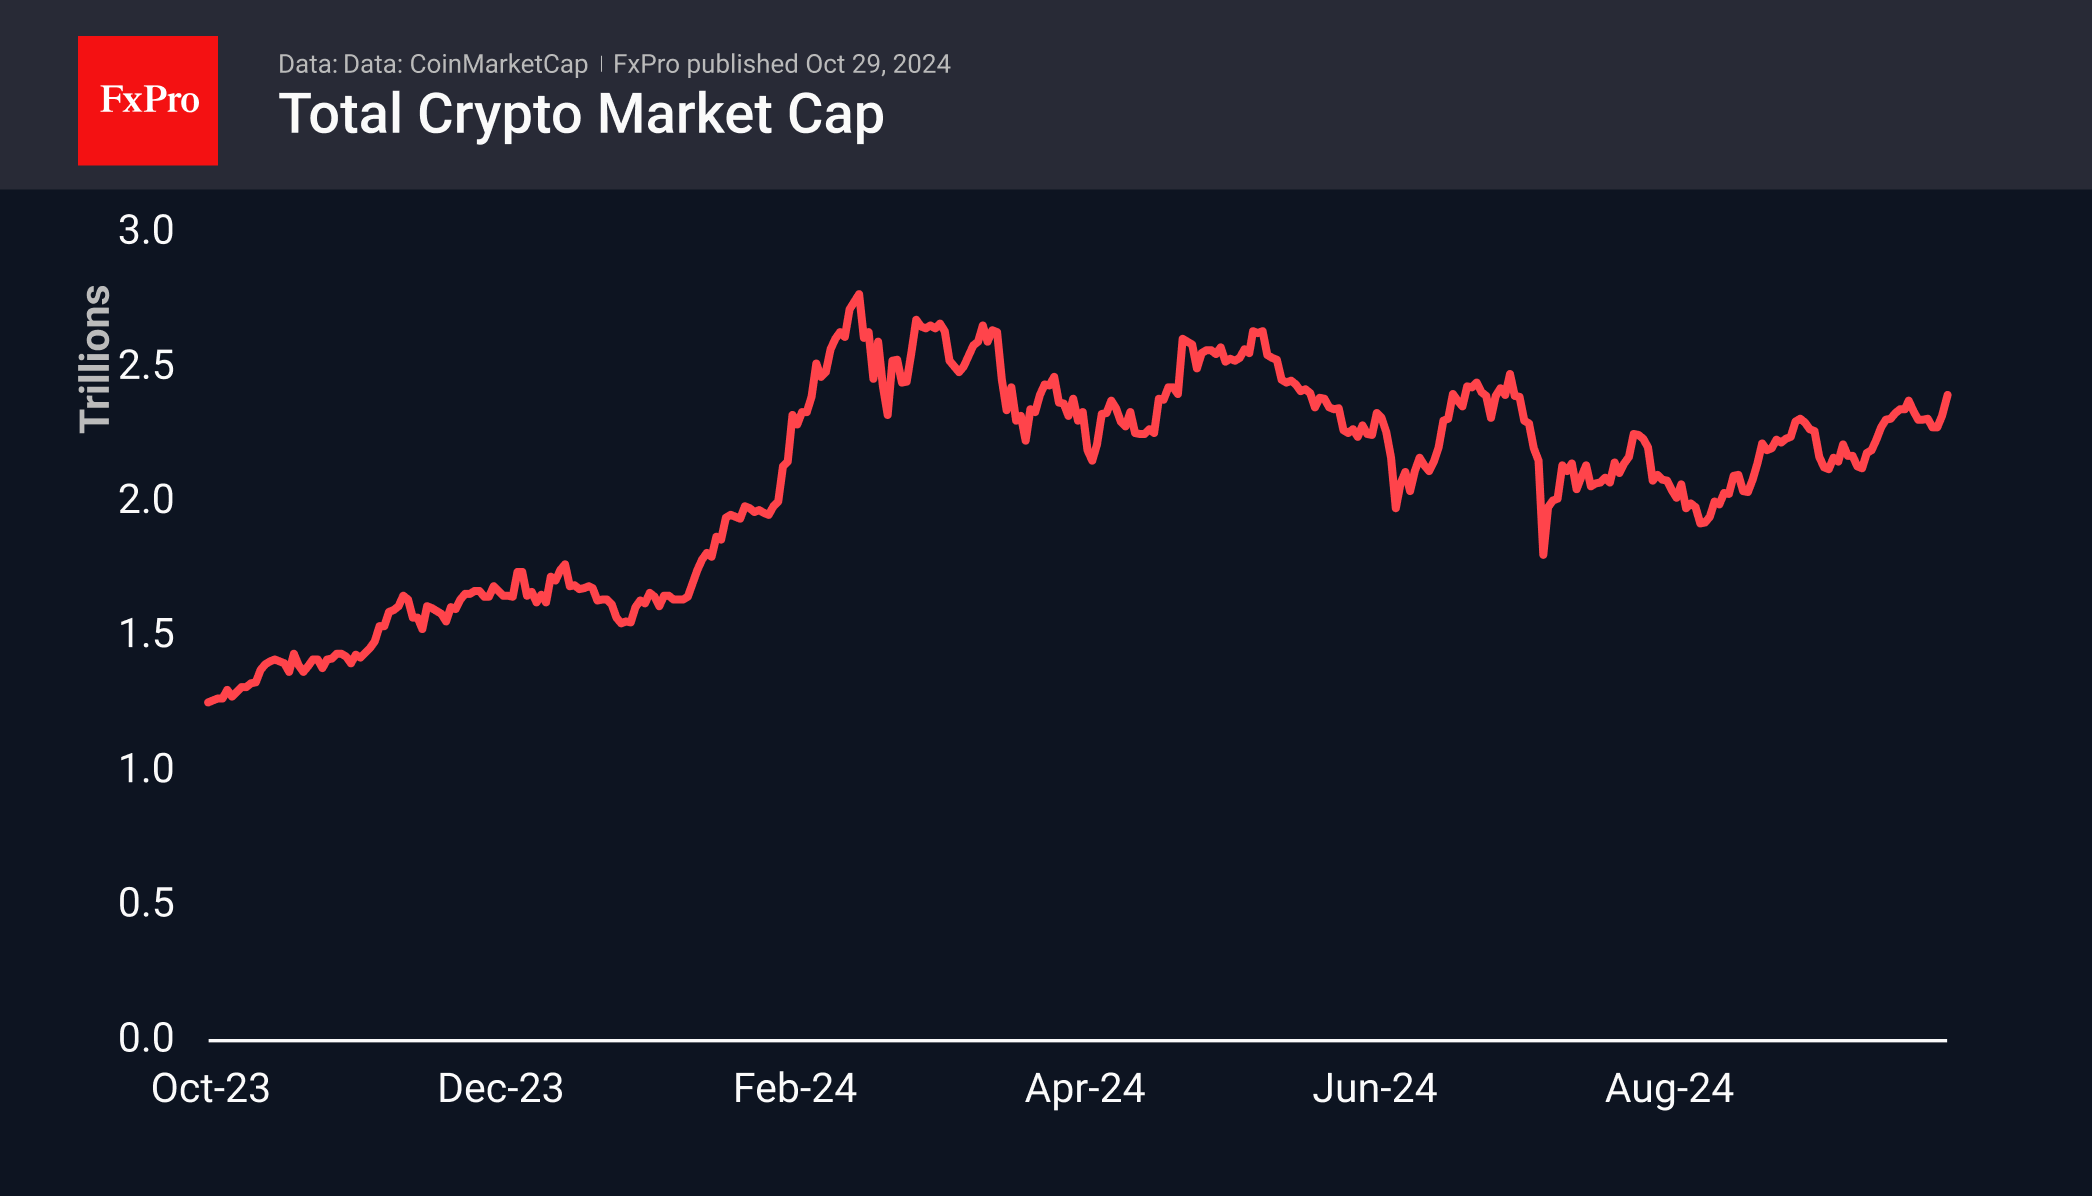
Bitcoin’s Bullish Breakout
Market Picture
The crypto market cap rose by 4.7% to $2.4 trillion in the last 24 hours, supported by a surge in top coins. These are the market’s highest levels since late July. Back then, the market stalled around these levels and soon turned lower. This time, the trend is more bullish, as the market has been in an uptrend since early September.
With a gain of around 5%, Bitcoin is generally moving with the market, behind Ethereum’s 5.5% rise, Doge’s 16% jump and Bitcoin Cash’s 10% rise. However, with a price close to $71K, BTCUSD is less than 4% below its all-time high. The first cryptocurrency has spent less than 72 hours in total above its current level.
Technically, Bitcoin has given several bullish signals, from the ‘golden cross’ on 27 October to breaking above previous highs and entering a Fibonacci extension pattern.
News Background
According to CoinShares, global crypto fund investments increased by $901 million last week, following inflows of $2.199 billion the week before. Investments in Bitcoin increased by $920 million, while Solana increased by $11 million, and Ethereum decreased by $35 million. Investments in multi-asset crypto funds increased by $2 million.
The ETF Store noted that spot Bitcoin ETFs bought nearly 977,000 BTC ($67 billion), representing nearly 5% of available issuance. If such accumulation rates continue, a repeat of BTC’s record highs is inevitable.
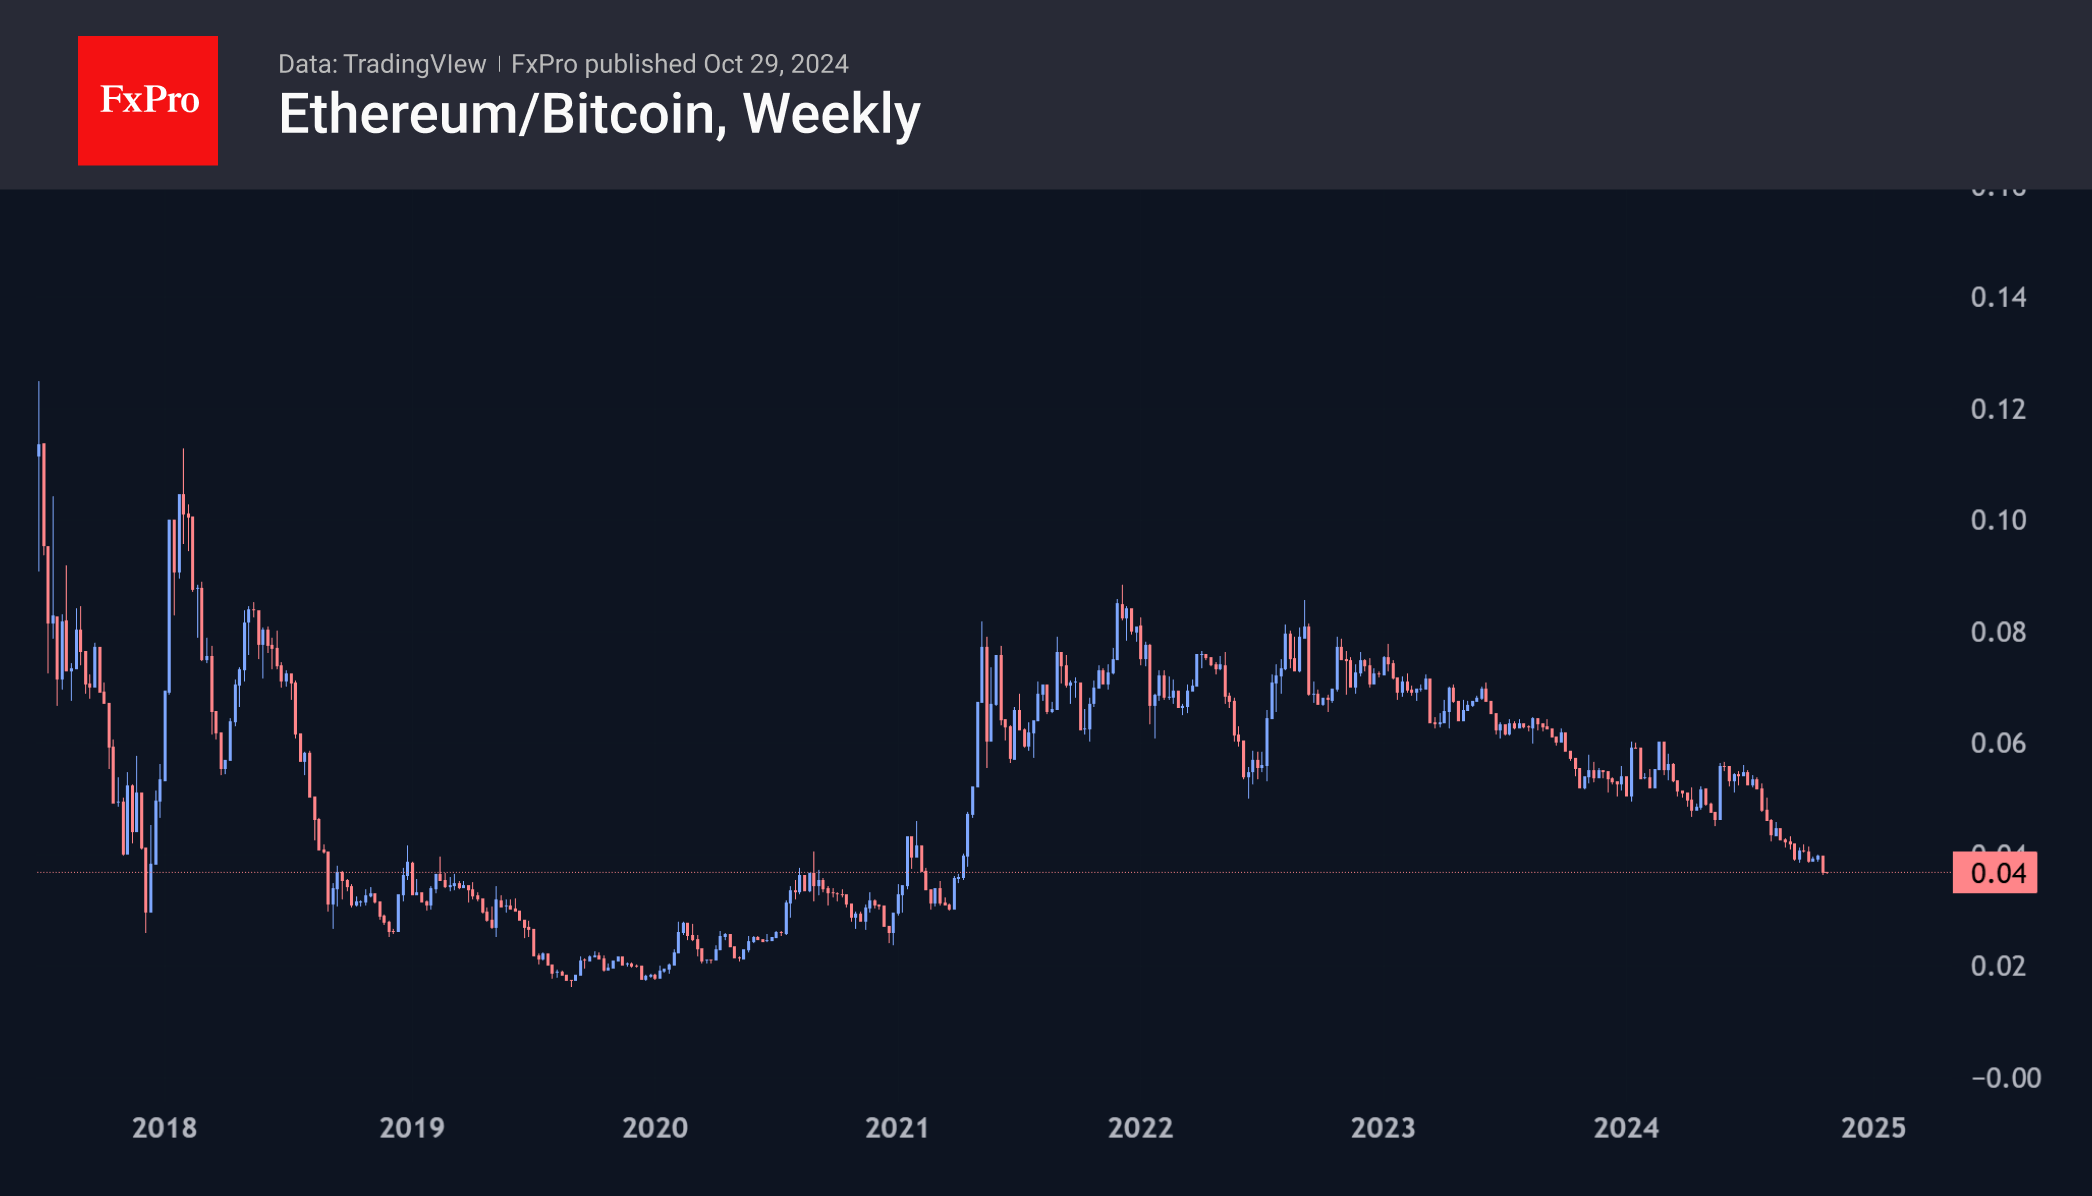
The Ethereum (ETH) to Bitcoin (BTC) exchange rate has hit a 3.5-year low. Since the beginning of the year, the leading altcoin has fallen 30.5% against the first cryptocurrency.
The crypto market cap has risen to $2.4 trillion, its highest since July. Bitcoin is close to its all-time high, and bullish signals are being observed. Global crypto fund investments have also increased, particularly in bitcoin.
Ethereum co-founder Vitalik Buterin cited volume bloat and the blockchain’s increasing complexity over time as some of the network’s main problems.
Bitcoin is cementing its status as a safe-haven asset against inflation, said billionaire Chamath Palihapitiya, founder of venture capital firm Social Capital. He believes the first cryptocurrency has the potential to replace gold as a rational economic safety net.
The bankrupt FTX has withdrawn its lawsuit against Bybit as part of a settlement that will generate about $228 million for future creditor compensation.
Nasdaq 100 Consolidates Ahead of Major Market Leader Earnings Reports
This week, five companies with market capitalisations exceeding $1 trillion are set to release their quarterly earnings:
→ Alphabet (GOOGL) on October 29
→ Microsoft (MSFT) on October 30
→ Meta Platforms (META) on October 30
→ Apple (AAPL) on October 31
→ Amazon (AMZN) on October 31
These results and profit forecasts from leading tech giants could fuel momentum for the Nasdaq 100 (US Tech 100 mini on FXOpen).
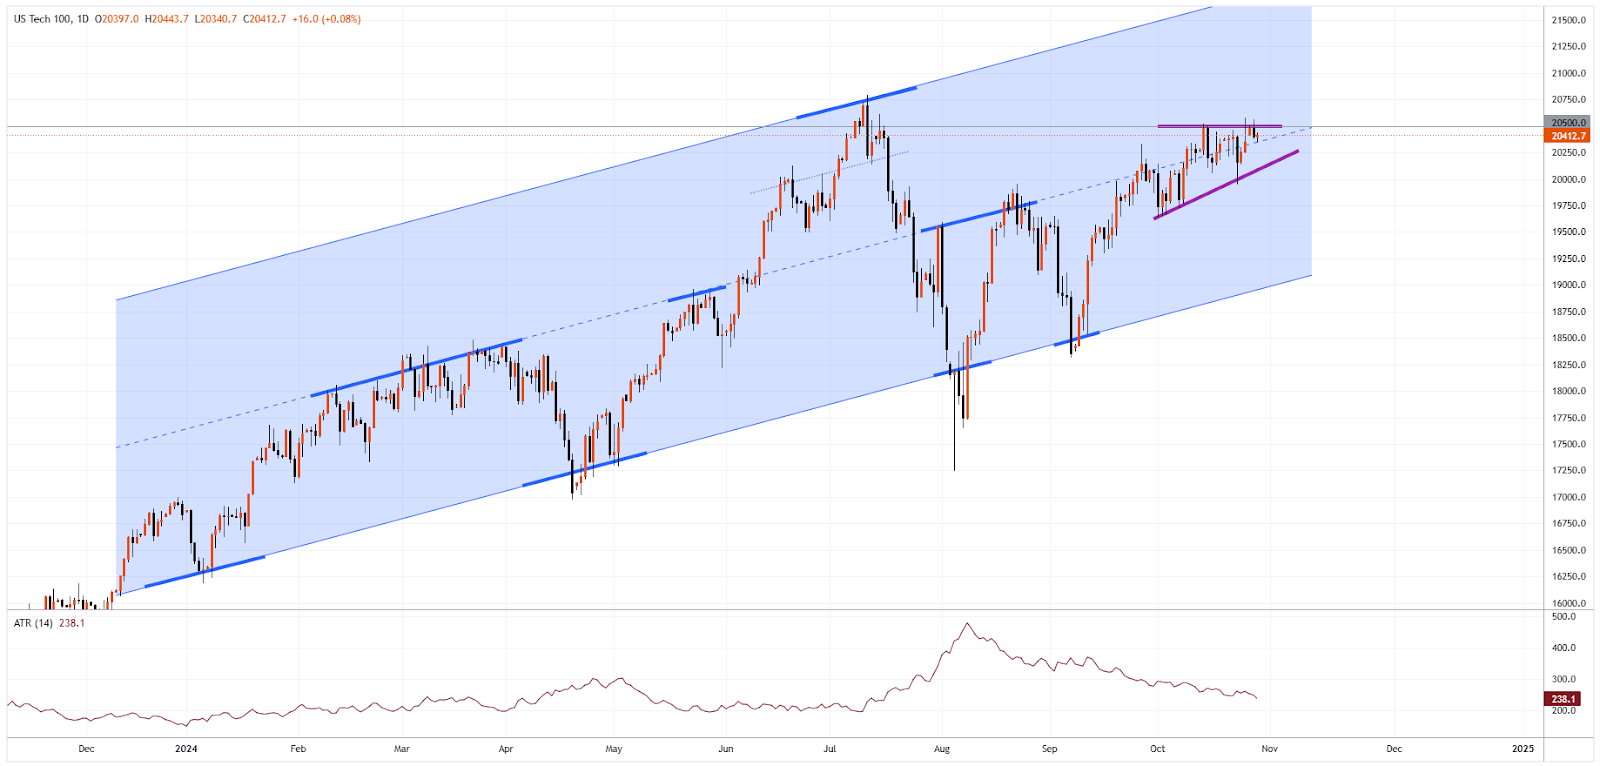
For now, technical analysis of the Nasdaq 100 (US Tech 100 mini on FXOpen) chart suggests the index is in a state of consolidation. Supporting this view:
→ The blue upward channel, based on key 2024 reversals (marked with bold lines), shows price movement near the channel median, indicating a potential balance between supply and demand.
→ A narrowing triangle formation (highlighted by purple lines, with the upper line aligning with the psychological level of 20,500) reflects a reduction in volatility, signalling consolidation in anticipation of the earnings releases.
→ A decline in the ATR indicator, reaching its lowest in approximately 3.5 months, also suggests subdued market activity.
If these tech earnings surprise to the upside, it’s possible the Nasdaq 100 (US Tech 100 mini on FXOpen) could break out of the purple triangle, setting its sights on a fresh all-time high, surpassing the previous peak from July 11.
Trade global index CFDs with zero commission and tight spreads. Open your FXOpen account now or learn more about trading index CFDs with FXOpen.
This article represents the opinion of the Companies operating under the FXOpen brand only. It is not to be construed as an offer, solicitation, or recommendation with respect to products and services provided by the Companies operating under the FXOpen brand, nor is it to be considered financial advice.
Gold (XAU/USD) Price Reclaims $2750/oz Amid Record $3 Billion Inflows into Gold Funds
- Gold prices surge past $2750 per ounce on record inflows into gold funds. Gold ETFs saw a massive $3 billion investment last week, the second-largest increase ever.
- Year-to-date gains for gold are at 33%, setting the stage for its best year since 1979.
- Despite a strong US dollar, gold’s rally remains unfazed, with safe-haven appeal outweighing dollar strength amid rising global uncertainties. This trend looks set to continue.
Gold prices have smashed through the 2750 handle once more following a drop over the weekend. Following the weekend, Gold opened around 2732 before moving higher to within striking distance of the all-time highs.
The safe haven appeal appears to have returned following comments yesterday by Iranian authorities that they have the right to respond to the Israeli response over the weekend. The comments seem to have reignited the appetite of market participants for the precious metal.
Gold ETF flows are another reason that could explain the resilience of the precious metal since the weekend. According to data, gold funds received about $3 billion in new investments last week, making it the second-largest increase ever. This is more than three times the usual amount seen in recent weeks. This is continuing a trend which started during the summer months following a brief lull in demand.
The ETF and Gold fund flows have helped the precious metal maintain its gains for the year, which stands at around 33% YTD. This leaves the precious metal on course for its best year since 1979 at a time when Central Banks continue to increase their Gold holdings as well.
There is a barrage of US data on the docket this week which could affect Gold prices. However, recent data releases have proven that despite a strong US Dollar the Gold rally seems unfazed at present. Safe haven demand appears to be outweighing any sustained US Dollar strength as global uncertainties continue to pile up.
Technical Analysis Gold (XAU/USD)
From a technical analysis standpoint, Gold does need a daily candle close above the 2750 handle which has proved elusive thus far. A daily candle close above 2750 should embolden Gold bulls and facilitate a push toward the $2800 handle and print fresh all-time highs.
GOLD (XAU/USD) Daily Chart, October 29, 2024
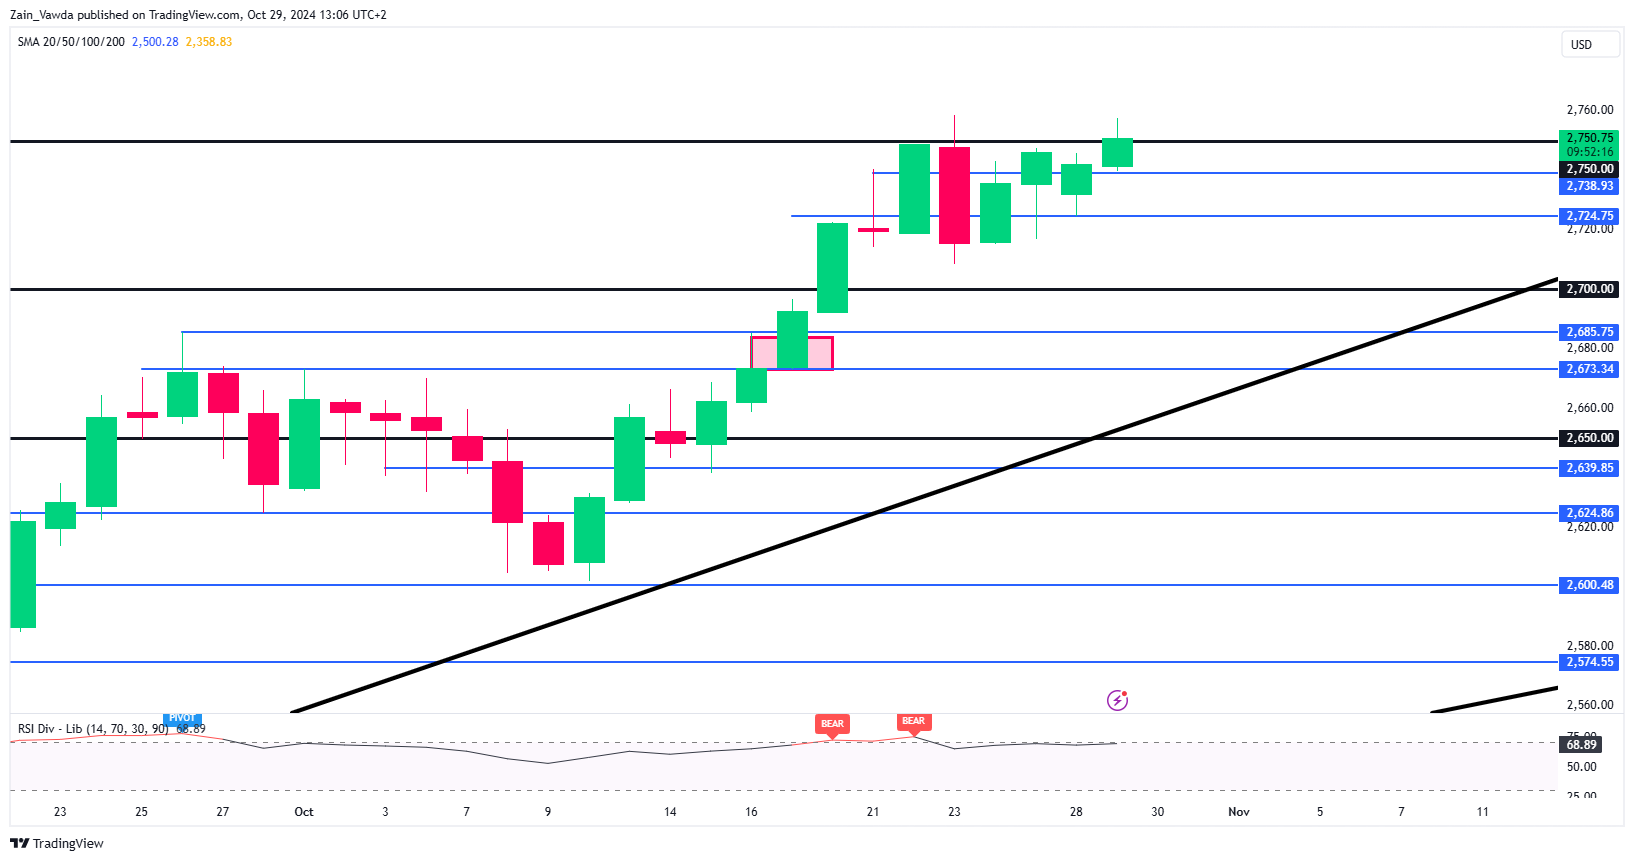
Source: TradingView (click to enlarge)
Looking at the H4 chart below, the precious metal has closed above the 2750 handle twice bu failed to kick-on. Hence my thought process that a daily candle close above the psychological handle could assist bulls in pushing prices higher.
Immediate resistance rests at the most recent highs around 2758 before the 2775 and 2800 regions come into focus.
Conversely, a break back below the 2750 handle has to navigate support at 2738 and 2724 respectively before the chance of a retest of 2700 becomes a possibility.
GOLD (XAU/USD) Four-Hour (H4) Chart, October 29, 2024
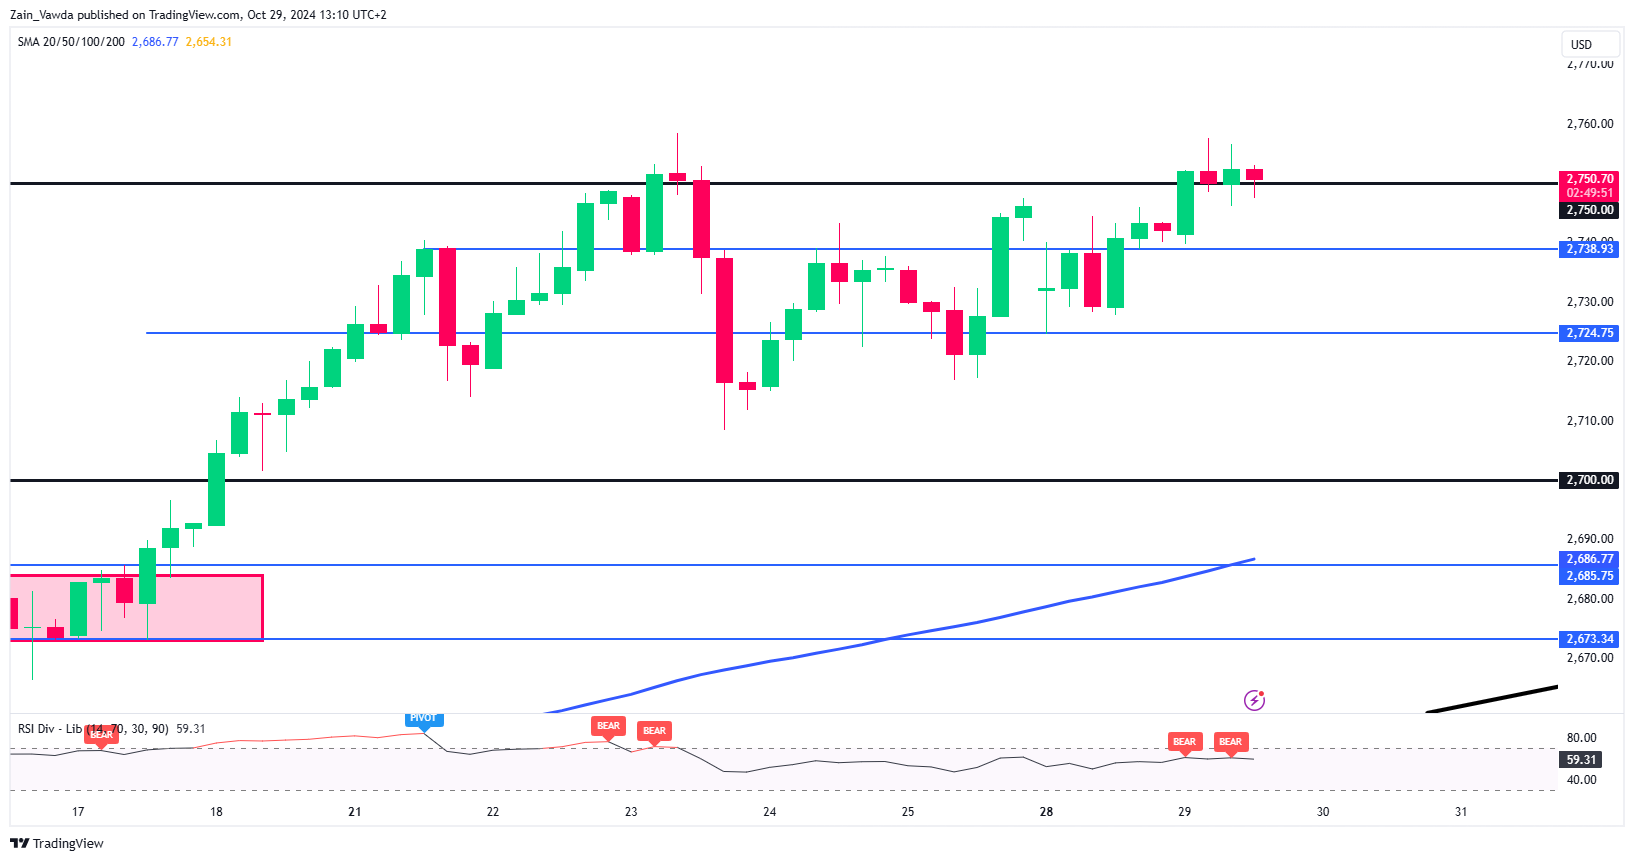
Source: TradingView (click to enlarge)
Support
- 2738
- 2724
- 2714
Resistance
- 2758
- 2775
- 2800