Sample Category Title
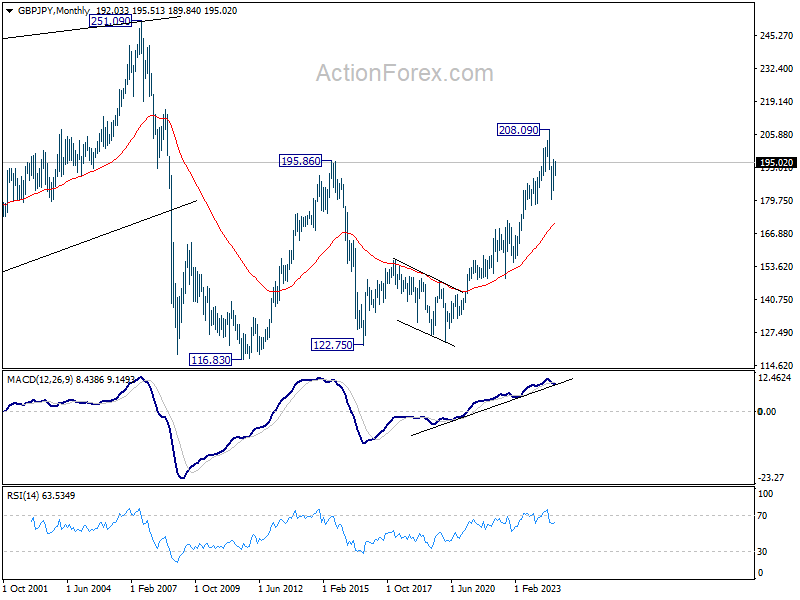
GBP/JPY Weekly Outlook
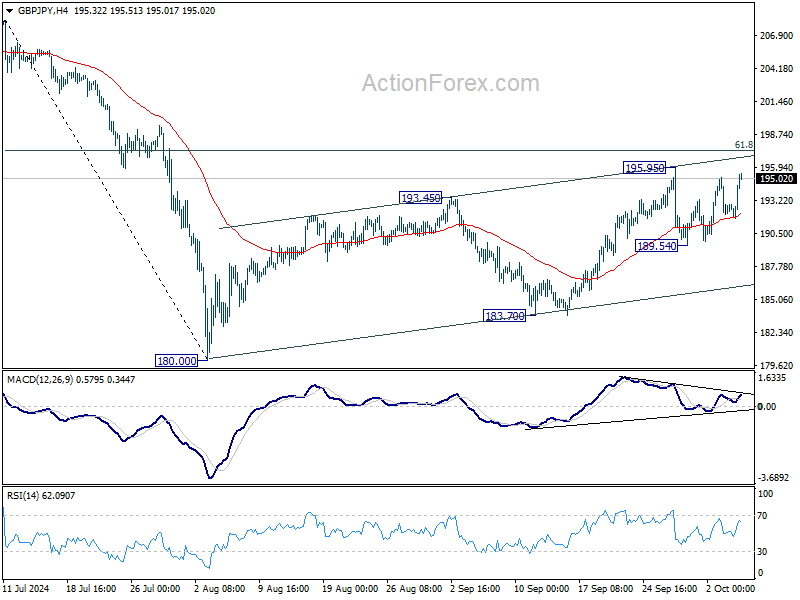
GBP/JPY rebounded after initial dip to 189.54 last week, but upside is limited below 195.95 resistance. Initial bias stays neutral this week first. On the upside break of 195.95 will resume whole rise from 180.00 to 61.8% retracement of 208.09 to 180.00 at 197.35 next. On the downside, break of 189.54 will turn bias back to the downside for 183.70 support instead.
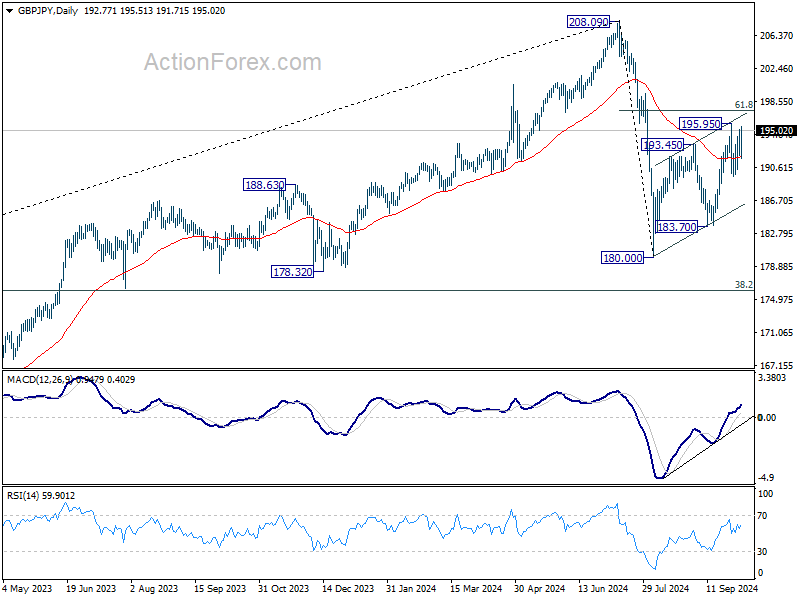
In the bigger picture, price actions from 208.09 are seen as a correction to whole rally from 123.94 (2020 low). The range of consolidation should be set between 38.2% retracement of 123.94 to 208.09 at 175.94 and 208.09. However, decisive break of 175.94 will argue that deeper correction is underway.
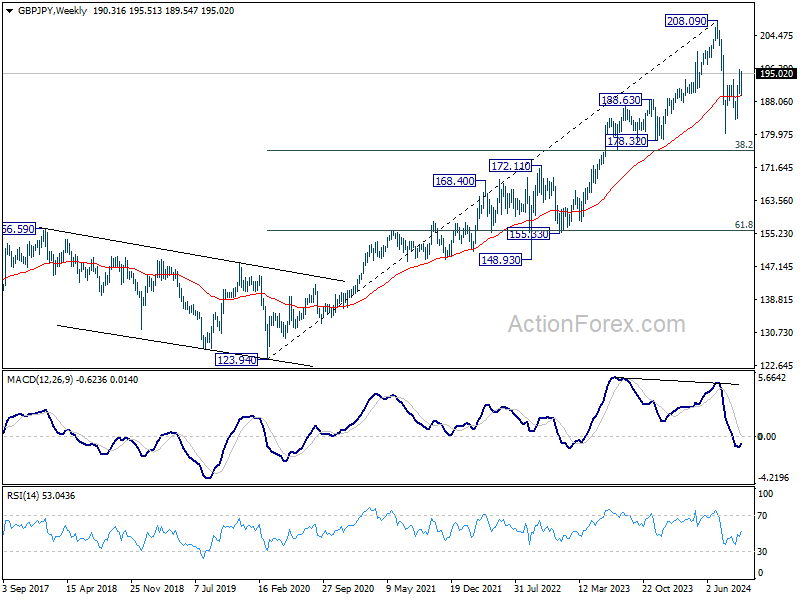
In the longer term picture, considering bearish divergence condition in W MACD, 208.09 is at least a medium term top. It's still early to conclude that the up trend from 122.75 (2016 low) has completed. But it's at least in a medium term corrective phase, with risk of correction to 55 M EMA (now at 170.20).
EUR/JPY Weekly Outlook
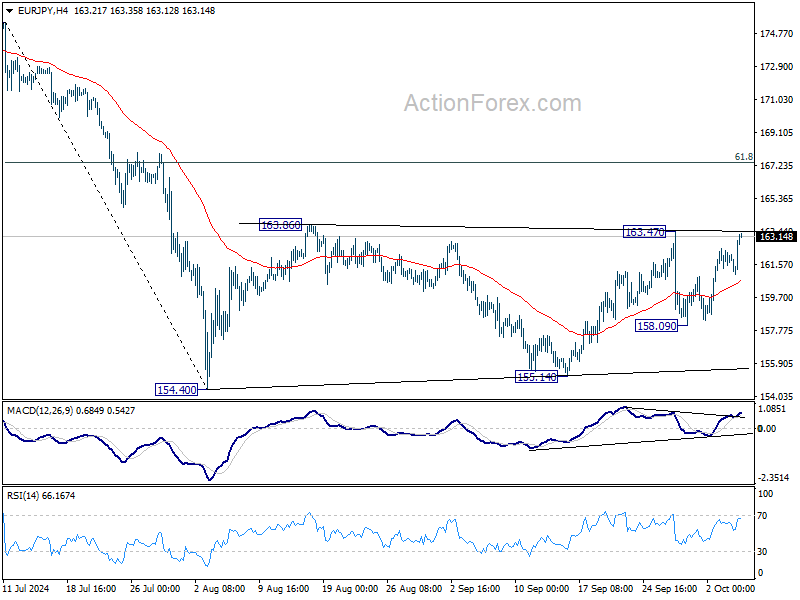
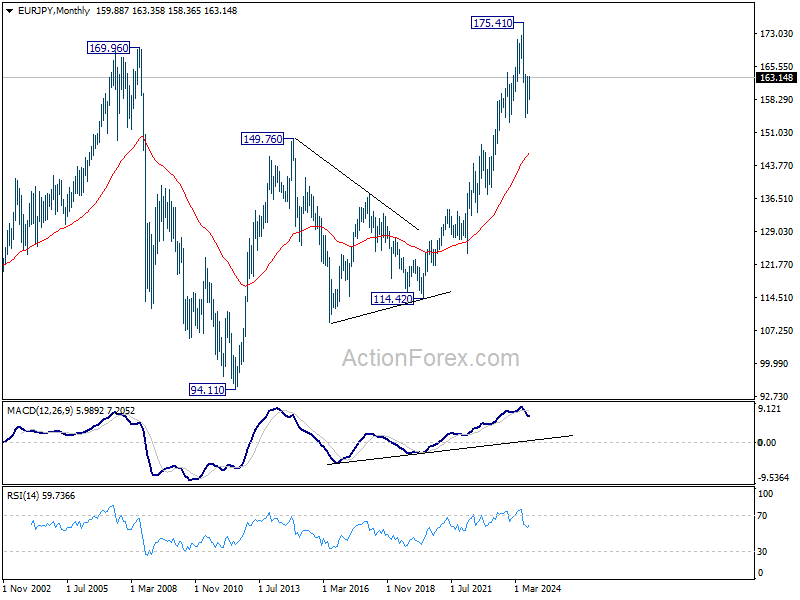
EUR/JPY rebounded after initial dip to 158.09 last week but upside is limited below 163.47 resistance. Initial bias remains neutral this week first. On the upside, break of 163.47 will resume the rebound from 154.40 to 61.8% retracement of 175.41 to 154.40 at 167.38. On the downside, break of 158.09 will bring deeper fall back to 154.40/155.14 support zone.
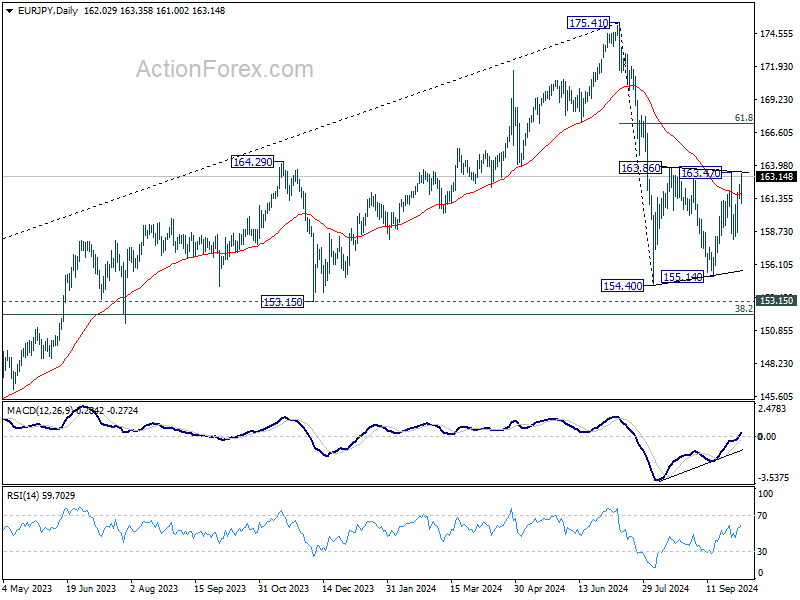
In the bigger picture, price actions from 175.41 are seen as correction to rally from 114.42 (2020 low). The range of consolidation should have been set between 38.2% retracement of 114.42 to 175.41 at 152.11 and 175.41 high. However, decisive break of 152.11 would argue that deeper correction is underway.
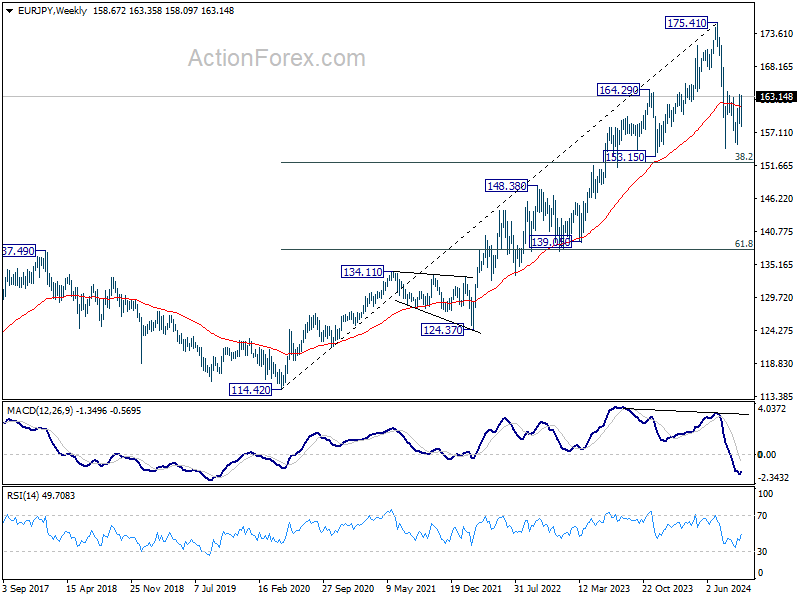
In the long term picture, considering bearish divergence condition in W MACD, 175.41 is at least a medium term top. It's still early to conclude that up trend from 94.11 (2012 low) has completed. But a medium term corrective phase is in progress with risk of deeper fall back to 55 M EMA (now at 146.03).
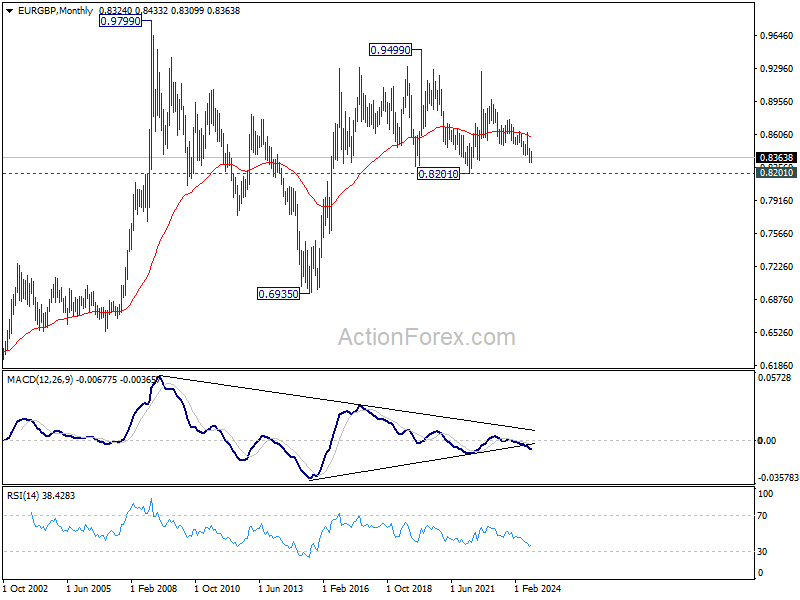
EUR/GBP Weekly Outlook
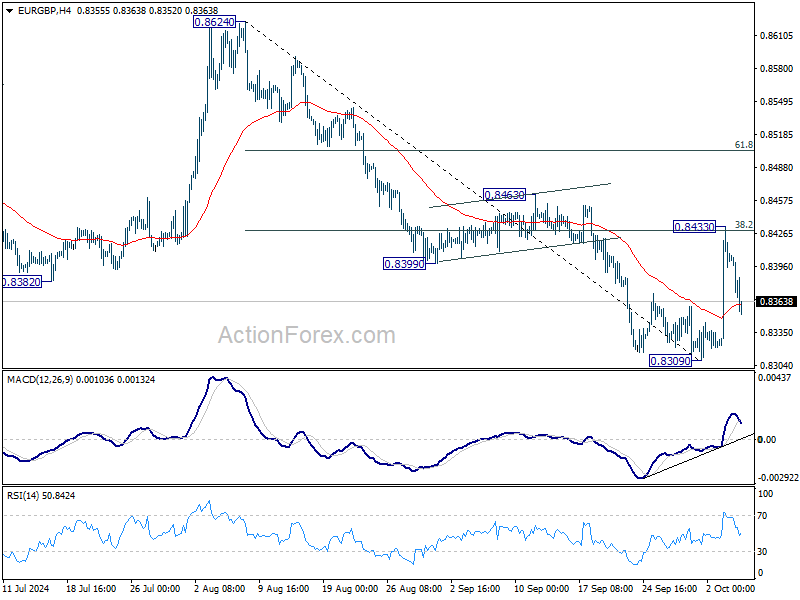
EUR/GBP rebounded strongly after initial dip to 0.8309 last week. But upside was capped by 38.2% retracement of 0.8624 to 0.8309 at 0.8429. Initial bias stays neutral this week and outlook remains bearish. On the downside, break of 0.8309 will resume larger down trend to 0.8201 key support next. However, decisive break of 38.2% retracement of 0.8624 to 0.8309 at 0.8429 will pave the way to 61.8% retracement at 0.8504 and possibly above.
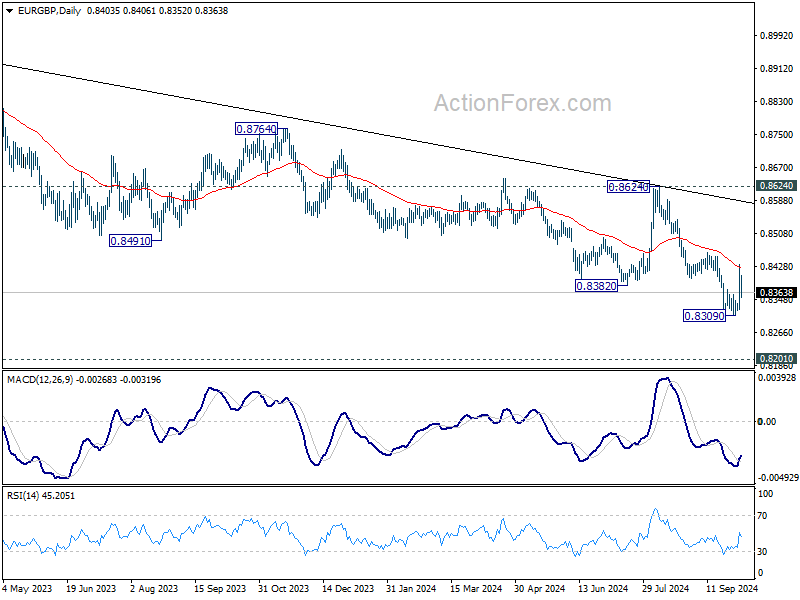
In the bigger picture, down trend from 0.9267 (2022 high) is in progress. Next target is 0.8201 (2022 low), but strong support should be seen there to bring rebound. However, outlook will remain bearish as long as 0.8624 resistance holds even in case of strong rebound.
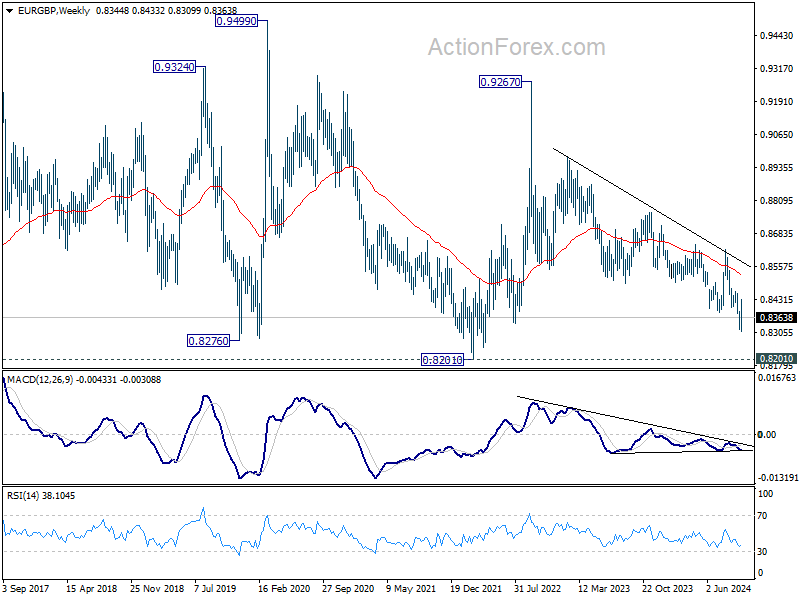
In the long term picture, price action from 0.9499 (2020 high) is seen as part of the long term range pattern from 0.9799 (2008 high). Range trading should continue between 0.8201 and 0.9499, until there is clear signal of imminent breakout.
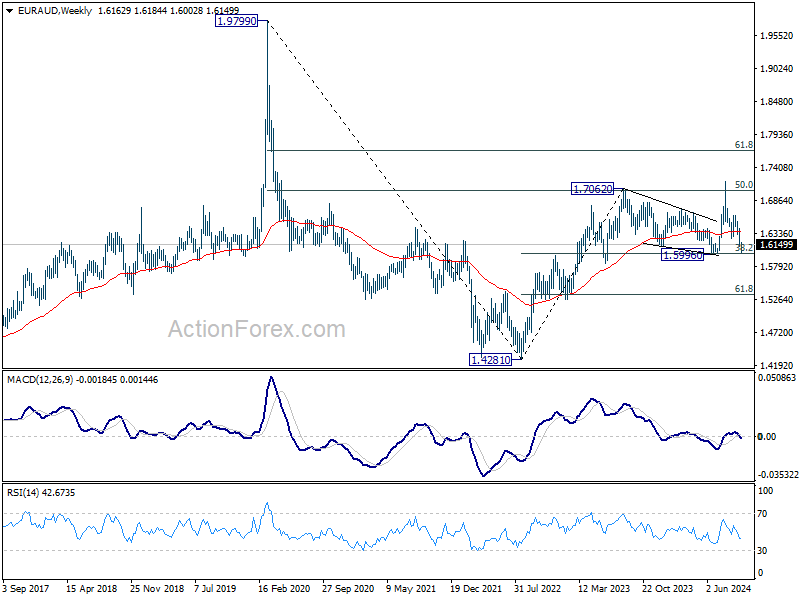
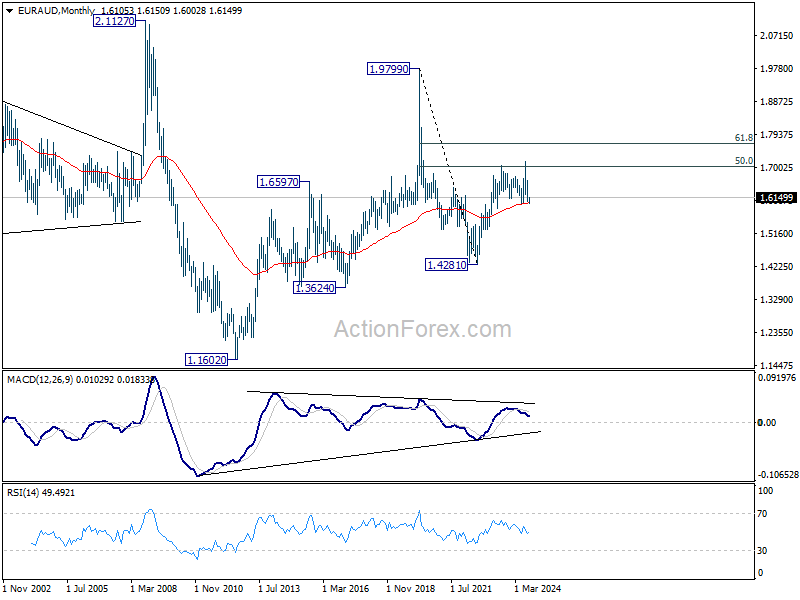
EUR/AUD Weekly Outlook
EUR/AUD's dipped further to 1.6002 last week but recovered just ahead of 1.5996 key support level. Initial bias stays neutral this week first. On the upside, firm break of 1.6184 resistance should confirm short term bottoming. Intraday bias will be back on the upside for 1.6256/6629 resistance zone. However, sustained break of 1.5996 will carry larger bearish implications, and target 100% projection of 1.7180 to 1.6256 from 1.6629 at 1.5705.
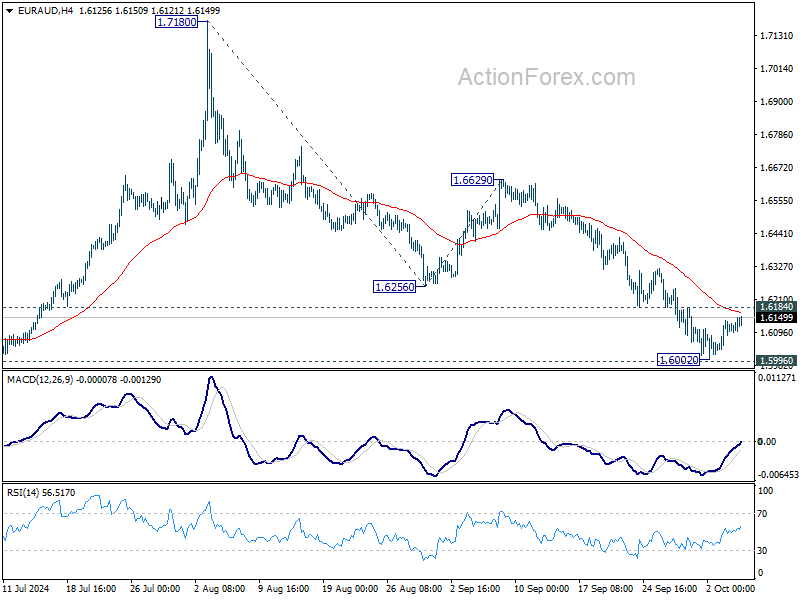
In the bigger picture, as long as 1.5996 support holds, up trend from 1.4281 (2022 low) is still expected to resume at a later stage. However, decisive break of 1.5996 will argue that the medium term trend has reversed and turn outlook bearish.
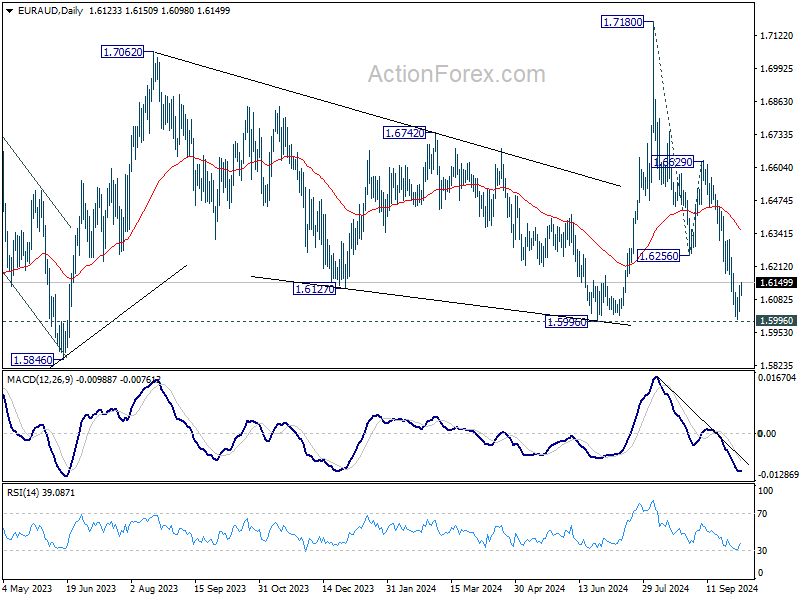
In the longer term picture, rise from 1.4281 is seen as the second leg of the pattern from 1.9799 (2020 high), which is part of the pattern from 2.1127 (2008 high). As long as 55 M EMA (now at 1.6008) holds, this second leg could still extend higher. However, sustained trading below 55 M EMA will open up the bearish case for extending the decline through 1.4281 low.
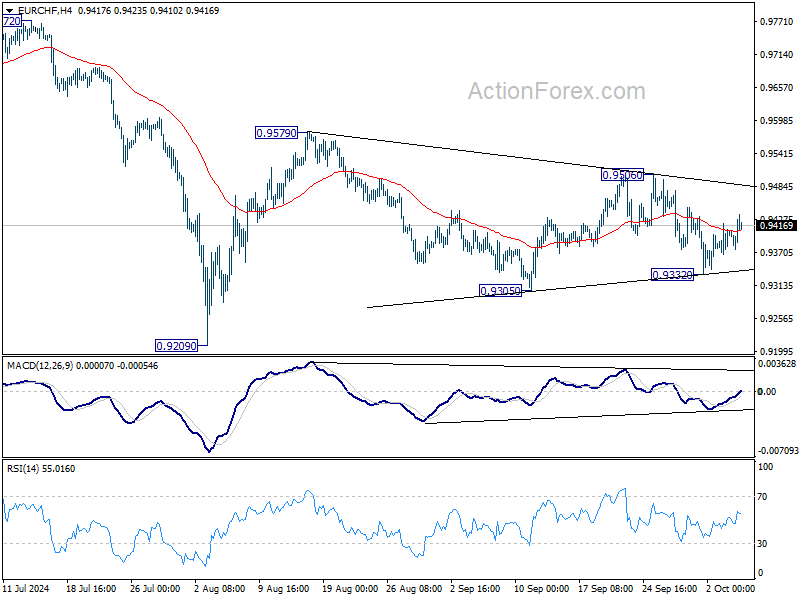
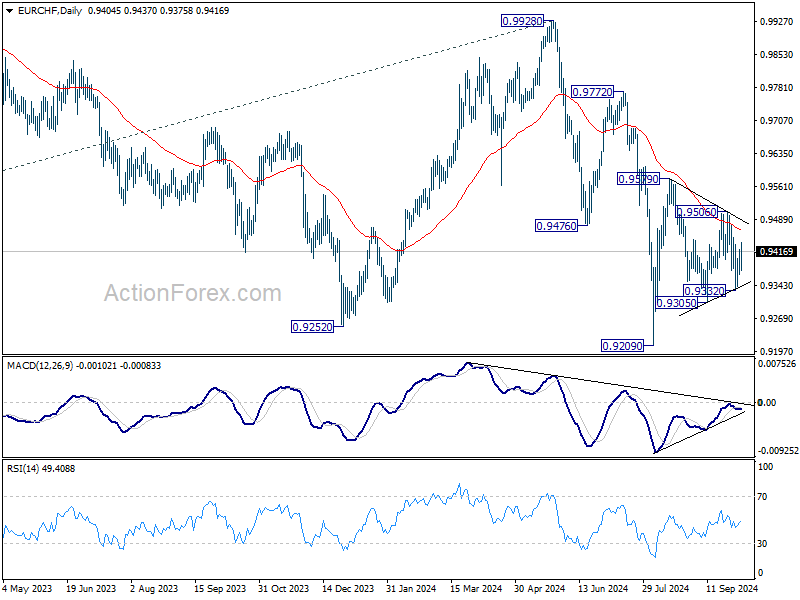
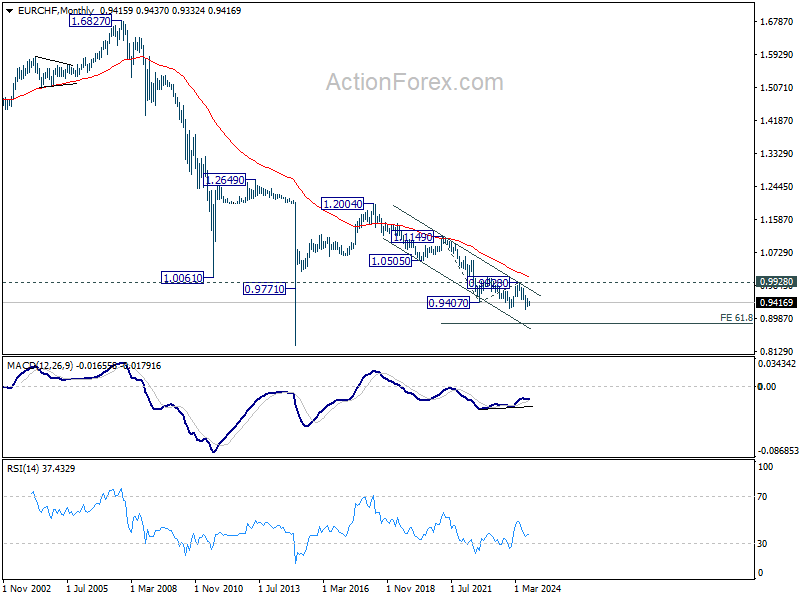
EUR/CHF Weekly Outlook
EUR/CHF was bounded in range trading inside 0.9332/9506 last week. Initial bias stays neutral this week first. For now, the favored case is that rise from 0.9209 low is not finished yet. Break of 0.9506 will turn intraday bias to the upside for 0.9579 resistance and above. However, break of 0.9332 will dampen this view and bring deeper decline through 0.9305 support instead.
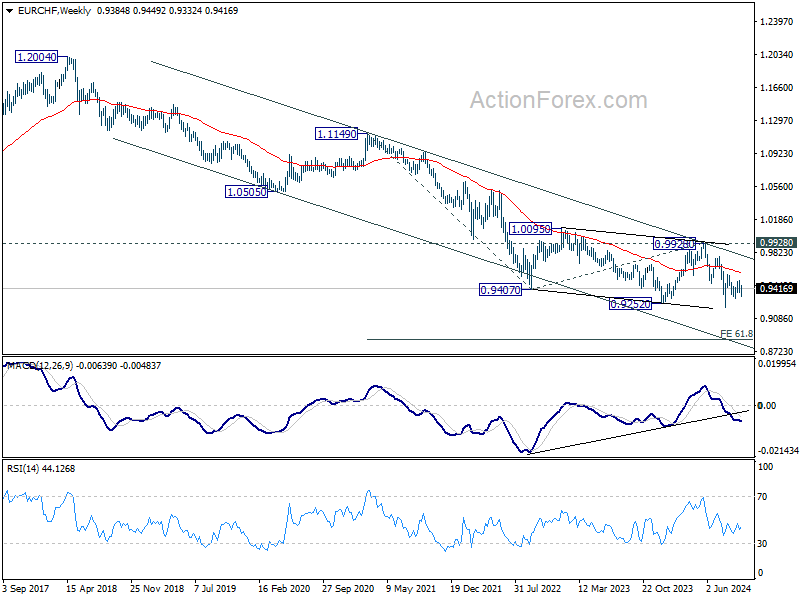
In the bigger picture, medium term corrective pattern from 0.9407 (2022 low) might have completed with three waves to 0.9928. Decisive break of 0.9252 (2023 low) will confirm long term down trend resumption. Next target will be 61.8% projection of 1.1149 to 0.9407 from 0.9928 at 0.8851. For now, outlook will stay bearish as long as 0.9928 resistance holds, even in case of strong rebound.
In the long term picture, fall from 1.2004 (2018 high) is part of the multi-decade down trend. Firm break of 0.9928 resistance is needed to be the first sign of long term bottoming. Otherwise, outlook will remain bearish.
Summary 10/7 – 10/11
Monday, Oct 7, 2024
| GMT | Ccy | Events | Consensus | Previous |
|---|---|---|---|---|
| 00:00 | AUD | TD-MI Inflation Gauge M/M Sep | -0.10% | |
| 05:00 | JPY | Leading Economic Index Aug P | 107.4 | 109.3 |
| 06:00 | EUR | Germany Factory Orders M/M Aug | -2.00% | 2.90% |
| 07:00 | CHF | Foreign Currency Reserves (CHF) Sep | 694B | |
| 08:30 | EUR | Eurozone Sentix Investor Confidence Oct | -13.9 | -15.4 |
| 09:00 | EUR | Eurozone Retail Sales M/M Aug | 0.20% | 0.10% |
| 23:30 | AUD | Westpac Consumer Confidence Oct | -0.50% | |
| 23:30 | JPY | Labor Cash Earnings Y/Y Aug | 3.10% | 3.60% |
| 23:30 | JPY | Overall Household Spending Y/Y Aug | -2.60% | 0.10% |
| 23:50 | JPY | Current Account (JPY) Aug | 2.41T | 2.80T |
| GMT | Ccy | Events | |
|---|---|---|---|
| 00:00 | AUD | TD-MI Inflation Gauge M/M Sep | |
| Forecast: | Previous: -0.10% | ||
| 05:00 | JPY | Leading Economic Index Aug P | |
| Forecast: 107.4 | Previous: 109.3 | ||
| 06:00 | EUR | Germany Factory Orders M/M Aug | |
| Forecast: -2.00% | Previous: 2.90% | ||
| 07:00 | CHF | Foreign Currency Reserves (CHF) Sep | |
| Forecast: | Previous: 694B | ||
| 08:30 | EUR | Eurozone Sentix Investor Confidence Oct | |
| Forecast: -13.9 | Previous: -15.4 | ||
| 09:00 | EUR | Eurozone Retail Sales M/M Aug | |
| Forecast: 0.20% | Previous: 0.10% | ||
| 23:30 | AUD | Westpac Consumer Confidence Oct | |
| Forecast: | Previous: -0.50% | ||
| 23:30 | JPY | Labor Cash Earnings Y/Y Aug | |
| Forecast: 3.10% | Previous: 3.60% | ||
| 23:30 | JPY | Overall Household Spending Y/Y Aug | |
| Forecast: -2.60% | Previous: 0.10% | ||
| 23:50 | JPY | Current Account (JPY) Aug | |
| Forecast: 2.41T | Previous: 2.80T | ||
Tuesday, Oct 8, 2024
| GMT | Ccy | Events | Consensus | Previous |
|---|---|---|---|---|
| 00:30 | AUD | RBA Meeting Minutes | ||
| 00:30 | AUD | NAB Business Confidence Sep | -4 | |
| 00:30 | AUD | NAB Business Conditions Sep | 3 | |
| 05:00 | JPY | Eco Watchers Survey: Current Sep | 49.4 | 49 |
| 06:00 | EUR | Germany Industrial Production M/M Aug | 0.80% | -2.40% |
| 06:45 | EUR | France Trade Balance (EUR) Aug | -5.5B | �-5.884B |
| 10:00 | USD | NFIB Business Optimism Index Sep | 91.7 | 91.2 |
| 12:30 | USD | Trade Balance (USD) Aug | -71.1B | -78.8B |
| 12:30 | USD | Goods Trade Balance Aug | $-94.3B | |
| 12:30 | CAD | Trade Balance (CAD) Aug | 0.2B | 0.7B |
| GMT | Ccy | Events | |
|---|---|---|---|
| 00:30 | AUD | RBA Meeting Minutes | |
| Forecast: | Previous: | ||
| 00:30 | AUD | NAB Business Confidence Sep | |
| Forecast: | Previous: -4 | ||
| 00:30 | AUD | NAB Business Conditions Sep | |
| Forecast: | Previous: 3 | ||
| 05:00 | JPY | Eco Watchers Survey: Current Sep | |
| Forecast: 49.4 | Previous: 49 | ||
| 06:00 | EUR | Germany Industrial Production M/M Aug | |
| Forecast: 0.80% | Previous: -2.40% | ||
| 06:45 | EUR | France Trade Balance (EUR) Aug | |
| Forecast: -5.5B | Previous: �-5.884B | ||
| 10:00 | USD | NFIB Business Optimism Index Sep | |
| Forecast: 91.7 | Previous: 91.2 | ||
| 12:30 | USD | Trade Balance (USD) Aug | |
| Forecast: -71.1B | Previous: -78.8B | ||
| 12:30 | USD | Goods Trade Balance Aug | |
| Forecast: | Previous: $-94.3B | ||
| 12:30 | CAD | Trade Balance (CAD) Aug | |
| Forecast: 0.2B | Previous: 0.7B | ||
Wednesday, Oct 9 2024
| GMT | Ccy | Events | Consensus | Previous |
|---|---|---|---|---|
| 01:00 | NZD | RBNZ Interest Rate Decision | 4.75% | 5.25% |
| 06:00 | JPY | Machine Tool Orders Y/Y Sep P | -3.50% | |
| 06:00 | EUR | GermanyTrade Balance (EUR) Aug | 18.9B | 16.8B |
| 14:00 | USD | Wholesale Inventories Aug F | 0.20% | 0.20% |
| 14:30 | USD | Crude Oil Inventories | 3.9M | |
| 18:00 | USD | FOMC Minutes | ||
| 23:01 | GBP | RICS Housing Price Balance Sep | 7% | 1% |
| 23:50 | JPY | Bank Lending Y/Y Sep | 3% | |
| 23:50 | JPY | PPI Y/Y Sep | 2.30% | 2.50% |
| GMT | Ccy | Events | |
|---|---|---|---|
| 01:00 | NZD | RBNZ Interest Rate Decision | |
| Forecast: 4.75% | Previous: 5.25% | ||
| 06:00 | JPY | Machine Tool Orders Y/Y Sep P | |
| Forecast: | Previous: -3.50% | ||
| 06:00 | EUR | GermanyTrade Balance (EUR) Aug | |
| Forecast: 18.9B | Previous: 16.8B | ||
| 14:00 | USD | Wholesale Inventories Aug F | |
| Forecast: 0.20% | Previous: 0.20% | ||
| 14:30 | USD | Crude Oil Inventories | |
| Forecast: | Previous: 3.9M | ||
| 18:00 | USD | FOMC Minutes | |
| Forecast: | Previous: | ||
| 23:01 | GBP | RICS Housing Price Balance Sep | |
| Forecast: 7% | Previous: 1% | ||
| 23:50 | JPY | Bank Lending Y/Y Sep | |
| Forecast: | Previous: 3% | ||
| 23:50 | JPY | PPI Y/Y Sep | |
| Forecast: 2.30% | Previous: 2.50% | ||
Thursday, Oct 10, 2024
| GMT | Ccy | Events | Consensus | Previous |
|---|---|---|---|---|
| 00:00 | AUD | Consumer Inflation Expectations Oct | 4.40% | |
| 11:30 | EUR | ECB Meeting Accounts | ||
| 12:30 | USD | Initial Jobless Claims (Oct 4) | 223K | 225K |
| 12:30 | USD | CPI M/M Sep | 0.10% | 0.20% |
| 12:30 | USD | CPI Y/Y Sep | 2.30% | 2.50% |
| 12:30 | USD | CPI Core M/M Sep | 0.20% | 0.30% |
| 12:30 | USD | CPI Core Y/Y Sep | 3.20% | |
| 14:30 | USD | Natural Gas Storage | 55B | |
| 15:00 | USD | Fed's Williams speech | ||
| 21:30 | NZD | Business NZ PMI Sep | 45.8 | |
| 23:50 | JPY | Money Supply M2+CD Y/Y Sep | 1.50% | 1.30% |
| GMT | Ccy | Events | |
|---|---|---|---|
| 00:00 | AUD | Consumer Inflation Expectations Oct | |
| Forecast: | Previous: 4.40% | ||
| 11:30 | EUR | ECB Meeting Accounts | |
| Forecast: | Previous: | ||
| 12:30 | USD | Initial Jobless Claims (Oct 4) | |
| Forecast: 223K | Previous: 225K | ||
| 12:30 | USD | CPI M/M Sep | |
| Forecast: 0.10% | Previous: 0.20% | ||
| 12:30 | USD | CPI Y/Y Sep | |
| Forecast: 2.30% | Previous: 2.50% | ||
| 12:30 | USD | CPI Core M/M Sep | |
| Forecast: 0.20% | Previous: 0.30% | ||
| 12:30 | USD | CPI Core Y/Y Sep | |
| Forecast: | Previous: 3.20% | ||
| 14:30 | USD | Natural Gas Storage | |
| Forecast: | Previous: 55B | ||
| 15:00 | USD | Fed's Williams speech | |
| Forecast: | Previous: | ||
| 21:30 | NZD | Business NZ PMI Sep | |
| Forecast: | Previous: 45.8 | ||
| 23:50 | JPY | Money Supply M2+CD Y/Y Sep | |
| Forecast: 1.50% | Previous: 1.30% | ||
Friday, Oct 11, 2024
| GMT | Ccy | Events | Consensus | Previous |
|---|---|---|---|---|
| 06:00 | EUR | Germany CPI M/M Sep F | 0% | 0% |
| 06:00 | EUR | Germany CPI Y/Y Sep F | 1.60% | 1.60% |
| 06:00 | GBP | GDP M/M Aug | 0.20% | 0.00% |
| 06:00 | GBP | Industrial Production M/M Aug | 0.20% | -0.80% |
| 06:00 | GBP | Industrial Production Y/Y Aug | -1.20% | |
| 06:00 | GBP | Manufacturing Production M/M Aug | 0.30% | -1.00% |
| 06:00 | GBP | Manufacturing Production Y/Y Aug | -1.30% | |
| 06:00 | GBP | Goods Trade Balance (GBP) Aug | -19.2B | -20.0B |
| 12:30 | USD | PPI M/M Sep | 0.10% | 0.20% |
| 12:30 | USD | PPI Y/Y Sep | 1.70% | |
| 12:30 | USD | PPI Core M/M Sep | 0.20% | 0.30% |
| 12:30 | USD | PPI Core Y/Y Sep | 2.40% | |
| 12:30 | CAD | Building Permits M/M Aug | -8.40% | 22.10% |
| 12:30 | CAD | Net Change in Employment Sep | 34.5K | 22.1K |
| 12:30 | CAD | Unemployment Rate Sep | 6.60% | 6.60% |
| 14:00 | USD | Michigan Consumer Sentiment Index Oct P | 70.1 | 70.1 |
| 14:30 | CAD | BOC Business Outlook Survey |
| GMT | Ccy | Events | |
|---|---|---|---|
| 06:00 | EUR | Germany CPI M/M Sep F | |
| Forecast: 0% | Previous: 0% | ||
| 06:00 | EUR | Germany CPI Y/Y Sep F | |
| Forecast: 1.60% | Previous: 1.60% | ||
| 06:00 | GBP | GDP M/M Aug | |
| Forecast: 0.20% | Previous: 0.00% | ||
| 06:00 | GBP | Industrial Production M/M Aug | |
| Forecast: 0.20% | Previous: -0.80% | ||
| 06:00 | GBP | Industrial Production Y/Y Aug | |
| Forecast: | Previous: -1.20% | ||
| 06:00 | GBP | Manufacturing Production M/M Aug | |
| Forecast: 0.30% | Previous: -1.00% | ||
| 06:00 | GBP | Manufacturing Production Y/Y Aug | |
| Forecast: | Previous: -1.30% | ||
| 06:00 | GBP | Goods Trade Balance (GBP) Aug | |
| Forecast: -19.2B | Previous: -20.0B | ||
| 12:30 | USD | PPI M/M Sep | |
| Forecast: 0.10% | Previous: 0.20% | ||
| 12:30 | USD | PPI Y/Y Sep | |
| Forecast: | Previous: 1.70% | ||
| 12:30 | USD | PPI Core M/M Sep | |
| Forecast: 0.20% | Previous: 0.30% | ||
| 12:30 | USD | PPI Core Y/Y Sep | |
| Forecast: | Previous: 2.40% | ||
| 12:30 | CAD | Building Permits M/M Aug | |
| Forecast: -8.40% | Previous: 22.10% | ||
| 12:30 | CAD | Net Change in Employment Sep | |
| Forecast: 34.5K | Previous: 22.1K | ||
| 12:30 | CAD | Unemployment Rate Sep | |
| Forecast: 6.60% | Previous: 6.60% | ||
| 14:00 | USD | Michigan Consumer Sentiment Index Oct P | |
| Forecast: 70.1 | Previous: 70.1 | ||
| 14:30 | CAD | BOC Business Outlook Survey | |
| Forecast: | Previous: | ||
Markets Weekly Outlook – Jobs Report May Lead to Cautious Fed, US CPI Next
- Strong US jobs report shifts Fed rate cut expectations from 50 bps to 25 bps.
- Geopolitical tensions in the Middle East drive up oil prices and safe-haven assets.
- Upcoming US inflation data and RBNZ rate decision in focus for the week ahead.
- Oil prices surge on Middle East tensions, with key support and resistance levels identified.
Week in Review: Strong Jobs Report Support Fed Narrative of 25 bps Cut
What a difference a week can make. It seems just yesterday that market participants were pricing in a 50 bps rate cut at the Feds November meeting and the US Dollar appeared to be teetering on the brink. However, renewed geopolitical risk and a blockbuster jobs report have left markets with a few new angles to consider heading into the new week.
Markets have all but priced out a 50 bps cut in November with a 97% chance of a 25 bps cut. This is a remarkable change from 7 days ago when markets were pricing in a 50 bps cut at around 60%.
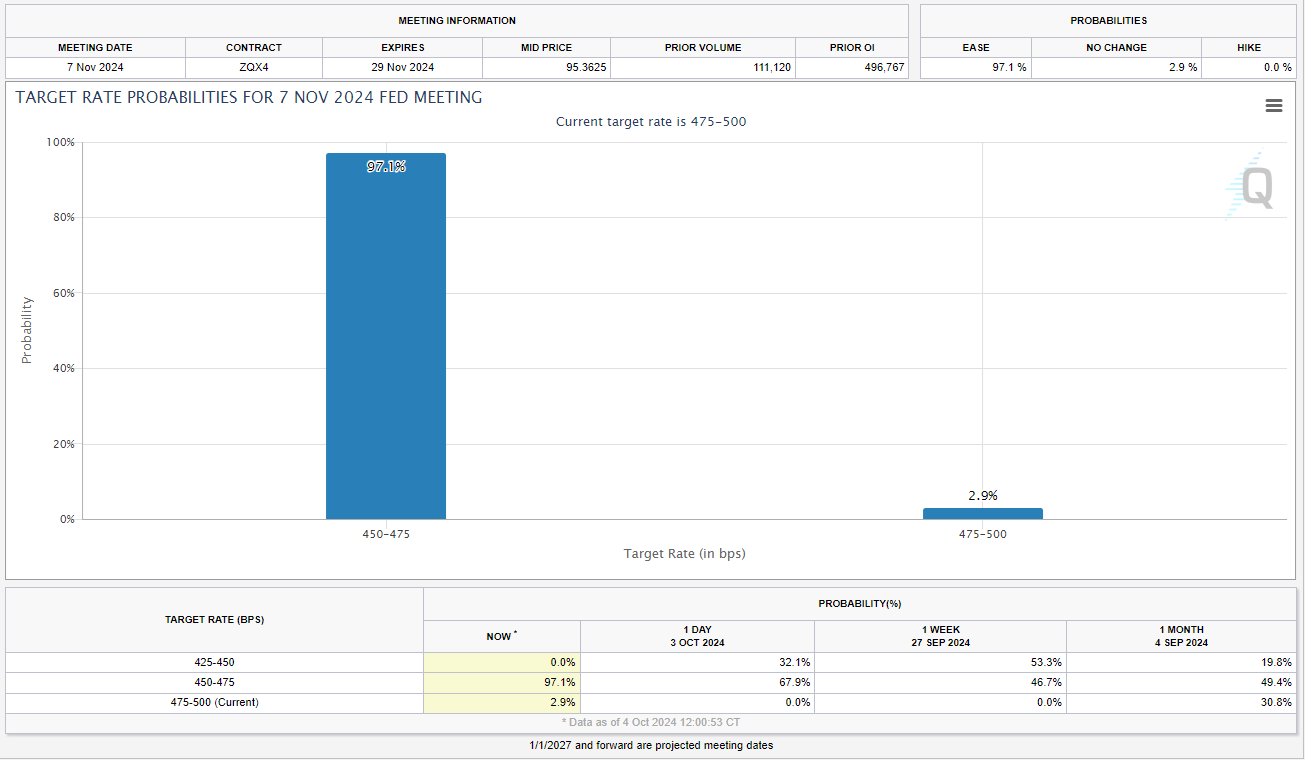
Source: CME FedWatch Tool
The US jobs report showed exceptional strength across all areas—job creation, unemployment, wages, and hours worked. However, caution remains due to the absence of supporting data. Inflation is on the right path as well but as Fed policymaker Goolsbee stated “powell’s message that there are balanced risks is wise”. Goolsbee also warned that external factors have derailed many soft landings in the past.
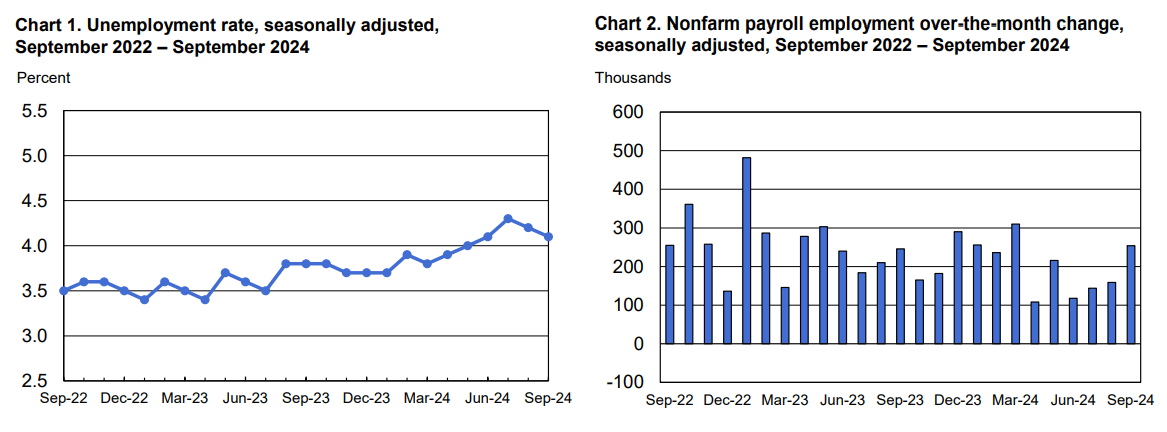
Source: BLS
Now of course the next major market moving event this week was geopolitical risks. We are starting to see a return of the risk premium and safe haven flows in markets following Iran’s strike against Israel this week raised the alarm of a wider Middle East war. Oil prices were the largest beneficiary in this regard, rallying some 9.7% for the week.
Gold, US Dollar, CHF and the Yen also benefited in varying degrees from the safe haven appeal and demand created after the event. This is something that needs to be monitored as Israel has promised to retaliate and has even threatened Iran’s Oil production. This definitely spooked markets and led to the surge in Oil prices as markets look and ponder the effects on oil supplies of a wider regional war.
US Stocks also finished the week on a high following the jobs data. The S&P 500 and the Nasdaq 100 started the week with losses before finishing the week strong, trading almost flat at the time of writing. Emerging markets however came under renewed pressure this week as risk sentiment soured from a geopolitical risk perspective.
The Week Ahead: US Inflation and RBNZ Rate Decision
The week ahead sees high impact data take a bit of a breather but we do have a lot of risks to navigate nonetheless. The most pertinent of which is the geopolitical risk which hangs in the balance as the weekend approaches. Various scenarios could develop on this front next week with Oil being the major asset which could be directly affected.
US inflation data may be due but it does not hold the same weight as it did a few months ago. However, following the strong wage numbers and the job report today, markets may pay a lot more attention to this week’s print to ensure an uptick in inflation isn’t on the way.
Asia Pacific Markets
In Asia, data is sparse from the major economies with China and Japan not releasing any high impact data this week. China’s data calendar is relatively quiet for the upcoming week, as the country resumes work next Tuesday following the Golden Week holiday. We can expect some data on holiday travel and consumption, along with possible updates on the stimulus rollout as the week unfolds.
The New Zealand interest rate decision will be at the forefront of Asia Pacific data releases this week. Investors are confident that the RBNZ will reduce interest rates by 50bps next week, followed by another 50 bps in November. This suggests that the risks for the kiwi might lean towards the upside. If officials implement a double cut and indicate further aggressive easing, it would merely confirm market expectations, making significant depreciation of the kiwi unlikely.
Europe + UK + US
In developed markets, the Euro Area gets a break in terms of data releases whereas the UK releases GDP data on Friday. Besides that it will be a quiet week from both Europe and the UK.
The US will get the attention once more with US inflation and FED minute releases. There is also a host of Fed speakers which could give more insight to FED policymakers thinking heading toward the November interest rate meeting.
Preliminary S&P Global PMIs indicate that prices charged by businesses increased at the quickest pace in six months. While the ISM manufacturing survey showed a decline, the non-manufacturing report supported the idea of rising price pressures. This coupled with wage data this week and improving unemployment does hint at the fact that resurgent price pressures may rear their head once more.
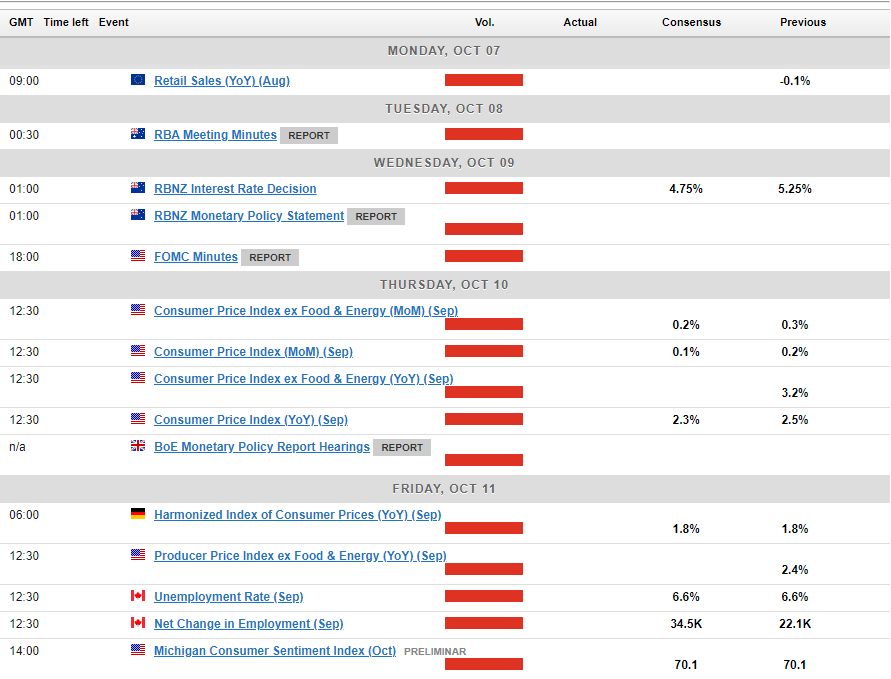
Chart of the Week
This week’s focus is on Oil following the commodity recording its best weekly gain in nearly two years.
The rising tensions in the Middle East have led to a host of risks both from a supply and demand perspective. Iraqi militias who are seen as Iranian proxies just yesterday threatened global energy and Oil supplies should any attack take place on Iran. There is also the risk that a wider regional war could result in Iran potentially shutting down the Strait of Hormuz, through which 20-25% of the world’s Oil passes through.
Israel has touted potentially attacking Iranian oil infrastructure as well with the Kharg Island (Iran’s biggest oil export terminal) being named as a possible target. Such a move as well could send Oil prices hurtling higher and have a knock on effect globally. A delicate situation heading into the weekend.
Oil was up almost 10% for the week at the time of writing, Brent reaching a daily high just shy of the $80 a barrel mark. We could see a retracement if there are signs that escalation in the region may not materialize. However anything else could push Oil beyond the $80 a barrel mark.
From a technical standpoint, immediate support rests at 76.35 before the confluence area around the 75.00 handle comes into focus.
Conversely, on the upside immediate resistance rests at 79.00 before the psychological 80.00 handle comes back into focus. We have the 100-day MA just above 80.00 as well making the level even more crucial if further upside is to occur. Beyond this we have key levels at 81.58 and 81.92.
Oil Daily Chart – October 4, 2024
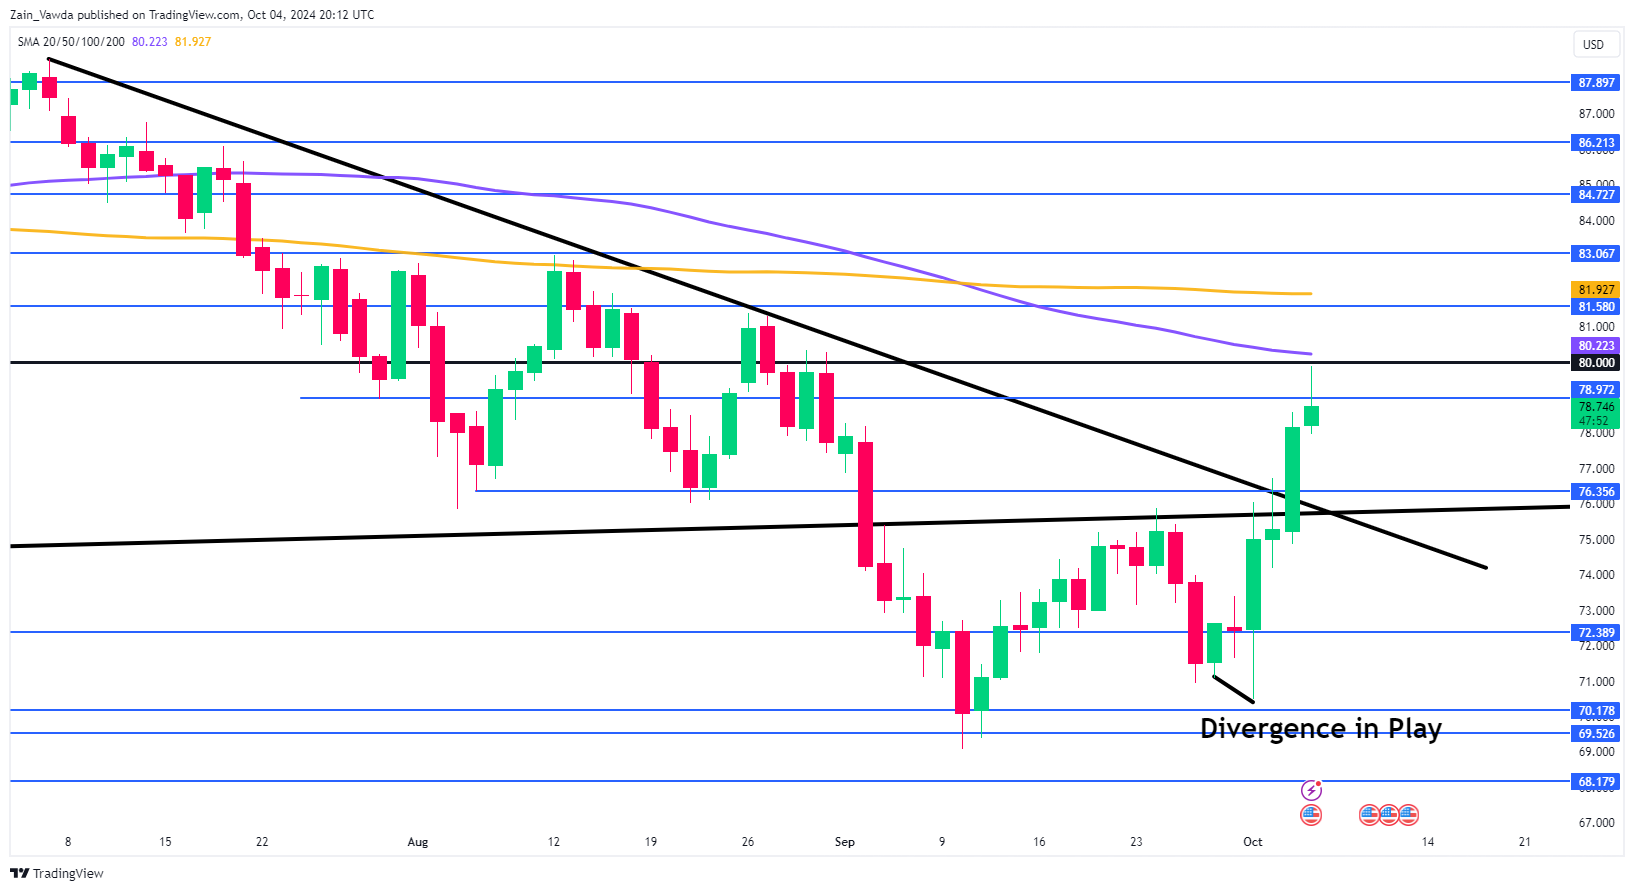
Source:TradingView.Com (click to enlarge)
Key Levels to Consider:
Support:
- 76.35
- 75.00
- 73.00
Resistance:
- 79.00
- 80.00
- 81.58
- 81.92
- 83.00
The Weekly Bottom Line: A Duo of Disruption Muddies the Economic Outlook
U.S. Highlights
- The U.S. labor market perked up in September as job gains beat expectations, the unemployment rate ticked down and annual wage gains edged up.
- The economic outlook, however, has been buffeted by significant disruptions, namely Hurricane Helene and a port worker strike.
- The production side of the economy continues to travel two very different paths with manufacturing contracting, while services expand.
Canadian Highlights
- Canadian market conditions this week were dictated by U.S. and global developments amid a quiet domestic calendar.
- Markets are putting some odds on a larger 50 basis point cut at the Bank of Canada’s next rate announcement on October 23rd. We expect they will stick to a quarter point cut.
- The next two weeks will feature critical data releases including inflation, labour market updates and Bank of Canada surveys which will weigh heavily in the final decision.
U.S. – A Duo of Disruption Muddies the Economic Outlook
The labor market was the data highlight in a week rocked by a major strike and natural disaster. Ten-year bond yields were notably higher relative to yesterday’s close (0.11 basis points) and the S&P500 was also up about 0.4% as the strong jobs report tempered expectations about the Fed’s cutting cycle.
Today’s employment report revealed that while the labor market may be cooling, it is doing so at a moderate pace (see commentary). Payrolls gains handily surpassed expectations, the unemployment rate edged down slightly, and wage gains nudged higher (Chart 1). Overall, the report was better than many market participants had expected and complements the previously released JOLTS data for August. The JOLTS report showed that while firms have slowed the pace of hiring there still continues to be steady demand for workers, as the number of job openings rose slightly. After the superheated labor market witnessed earlier in the post-pandemic period, followed by a steady cooling, the current leveling off in demand and supply is in line with a labor market that is coming into better balance.
On the production side, the ISM Manufacturing Index was unchanged in September, remaining in contraction territory for the sixth consecutive month. On the services side, however, things were looking better, with the ISM Services Index rising notably in September. Overall, the services sector continues to hold its ground, offsetting much of the weakness evident in the country’s manufacturing sector (Chart 2).
In addition, a major dockworker strike at U.S. East and Gulf coast ports added to economic uncertainty. The strike was suspended late Thursday after the dockworkers’ union and the group representing ocean carriers reached an agreement to extend the currently expired contract, until January 15th. This allows dockworkers to resume work while negotiations over wages and port automation, which had been at an “impasse” for months, would now continue. While the worst effects of the strike have been avoided for now, the cloud of uncertainty continues to loom. If the two sides are not able to reach an agreement prior to the end of the extension, then things could be right back to where they were and the longer a strike persists, the greater the economic fallout.
The job market showing signs of only gradual cooling, lends support to Powell’s view expressed earlier in the week that officials didn’t see a reason to lower rates as aggressively as they did at their most recent meeting. Barring the uncertainty of recent events, the labor market remains key in the Fed’s assessment of the most appropriate policy action.
Canada – Taking Stock
This week served Canadian market watchers an opportunity to take a breather. There was no top-shelf economic data, no Bank of Canada (BoC) speeches, and no domestic headline-grabbing news. Beyond our borders however, a hefty U.S. jobs report pulled Canadian yields higher. The U.S. port strike also came to an end, stemming worries of potential near-term inflationary impacts. Elsewhere, conflict is escalating between Israel and Iran, which has sent oil prices almost 10% higher on the week to $74 per barrel. Despite the rise in oil prices, the Canadian dollar tracked modestly lower.
The BoC is 75 basis points (bps) into their cutting cycle, delivered in three 25 bps increments over their last three meetings. The pressing question for Macklem & Co. is whether they feel it’s necessary to deliver a supersized, 50 bps cut at their next meeting on October 23rd. Outside of the 2020 pandemic-emergency rate cuts, the ‘07–’08 Global Financial Crisis and the early-2000’s Dot-Com bubble, one would have to look back to Oct. 1996 to find the last time the BoC cut by more than the standard 25 bps in the middle of an easing-cycle (Chart 1).
With inflation now back to the two-percent target, the Bank is putting more stock into the growth outlook to ensure that inflation doesn’t fall too much. It’s a fair shift in priorities given the slowdown in the Canadian economy. Last week’s GDP reading for July, and advanced look-ahead for August, confirmed that third quarter growth is tracking well below both the BoC’s current estimate and potential growth (Chart 2). We don’t think the GDP data tipped the scales any more-or-less in favour of a potential 50 bps interest rate cut, which would follow the recent move from the Federal Reserve. The BoC also needs to accept that their current forecast is facing downside risk. A fresh set of forecasts via an updated Monetary Policy Report (MPR) at its next meeting will shed light on how they are looking at near-term growth.
Now, emphasis will be placed on upcoming inflation data and labour market trends, where the Bank will be assessing how durable the current 2% inflation is and whether or not labour markets are continuing to cool. The Business Outlook Survey (BOS) and companion consumer survey will also land next week and be closely watched.
With all we know to date, we look for the BoC to continue on their gradual path, delivering another 25 bps cut at their next meeting, bringing the policy rate to 4.00%. Market pricing, for what it’s worth, is attaching around a 30% chance of a supersized cut. We acknowledge the risk of a potential larger cut should incoming data display further signs of deterioration. Past this, we see rates continuing to gradually decline into next year before hitting 2.25% by early-2026.
Weekly Economic & Financial Commentary: The Outlook for Longer-Term Interest Rates
Summary
United States: Jobs Up, Rate Cut Expectations Down
- Nonfarm payrolls blew past expectations in September, rising 254K. Upward revisions to the prior two months' data sweetened the headline gain and bucked the trend decline in hiring, while the unemployment rate unexpectedly ticked down a tenth to 4.1%. The solid jobs report tamped down expectations for another 50 bps rate cut at the FOMC's next meeting in November.
- Next week: NFIB Small Business Optimism Index (Tue.), CPI (Thu.), Consumer Sentiment (Fri.)
International: Faster Rate Cuts from the ECB Likely
- In the Eurozone, the September CPI report showed further progress on disinflation for the region’s economy. The combination of slower inflation and more downside risks to GDP growth has compelled us to update our forecast to include a faster pace of ECB rate cuts through early 2025.
- Next week: Japan Labor Cash Earnings (Tue.), Mexico CPI (Wed.), U.K. Monthly GDP (Fri.)
Interest Rate Watch: The Outlook for Longer-Term Interest Rates
- The FOMC cut the federal funds rate by 50 bps on Sept. 18, and other short-term interest rates promptly moved lower. However, longer-term yields generally have risen modestly since the FOMC reduced the federal funds rate a couple of weeks ago. For instance, the 10-year Treasury yield has climbed from 3.65% on September 17 to 3.95% today.
Credit Market Insights: On the Road Again: Student Loan On-Ramp Comes to an End
- As of the start of October, student loan borrowers who are late or miss payments can face credit reporting penalties, as the Biden administration’s year-long student loan “on-ramp” ended this month. For a portion of the over 40 million federal student loan borrowers, the end of the grace period means an additional financial hurdle for those who have missed payments.
Topic of the Week: Middle East Escalations Capture Attention
- A further escalation of miliary conflict in the Middle East captured headlines for most of this week. As the conflict intensified, market participants were reminded that the ongoing conflict in the region does not yet have an end in sight one year on from the start of the war.
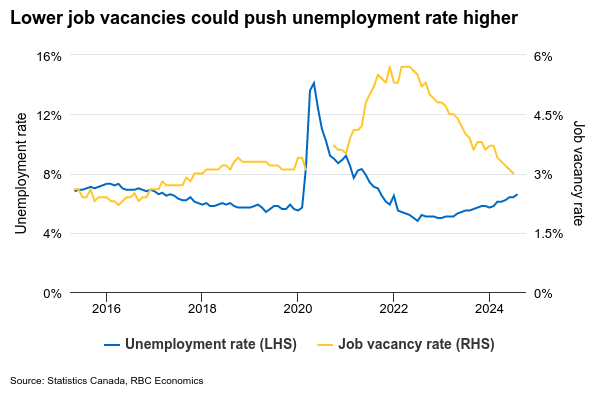
Weak Job Growth and Business Outlook Raise Odds of Larger BoC Rate Cut
The September jobs report and the Bank of Canada's Business Outlook Survey will be closely watched for signs of more economic weakness as the central bank considers whether to accelerate the pace of interest rate cuts.
The U.S. Federal Reserve kicked off its cutting cycle with a 50 basis point reduction in September—larger than the 25 basis point cuts from the BoC so far—but a strong September U.S. jobs report lowered the odds that the larger than “normal” cut will be repeated. However, the BoC has been willing to diverge from the Fed on monetary policy when Canadian economic conditions warrant it.
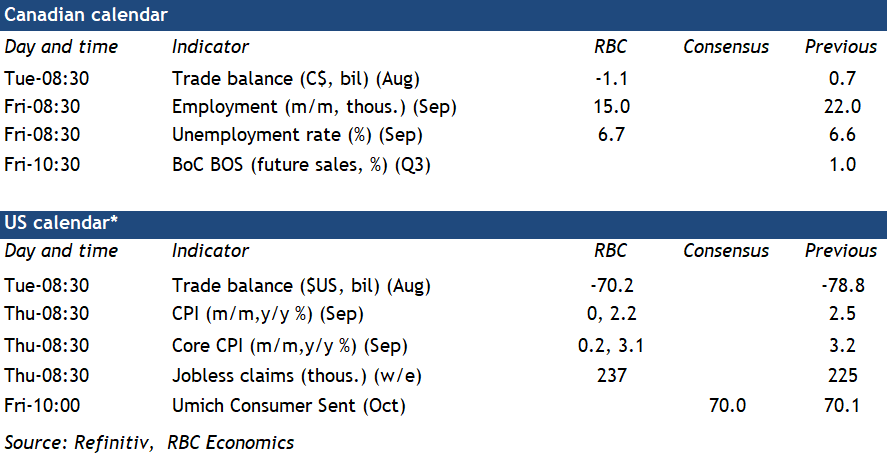
On Friday, we expect the Canadian unemployment rate ticked up again to 6.7% in September from 6.6% in August. That's 1.1 percentage points higher than a year ago and 1.9 percentage points above the lows after the pandemic. Much of the increase in unemployment has come from longer job search times, particularly for students entering the job market, rather than layoffs. Employment has continued to rise gradually, but not fast enough to keep up with rapid population and labour force growth. We expect that trend to continue in September with 15,000 jobs added, a modest slowing from 22,000 in August.
However, near-term risks remain for larger increases in unemployment. Job vacancies have continued to decline at a rapid pace (down more than 25% from a year ago) with early indicators (job postings on indeed.com) flagging that those declines continued into September. Wage growth has held up, but should continue to slow as hiring demand continues to cool.
Inflation indicators in the Q3 Business Outlook Survey on Friday will be analyzed for reassurance that price growth continues to slow, particularly in corporate pricing behaviour. The central bank is increasingly worried that the economy is slowing more than needed to get inflation sustainably back under control with Governor Tiff Macklem explicitly flagging risks that it could fall below the 2% target. While the start of the rate-cutting cycle and lower inflation could lead to some improvement in expected future sales and equipment investment, these gains are expected to remain minimal given the broader economic slowdown. BoC officials will also be watching for further deterioration in key capacity pressures, such as labour shortages and supply chain disruptions, which may signal deeper weakness in the economy. The Q2 survey already revealed labour shortages at their lowest level since the 2008/09 recession, outside of the pandemic period, underscoring softening labour demand and the risk of a sharper slowdown.
Week ahead data watch
The major data release in the U.S. will be the September consumer price index report on Thursday. Inflation pressures likely eased further, and we expect headline price growth decelerated from 2.5% year-over-year in August to 2.2%, thanks to lower energy prices. Excluding volatile energy and food components, core CPI likely came in at 3.1%, edging down from 3.2% in August.
On Tuesday, Canadian exports in August likely declined by 3% given the 6% reduction in oil prices, which natively impacted the energy trade balance. Imports are expected to lower by 0.6%, bringing the trade deficit to $1.1 billion.
We expect the U.S. trade deficit to narrow to US$70.2 billion from US$78.8 billion in the prior month. The goods deficit narrowed in August as well on higher exports (2.4%), and lower imports (-1.6%), according to the advance indicator.